Analysis Summary
Notes:
- 1) No attempt has been made to eliminate the non-significant decimal places.
- 2) This batgrbproduct analysis is done using the HEASARC data.
- 3) This batgrbproduct analysis is using the flight position for the mask-weighting calculation.
======================================================================
                  BAT GRB EVENT DATA PROCESSING REPORT
    Process Script Ver: batgrbproduct v2.46
    Process Start Time: Sun Jan 12 03:47:50 EST 2014
             Host Name: batevent1
   Current Working Dir: /local/data/batevent/batevent_reproc/trigger555096
======================================================================

  Trigger: 00555096      Segment: 000

  BAT Trigger Time: 389325944.832   [s; MET]
      Trigger Stop: 389325946.24   [s; MET]
               UTC: 2013-05-04T02:05:34.317800    [includes UTCF correction]
       Where From?: TDRSS position message

  BAT
    RA: 272.364553349823   Dec: -16.3442262783641  [deg; J2000]

     Catalogged Source?: NO
     Point Source?:      YES
     GRB Indicated?:     YES    [ by BAT flight software ]
     Image S/N Ratio:    7.07
     Image Trigger?:     NO
     Rate S/N Ratio:     10.4403065089106  [ if not an image trigger ]
     Image S/N Ratio:    7.07

  Analysis Position:   [ source = BAT ]
    RA: 272.364553349823   Dec: -16.3442262783641  [deg; J2000]

  Refined Position:   [ source = BAT pre-slew burst ]
    RA: 272.459067310363   Dec: -16.3219821254997  [deg; J2000]
        { 18h 09m 50.2s , -16d 19' 19.1" }
         +/- 1.30482159977783 [arcmin] (estimated 90% radius based on SNR)
         +/- 0.456933450502141 [arcmin] (formal 1-sigma fit error)
    SNR: 20.7991375327557

  Angular difference between the analysis and refined position is 5.603252 arcmin

  Partial Coding Fraction: 1.015625    [ including projection effects ]

  Duration
     T90: 120.03200006485 +/- 25.3356602599086
        Measured from: -28.3120000362396
                   to: 91.7200000286102     [s; relative to TRIGTIME]
     T50: 38.9920000433922 +/- 16.6190098758881
        Measured from: -12.37600004673
                   to: 26.6159999966621     [s; relative to TRIGTIME]


  Fluence
     Peak Flux  (peak 1 second)
        Measured from: -0.0200000405311584
                   to: 0.979999959468842     [s; relative to TRIGTIME]
     Total Fluence
        Measured from: -31.0640000104904
                   to: 99.62399995327     [s; relative to TRIGTIME]

             Band 1     Band 2     Band 3     Band 4
              15-25      25-50     50-100    100-350     keV
 Total     0.665861   0.728924   0.563894   0.079482
           0.078849   0.070146   0.058620   0.049746 [error]
 Peak      0.032315   0.045884   0.020507   0.013636
           0.007224   0.006709   0.005576   0.004635 [error]

     [ fluence units of on-axis counts / fully illuminated detector ]

======================================================================


====== Table of the duration information =============================

        Value   tstart    tstop
T100  130.688  -31.064   99.624
T90   120.032  -28.312   91.720
T50    38.992  -12.376   26.616
Peak    1.000   -0.020    0.980


====== Spectral Analysis Summary =====================================

Model      : spectral model: simple power-law (PL) and cutoff power-law (CPL)
Ph_index   : photon index: E^{Ph_index}
Ph_90err   : 90% error of the photon index
Epeak      : Epeak in keV
Epeak_90err: 90% error of Epeak
Norm       : normalization at 50 keV in both the PL model and CPL model
Nomr_90err : 90% error of the normalization
chi2       : Chi-Squared
dof        : degree of freedo

=== Time-averaged spectral analysis ===
(Best model with acceptable fit: N/A)

Model Ph_index Ph_90err_low Ph_90err_hi  Epeak  Epeak_90err_low  Epeak_90err_hi  Norm       Nomr_90err_low    Norm_90err_hi    chi2    dof
PL      -1.610    -0.177      0.175       -           -               -         9.78e-04     -1.03e-04          1.02e-04      71.700   57
CPL     -0.960    -0.684      0.820       76.123     -21.057       -76.123      2.14e-03     -1.18e-03          3.47e-03      69.090   56


=== 1-s peak spectral analysis ===
(Best model with acceptable fit: PL)

Model Ph_index Ph_90err_low Ph_90err_hi  Epeak  Epeak_90err_low  Epeak_90err_hi  Norm       Nomr_90err_low    Norm_90err_hi    chi2    dof
PL      -1.603     -0.310     0.306       -           -               -         6.68e-03     -1.26e-03          1.24e-03      44.750   57
CPL     -1.002     -0.870     1.895       73.940      N/A           N/A         1.44e-02        N/A               N/A         44.120   56


=== Fluence/Peak Flux Summary ===

              Model    Band1     Band2     Band3     Band4     Band5     Total
                       15-25     25-50    50-100    100-350    15-150    15-350    keV
Fluence         PL   1.81e-07  3.11e-07  4.08e-07  1.08e-06  1.19e-06  1.98e-06   erg/cm2
      90%_error_low -2.93e-08 -3.20e-08 -5.61e-08 -2.84e-07 -1.34e-07 -3.37e-07   erg/cm2
      90%_error_hi   3.06e-08  3.19e-08  5.62e-08  3.48e-07  1.35e-07  3.87e-07   erg/cm2
Peak flux       PL   3.03e-01  2.87e-01  1.89e-01  1.93e-01  8.59e-01  9.73e-01   ph/cm2/s
      90%_error_low -8.52e-02 -5.35e-02 -4.49e-02 -7.81e-02 -1.55e-01 -1.75e-01   ph/cm2/s
      90%_error_hi   9.11e-02  5.30e-02  4.48e-02  1.06e-01  1.55e-01  1.76e-01   ph/cm2/s

Fluence        CPL   1.64e-07  3.32e-07  4.15e-07  4.23e-07  1.13e-06  1.33e-06   erg/cm2
      90%_error_low -3.48e-08 -3.93e-08 -6.18e-08 -2.51e-07 -1.49e-07 -2.95e-07   erg/cm2
      90%_error_hi   3.52e-08  4.07e-08  6.19e-08  7.21e-07  1.52e-07  7.24e-07   erg/cm2
Peak flux      CPL   2.83e-01  3.08e-01  1.92e-01  8.89e-02  8.39e-01  8.72e-01   ph/cm2/s
      90%_error_low -9.61e-02 -6.60e-02 -5.46e-02 -8.89e-02 -1.62e-01 -1.87e-01   ph/cm2/s
      90%_error_hi   1.00e-01  7.71e-02  4.96e-02  1.23e-01  1.61e-01  2.26e-01   ph/cm2/s

======================================================================
Image
Pre-slew 15.0-350.0 keV image (Event data)
#   RAcent    DECcent   POSerr    Theta     Phi              Peak Cts       SNR   Name
  272.4591   -16.3220   0.0093    13.8605  -173.7126         1.9221961     20.799 TRIG_00555096

Foreground time interval of the image:
-31.064  21.669 (delta_t =  52.733 [sec])
Background time interval of the image:
-239.832 -31.064 (delta_t = 208.768 [sec])
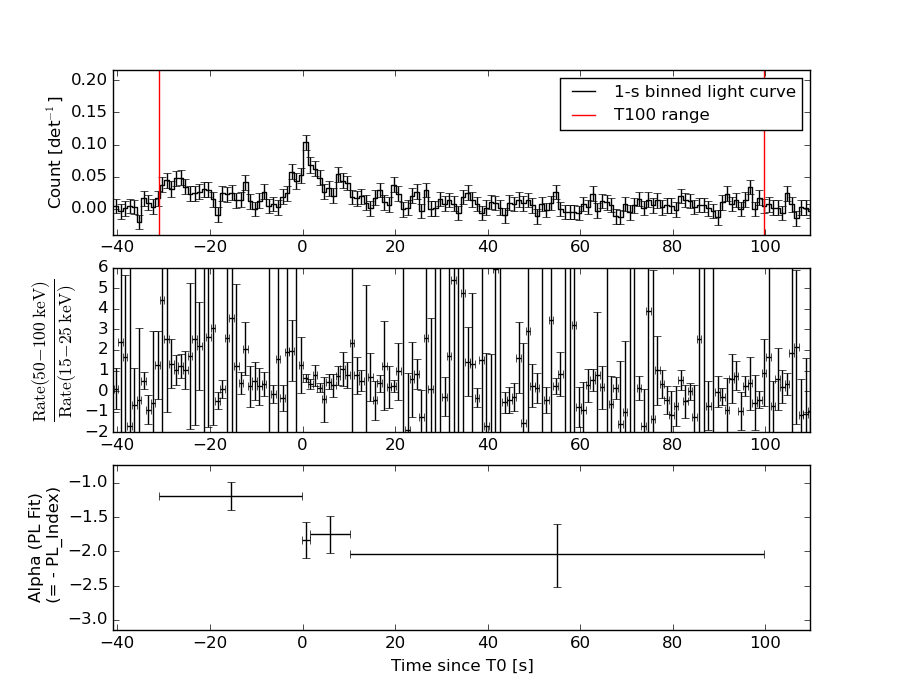
Light Curves
Note: The mask-weighted lightcurves have units of either count/det or counts/sec/det, where a det is 0.4 x 0.4 = 0.16 sq cm.
Full-time range; 1 s binning
Other quick-look light curves:
- 64 ms binning (zoomed)
- 16 ms binning (zoomed)
- 8 ms binning (zoomed)
- 2 ms binning (zoomed)
- SN=5 or 10 s binning (full-time range)
- Raw light curve
Spectra
- 64 ms binning (zoomed)
- 16 ms binning (zoomed)
- 8 ms binning (zoomed)
- 2 ms binning (zoomed)
- SN=5 or 10 s binning (full-time range)
- Raw light curve
Spectra
Notes:
- 1) The fitting includes the systematic errors.
- 2) When the burst includes telescope slew time periods, the fitting uses an average response file made from multiple 5-s response files through out the slew time plus single time preiod for the non-slew times, and weighted by the total counts in the corresponding time period using addrmf. An average response file is needed becuase a spectral fit using the pre-slew DRM will introduce some errors in both a spectral shape and a normalization if the PHA file contains a lot of the slew/post-slew time interval.
- 3) For fits to more complicated models (e.g. a power-law over a cutoff power-law), the BAT team has decided to require a chi-square improvement of more than 6 for each extra dof.
Time averaged spectrum fit using the average DRM
Power-law model
Time interval is from  -31.064 sec. to   99.624 sec.

Spectral model in power-law:
------------------------------------------------------------
Parameters  : value       lower 90%   higher 90%
Photon index: -1.60955     ( -0.176926   0.175058 )
Norm@50keV  : 9.78043E-04    ( -0.000102678   0.00010189 )
------------------------------------------------------------
#Fit statistic : Chi-Squared =          71.70 using 59 PHA bins.
# Reduced chi-squared =          1.258 for     57 degrees of freedom
# Null hypothesis probability =   9.093038e-02

Photon flux (15-150 keV)    in 130.7 sec: 0.126062 ( -0.012854  0.01288 ) ph/cm2/s
Energy fluence (15-150 keV)             : 1.19428e-06 ( -1.33545e-07  1.35183e-07 ) ergs/cm2
Cutoff power-law model
Time interval is from  -31.064 sec. to   99.624 sec.
Spectral model in the cutoff power-law:
------------------------------------------------------------
Parameters  : value       lower 90%   higher 90%
Photon index: -0.960219     ( -0.68363   0.820497 )
Epeak [keV] : 76.1229      ( -21.0569 -76.1229 )
Norm@50keV  : 2.13724E-03    ( -0.00117695   0.00346662 )
------------------------------------------------------------
#Fit statistic : Chi-Squared =          69.09 using 59 PHA bins.
# Reduced chi-squared =          1.234 for     56 degrees of freedom
# Null hypothesis probability =   1.124194e-01

Photon flux (15-150 keV)    in 130.7 sec: 0.122083 ( -0.013564  0.013548 ) ph/cm2/s
Energy fluence (15-150 keV)             : 1.12617e-06 ( -1.48901e-07  1.52222e-07 ) ergs/cm2
1-s peak spectrum fit
Power-law model
Time interval is from   -0.020 sec. to    0.980 sec.

Spectral model in power-law:
------------------------------------------------------------
Parameters  : value       lower 90%   higher 90%
Photon index: -1.60286     ( -0.310417   0.305578 )
Norm@50keV  : 6.67547E-03    ( -0.00126318   0.00124501 )
------------------------------------------------------------
#Fit statistic : Chi-Squared =          44.75 using 59 PHA bins.
# Reduced chi-squared =         0.7851 for     57 degrees of freedom
# Null hypothesis probability =   8.806378e-01

Photon flux (15-150 keV)    in 1 sec: 0.858620 ( -0.155145  0.15547 ) ph/cm2/s
Energy fluence (15-150 keV)             : 6.24166e-08 ( -1.2473e-08  1.27284e-08 ) ergs/cm2
Cutoff power-law model
Time interval is from   -0.020 sec. to    0.980 sec.
Spectral model in the cutoff power-law:
------------------------------------------------------------
Parameters  : value       lower 90%   higher 90%
Photon index: -1.00165     ( -0.870533   1.89433 )
Epeak [keV] : 73.9397      (   )
Norm@50keV  : 1.43987E-02    (     )
------------------------------------------------------------
#Fit statistic : Chi-Squared =          44.12 using 59 PHA bins.
# Reduced chi-squared =         0.7879 for     56 degrees of freedom
# Null hypothesis probability =   8.746635e-01

Photon flux (15-150 keV)    in 1 sec: 0.839216 ( -0.161571  0.160964 ) ph/cm2/s
Energy fluence (15-150 keV)             : 5.8475e-08 ( -1.51748e-08  1.51033e-08 ) ergs/cm2
Time-resolved spectra
Distribution
T90 vs. Hardness ratio plot
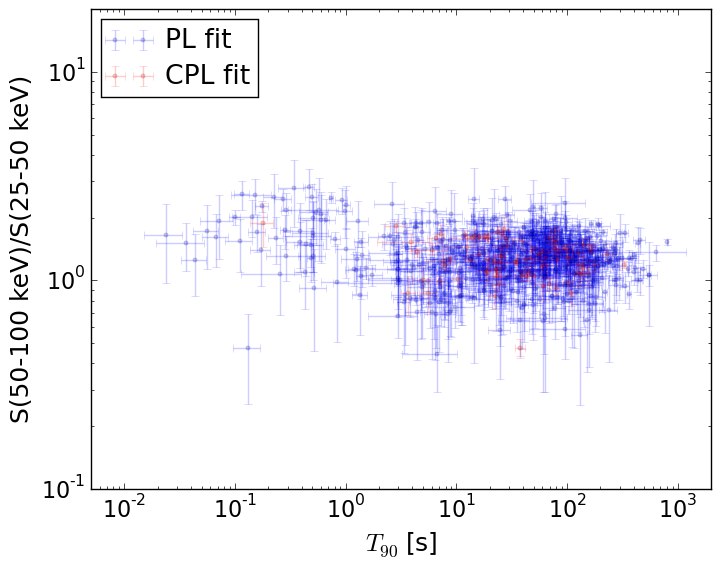
T90                                   = N/A sec.
Hardness ratio (energy fluence ratio) = N/A
S(15-50 keV) vs. S(50-150 keV) plot
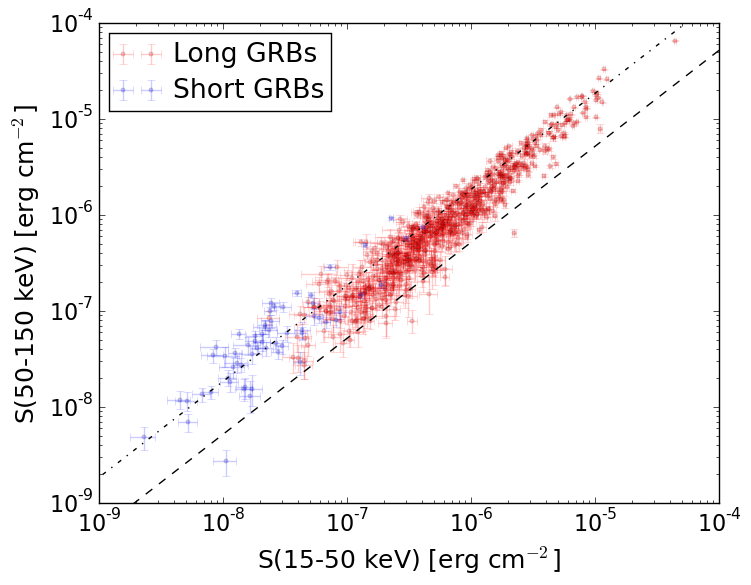
S(15-50 keV)  = N/A
S(50-150 keV) = N/A
The dash-dotted line and the dashed line traces the fluences calculated from the Band function with Epeak = 15 and 150 keV, respectively. Both lines assume a canonical values of alpha = -1 and beta = -2.5.
Mask shadow pattern
IMX = -2.452599905297882E-01, IMY = 2.702226795383771E-02
Spacecraft aspect plot
Bright source in the pre-burst/pre-slew/post-slew images
Pre-burst image of 15-350 keV band
Time interval of the image:
-239.832000 -31.064000

# RAcent  DECcent POSerr Theta    Phi  PeakCts   SNR AngSep     Name
#  [deg]    [deg]    ['] [deg]  [deg]                   [']
244.9818 -15.6425    0.3  23.8  100.8  14.2649  40.8    0.2	Sco X-1
256.1066 -37.8200    4.9  12.3   22.8   0.5633   2.3    5.9	4U 1700-377
256.3160 -36.3988    4.7  11.2   27.6   0.6420   2.4    5.9	GX 349+2
262.8637 -24.8564    6.8   5.2  123.3   0.3986   1.7   10.3	GX 1+4
264.6408 -44.5831   11.3  15.6  -14.1   0.2394   1.0    9.1	4U 1735-44
268.2905  -1.2740    0.0  27.8  165.3   0.6192   2.1   11.7	SW J1753.5-0127
270.4120 -25.1475    4.3   5.3 -155.1   0.7153   2.8    8.1	GX 5-1
270.3843 -25.6826    4.8   4.9 -151.1   0.7670   3.0    5.7	GRS 1758-258
273.9804 -14.0077    2.4  16.6 -172.1   1.0953   4.8    2.3	GX 17+2
276.1007 -30.3786    4.3   8.5  -97.1   0.6148   2.7    9.1	H1820-303
285.0268 -24.9096  220.0  17.1 -118.2  -0.0139  -0.1    0.8	HT1900.1-2455
288.7897  10.9351    1.7  45.4 -167.1   3.3158   6.7    0.8	GRS 1915+105
263.0329 -33.8885    4.3   5.7   10.9   0.6132   2.7    3.9	GX 354-0
296.8399  22.3012    3.4  59.1 -165.6   5.2967   3.4 ------	UNKNOWN
300.1702  20.8408    3.2  59.5 -161.7   7.4639   3.6 ------	UNKNOWN
310.6652  -4.6248    3.6  48.4 -130.3   3.4112   3.2 ------	UNKNOWN
Pre-slew background subtracted image of 15-350 keV band
Time interval of the image:
-31.064000 21.668600

# RAcent  DECcent POSerr Theta    Phi  PeakCts   SNR AngSep     Name
#  [deg]    [deg]    ['] [deg]  [deg]                   [']
244.9166 -15.6336  172.3  23.9  100.7   0.0085   0.1    3.7	Sco X-1
255.9681 -38.0022    4.4  12.5   22.6   0.2451   2.6    9.5	4U 1700-377
256.2879 -36.3261    3.4  11.2   28.0  -0.3221  -3.4    9.2	GX 349+2
262.8851 -24.6186    5.1   5.4  124.9  -0.2146  -2.3   10.2	GX 1+4
264.7992 -44.4384    4.8  15.5  -14.4   0.2169   2.4    2.5	4U 1735-44
268.3833  -1.4109   74.2  27.7  165.5   0.0184   0.2    2.7	SW J1753.5-0127
270.4800 -25.0089   12.4   5.4 -155.6  -0.0840  -0.9   11.4	GX 5-1
270.4867 -25.7110    7.4   4.9 -150.1   0.1474   1.6   10.1	GRS 1758-258
273.9904 -14.0152    4.1  16.6 -172.0  -0.2617  -2.8    1.6	GX 17+2
275.8485 -30.4305    3.8   8.3  -96.6   0.2758   3.0    5.5	H1820-303
284.8729 -24.9049    5.5  16.9 -118.4   0.2183   2.1    8.9	HT1900.1-2455
288.8023  10.9391    4.9  45.4 -167.0   0.3884   2.3    0.5	GRS 1915+105
262.9710 -33.6689   13.7   5.5   12.6  -0.0765  -0.8   10.0	GX 354-0
278.2582   8.2434    2.4  39.0 -179.9   0.6843   4.8 ------	UNKNOWN
272.4591 -16.3220    0.6  13.9 -173.7   1.9222  20.8 ------	UNKNOWN
269.0499 -44.0677    2.4  15.2  -26.0   0.4218   4.8 ------	UNKNOWN
Post-slew image of 15-350 keV band
Time interval of the image:
68.468590 962.312600

# RAcent  DECcent POSerr Theta    Phi  PeakCts   SNR AngSep     Name
#  [deg]    [deg]    ['] [deg]  [deg]                   [']
244.9828 -15.6527    0.3  26.3   95.0  55.8380  41.8    0.8	Sco X-1
254.5029  35.2175    4.8  54.3  169.4   8.9587   2.4    7.8	Her X-1
256.1703 -37.9299    9.5  25.9   37.7   1.2991   1.2   10.1	4U 1700-377
256.6184 -36.5223    5.6  24.5   39.1   2.0580   2.0   10.6	GX 349+2
263.1617 -24.6184    6.9  11.9   52.1   1.4334   1.7   11.3	GX 1+4
264.7486 -44.4464   14.4  28.8   18.7   0.7697   0.8    0.3	4U 1735-44
268.4408  -1.5303    3.5  15.3  172.3   2.5950   3.3    6.4	SW J1753.5-0127
270.2770 -25.0830    2.4   9.0   19.7   3.5808   4.8    0.4	GX 5-1
270.2342 -25.8065    6.3   9.7   18.9   1.3942   1.8    5.3	GRS 1758-258
274.0167 -14.0834    3.0   2.8 -137.4   3.1548   3.9    2.9	GX 17+2
275.8424 -30.3491    7.9  14.4   -4.8   1.0706   1.5    4.4	H1820-303
285.0126 -24.8981    5.8  14.6  -44.7   1.7237   2.0    1.9	HT1900.1-2455
288.8020  10.9433    1.0  31.8 -140.8  11.9825  11.3    0.3	GRS 1915+105
263.0555 -33.8079    3.9  19.4   31.3   2.2959   3.0    3.7	GX 354-0
232.8420 -54.6469    3.2  48.9   36.6  12.0047   3.6 ------	UNKNOWN
251.8171  20.3052    2.7  41.8  157.8   7.5242   4.3 ------	UNKNOWN
270.0683 -10.4504    4.1   6.3  166.3   2.3502   2.8 ------	UNKNOWN
277.3487 -23.8842    2.6   8.9  -23.6   3.6783   4.5 ------	UNKNOWN
303.7942 -22.2281    4.3  30.2  -66.4   2.9712   2.7 ------	UNKNOWN
285.1539  42.0215    4.0  59.6 -161.6  21.6284   2.9 ------	UNKNOWN
287.4182  40.7217    4.7  58.8 -159.3  16.4906   2.5 ------	UNKNOWN
	UNKNOWN