Analysis Summary
Notes:
- 1) No attempt has been made to eliminate the non-significant decimal places.
- 2) This batgrbproduct analysis is done using the HEASARC data.
- 3) This batgrbproduct analysis is using the flight position for the mask-weighting calculation.
======================================================================
BAT GRB EVENT DATA PROCESSING REPORT
Process Script Ver: batgrbproduct v2.46
Process Start Time: Sun Jan 12 03:32:02 EST 2014
Host Name: batevent1
Current Working Dir: /local/data/batevent/batevent_reproc/trigger555413
======================================================================
Trigger: 00555413 Segment: 000
BAT Trigger Time: 389725744 [s; MET]
Trigger Stop: 389725808 [s; MET]
UTC: 2013-05-08T17:08:53.468120 [includes UTCF correction]
Where From?: TDRSS position message
BAT
RA: 305.312531851058 Dec: 34.9494108084652 [deg; J2000]
Catalogged Source?: NO
Point Source?: YES
GRB Indicated?: YES [ by BAT flight software ]
Image S/N Ratio: 10.58
Image Trigger?: YES
Rate S/N Ratio: 0 [ if not an image trigger ]
Image S/N Ratio: 10.58
Analysis Position: [ source = BAT ]
RA: 305.312531851058 Dec: 34.9494108084652 [deg; J2000]
Refined Position: [ source = BAT pre-slew burst ]
RA: 305.355067905114 Dec: 34.9773647885541 [deg; J2000]
{ 20h 21m 25.2s , +34d 58' 38.5" }
+/- 1.91253012898756 [arcmin] (estimated 90% radius based on SNR)
+/- 0.857067080276658 [arcmin] (formal 1-sigma fit error)
SNR: 12.0453889818615
Angular difference between the analysis and refined position is 2.680987 arcmin
Partial Coding Fraction: 0.609375 [ including projection effects ]
Duration
T90: 42.9120000600815 +/- 10.1276240195608
Measured from: 11.3519999980927
to: 54.2640000581741 [s; relative to TRIGTIME]
T50: 22.6080000400543 +/- 5.75297350205848
Measured from: 15.2400000095367
to: 37.8480000495911 [s; relative to TRIGTIME]
Fluence
Peak Flux (peak 1 second)
Measured from: 11.0519999861717
to: 12.0519999861717 [s; relative to TRIGTIME]
Total Fluence
Measured from: 10.1520000100136
to: 58.727999985218 [s; relative to TRIGTIME]
Band 1 Band 2 Band 3 Band 4
15-25 25-50 50-100 100-350 keV
Total 0.391673 0.466718 0.215761 0.045362
0.051705 0.053582 0.047808 0.044991 [error]
Peak 0.018086 0.029338 0.026861 0.009417
0.007364 0.007743 0.007004 0.006760 [error]
[ fluence units of on-axis counts / fully illuminated detector ]
======================================================================
====== Table of the duration information =============================
Value tstart tstop
T100 48.576 10.152 58.728
T90 42.912 11.352 54.264
T50 22.608 15.240 37.848
Peak 1.000 11.052 12.052
====== Spectral Analysis Summary =====================================
Model : spectral model: simple power-law (PL) and cutoff power-law (CPL)
Ph_index : photon index: E^{Ph_index}
Ph_90err : 90% error of the photon index
Epeak : Epeak in keV
Epeak_90err: 90% error of Epeak
Norm : normalization at 50 keV in both the PL model and CPL model
Nomr_90err : 90% error of the normalization
chi2 : Chi-Squared
dof : degree of freedo
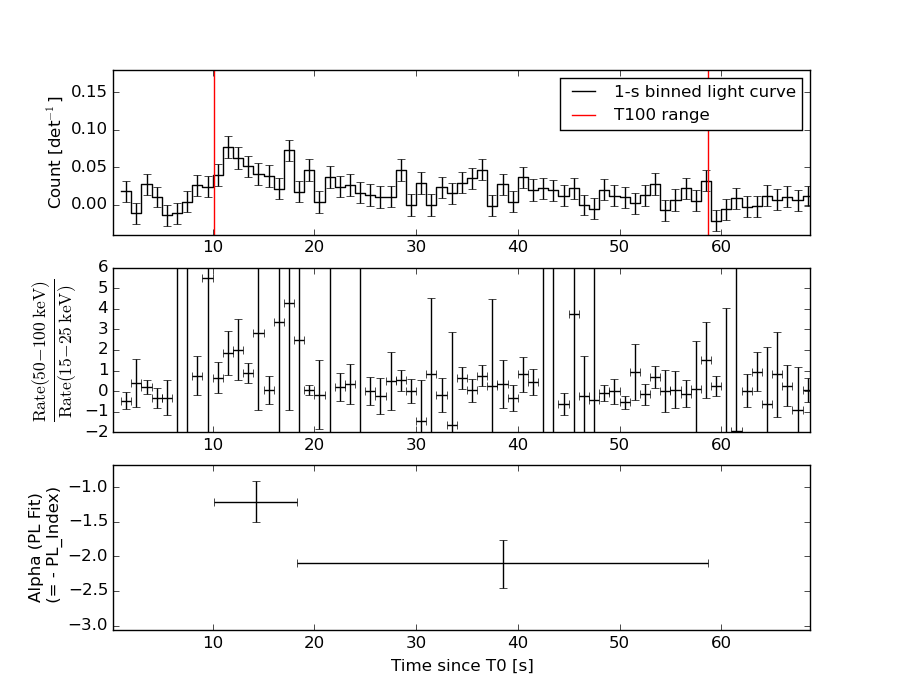
=== Time-averaged spectral analysis ===
(Best model with acceptable fit: PL)
Model Ph_index Ph_90err_low Ph_90err_hi Epeak Epeak_90err_low Epeak_90err_hi Norm Nomr_90err_low Norm_90err_hi chi2 dof
PL -1.845 -0.256 0.243 - - - 1.38e-03 -2.35e-04 2.29e-04 57.550 57
CPL -1.185 -0.989 1.646 48.455 N/A N/A 3.44e-03 N/A N/A 56.680 56
=== 1-s peak spectral analysis ===
(Best model with acceptable fit: PL)
Model Ph_index Ph_90err_low Ph_90err_hi Epeak Epeak_90err_low Epeak_90err_hi Norm Nomr_90err_low Norm_90err_hi chi2 dof
PL -1.272 -0.533 0.563 - - - 5.03e-03 -1.47e-03 1.46e-03 41.780 57
CPL -1.270 -0.534 0.568 9999.310 -9999.310 -9999.310 5.05e-03 -1.48e-03 4.50e-02 41.780 56
=== Fluence/Peak Flux Summary ===
Model Band1 Band2 Band3 Band4 Band5 Total
15-25 25-50 50-100 100-350 15-150 15-350 keV
Fluence PL 1.18e-07 1.76e-07 1.96e-07 4.12e-07 6.14e-07 9.02e-07 erg/cm2
90%_error_low -2.22e-08 -2.40e-08 -4.44e-08 -1.59e-07 -1.03e-07 -2.13e-07 erg/cm2
90%_error_hi 2.27e-08 2.40e-08 4.57e-08 2.17e-07 1.06e-07 2.60e-07 erg/cm2
Peak flux PL 1.66e-01 1.92e-01 1.59e-01 2.21e-01 5.97e-01 7.38e-01 ph/cm2/s
90%_error_low -8.41e-02 -6.54e-02 -5.71e-02 -1.30e-01 -1.76e-01 -2.22e-01 ph/cm2/s
90%_error_hi 9.69e-02 6.21e-02 5.54e-02 2.21e-01 1.77e-01 2.35e-01 ph/cm2/s
Fluence CPL 1.14e-07 1.91e-07 1.84e-07 1.19e-07 5.60e-07 6.08e-07 erg/cm2
90%_error_low -2.44e-08 -4.09e-08 -6.66e-08 N/A -1.26e-07 -1.71e-07 erg/cm2
90%_error_hi 2.41e-08 3.84e-08 5.35e-08 N/A 1.40e-07 3.61e-07 erg/cm2
Peak flux CPL 1.69e-01 1.90e-01 1.57e-01 2.60e-01 6.00e-01 7.58e-01 ph/cm2/s
90%_error_low -9.45e-02 -6.58e-02 -5.73e-02 N/A -1.85e-01 -3.15e-01 ph/cm2/s
90%_error_hi 8.79e-02 7.42e-02 6.24e-02 N/A 1.79e-01 2.01e-01 ph/cm2/s
======================================================================
Image
Pre-slew 15.0-350.0 keV image (Event data)

#   RAcent    DECcent   POSerr    Theta     Phi              Peak Cts       SNR   Name
  305.3551    34.9774   0.0159    20.9843    85.9116         1.3505782     12.045 TRIG_00555413

Foreground time interval of the image:
 10.152  58.728 (delta_t =  48.576 [sec])
Background time interval of the image:
-567.599 -553.259 (delta_t =  14.340 [sec])
-239.000  10.152 (delta_t = 249.152 [sec])
Light Curves
Note: The mask-weighted lightcurves have units of either count/det or counts/sec/det, where a det is 0.4 x 0.4 = 0.16 sq cm.
Full-time range; 1 s binning
Other quick-look light curves:
- 64 ms binning (zoomed)
- 16 ms binning (zoomed)
- 8 ms binning (zoomed)
- 2 ms binning (zoomed)
- SN=5 or 10 s binning (full-time range)
- Raw light curve
Spectra
- 64 ms binning (zoomed)
- 16 ms binning (zoomed)
- 8 ms binning (zoomed)
- 2 ms binning (zoomed)
- SN=5 or 10 s binning (full-time range)
- Raw light curve
Spectra
Notes:
- 1) The fitting includes the systematic errors.
- 2) When the burst includes telescope slew time periods, the fitting uses an average response file made from multiple 5-s response files through out the slew time plus single time preiod for the non-slew times, and weighted by the total counts in the corresponding time period using addrmf. An average response file is needed becuase a spectral fit using the pre-slew DRM will introduce some errors in both a spectral shape and a normalization if the PHA file contains a lot of the slew/post-slew time interval.
- 3) For fits to more complicated models (e.g. a power-law over a cutoff power-law), the BAT team has decided to require a chi-square improvement of more than 6 for each extra dof.
Time averaged spectrum fit using the average DRM
Power-law model
Time interval is from   10.152 sec. to   58.728 sec.

Spectral model in power-law:
------------------------------------------------------------
Parameters  : value       lower 90%   higher 90%
Photon index: -1.84532     ( -0.256309   0.24275 )
Norm@50keV  : 1.37536E-03    ( -0.000234634   0.000228556 )
------------------------------------------------------------
#Fit statistic : Chi-Squared =          57.55 using 59 PHA bins.
# Reduced chi-squared =          1.010 for     57 degrees of freedom
# Null hypothesis probability =   4.545541e-01

Photon flux (15-150 keV)    in 48.58 sec: 0.192966 ( -0.026128  0.026128 ) ph/cm2/s
Energy fluence (15-150 keV)             : 6.14493e-07 ( -1.02968e-07  1.06328e-07 ) ergs/cm2
Cutoff power-law model
Time interval is from   10.152 sec. to   58.728 sec.
Spectral model in the cutoff power-law:
------------------------------------------------------------
Parameters  : value       lower 90%   higher 90%
Photon index: -1.18523     ( -0.990018   1.64526 )
Epeak [keV] : 48.4551      (   )
Norm@50keV  : 3.44342E-03    (     )
------------------------------------------------------------
#Fit statistic : Chi-Squared =          56.68 using 59 PHA bins.
# Reduced chi-squared =          1.012 for     56 degrees of freedom
# Null hypothesis probability =   4.494813e-01

Photon flux (15-150 keV)    in 48.58 sec: 0.188132 ( -0.027569  0.027562 ) ph/cm2/s
Energy fluence (15-150 keV)             : 5.60322e-07 ( -1.25864e-07  1.40468e-07 ) ergs/cm2
1-s peak spectrum fit
Power-law model
Time interval is from   11.052 sec. to   12.052 sec.

Spectral model in power-law:
------------------------------------------------------------
Parameters  : value       lower 90%   higher 90%
Photon index: -1.27152     ( -0.53259   0.562685 )
Norm@50keV  : 5.02853E-03    ( -0.00146726   0.00146044 )
------------------------------------------------------------
#Fit statistic : Chi-Squared =          41.78 using 59 PHA bins.
# Reduced chi-squared =         0.7329 for     57 degrees of freedom
# Null hypothesis probability =   9.348790e-01

Photon flux (15-150 keV)    in 1 sec: 0.596888 ( -0.176167  0.176825 ) ph/cm2/s
Energy fluence (15-150 keV)             : 5.00507e-08 ( -1.62963e-08  1.67898e-08 ) ergs/cm2
Cutoff power-law model
Time interval is from   11.052 sec. to   12.052 sec.
Spectral model in the cutoff power-law:
------------------------------------------------------------
Parameters  : value       lower 90%   higher 90%
Photon index: -1.26982     ( -0.533735   0.567986 )
Epeak [keV] : 9999.31      ( -9999.36 -9999.36 )
Norm@50keV  : 5.04942E-03    ( -0.00147807   0.0450326 )
------------------------------------------------------------
#Fit statistic : Chi-Squared =          41.78 using 59 PHA bins.
# Reduced chi-squared =         0.7460 for     56 degrees of freedom
# Null hypothesis probability =   9.212593e-01

Photon flux (15-150 keV)    in 1 sec: 0.599622 ( -0.184528  0.178677 ) ph/cm2/s
Energy fluence (15-150 keV)             : 5.08382e-08 ( -2.16666e-08  1.91976e-08 ) ergs/cm2
Time-resolved spectra
Distribution
T90 vs. Hardness ratio plot
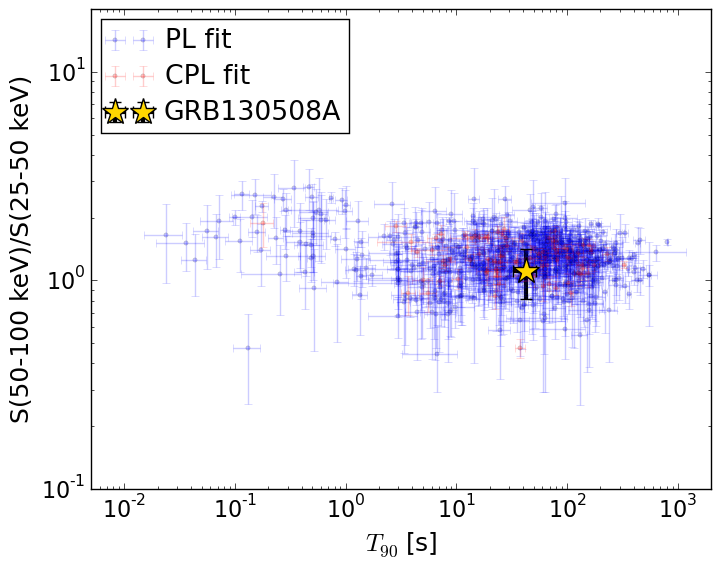
T90                                   = 42.912 sec.
Hardness ratio (energy fluence ratio) = 1.11321718982
S(15-50 keV) vs. S(50-150 keV) plot
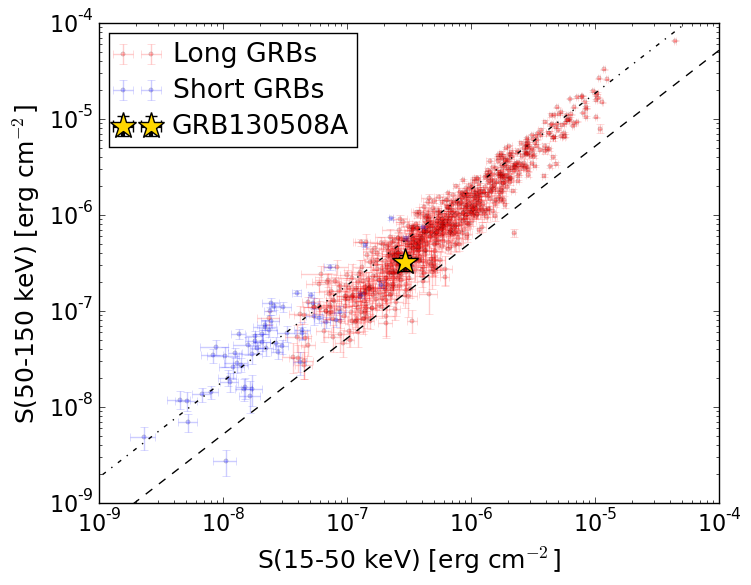
S(15-50 keV)  = 2.940054e-07
S(50-150 keV) = 3.204906e-07
The dash-dotted line and the dashed line traces the fluences calculated from the Band function with Epeak = 15 and 150 keV, respectively. Both lines assume a canonical values of alpha = -1 and beta = -2.5.
Mask shadow pattern
IMX = 2.734536579764521E-02, IMY = -3.825728259447613E-01
Spacecraft aspect plot
Bright source in the pre-burst/pre-slew/post-slew images
Pre-burst image of 15-350 keV band
Time interval of the image:
-567.599400 -553.259400
-239.000000 10.152000

# RAcent  DECcent POSerr Theta    Phi  PeakCts   SNR AngSep     Name
#  [deg]    [deg]    ['] [deg]  [deg]                   [']
299.8091  35.1423    4.3  25.0   91.6   0.8018   2.7   11.3	Cyg X-1
308.0677  40.9408    1.3  16.9  100.9   2.0216   8.6    2.1	Cyg X-3
326.0207  38.1469    0.0   5.5   50.0   0.4481   2.3   12.7	Cyg X-2
342.8144  20.3716    2.6  24.2  -20.9   0.9573   4.4 ------	UNKNOWN
 95.2446  74.1356    3.2  57.8 -156.7   5.1245   3.6 ------	UNKNOWN
Pre-slew background subtracted image of 15-350 keV band
Time interval of the image:
10.152000 58.728000

# RAcent  DECcent POSerr Theta    Phi  PeakCts   SNR AngSep     Name
#  [deg]    [deg]    ['] [deg]  [deg]                   [']
299.4789  35.0519   11.7  25.2   91.7   0.1303   1.0   10.5	Cyg X-1
307.8967  40.9504   10.8  17.0  101.1  -0.0982  -1.1    9.7	Cyg X-3
326.1504  38.2376    8.0   5.3   49.7  -0.1231  -1.4    5.1	Cyg X-2
305.3550  34.9773    1.0  21.0   85.9   1.3506  12.0 ------	UNKNOWN
Post-slew image of 15-350 keV band
Time interval of the image:
114.900600 570.400610

# RAcent  DECcent POSerr Theta    Phi  PeakCts   SNR AngSep     Name
#  [deg]    [deg]    ['] [deg]  [deg]                   [']
254.3255  35.2552   60.8  41.3  126.0   0.2557   0.2    8.3	Her X-1
288.8238  10.9324    1.0  28.3   56.3   5.7385  11.4    1.7	GRS 1915+105
299.5787  35.1876    1.7   4.7  114.8   2.1317   6.7    1.0	Cyg X-1
308.0659  40.9587    1.3   6.4 -140.9   3.1267   9.0    2.0	Cyg X-3
326.2106  38.3247    6.1  17.0  -87.3   0.6709   1.9    1.8	Cyg X-2
225.8305  66.3405    2.8  54.2  171.1   7.3603   4.2 ------	UNKNOWN
318.8863 -19.9374    2.2  56.4    4.9   8.6858   5.2 ------	UNKNOWN
235.6136  75.5145    2.5  51.3 -177.3   4.5656   4.6 ------	UNKNOWN
208.7522  78.1105    3.7  57.2 -173.9   5.9296   3.1 ------	UNKNOWN
336.5224 -14.6470    3.1  57.7  -16.1   5.5957   3.7 ------	UNKNOWN
118.7408  86.2517    5.1  58.8 -159.3   6.3822   2.2 ------	UNKNOWN
354.8777  75.3146    3.2  46.5 -144.3   2.8955   3.6 ------	UNKNOWN
351.2727  12.4823    3.0  47.1  -53.0   6.4597   3.9 ------	UNKNOWN