Analysis Summary
Notes:
- 1) No attempt has been made to eliminate the non-significant decimal places.
- 2) This batgrbproduct analysis is done using the HEASARC data.
- 3) This batgrbproduct analysis is using the flight position for the mask-weighting calculation.
======================================================================
BAT GRB EVENT DATA PROCESSING REPORT
Process Script Ver: batgrbproduct v2.46
Process Start Time: Sun Jan 12 03:25:53 EST 2014
Host Name: batevent1
Current Working Dir: /local/data/batevent/batevent_reproc/trigger555600
======================================================================
Trigger: 00555600 Segment: 000
BAT Trigger Time: 389964657.984 [s; MET]
Trigger Stop: 389964658.496 [s; MET]
UTC: 2013-05-11T11:30:47.441540 [includes UTCF correction]
Where From?: TDRSS position message
BAT
RA: 196.638702463752 Dec: 18.6976486270083 [deg; J2000]
Catalogged Source?: NO
Point Source?: YES
GRB Indicated?: YES [ by BAT flight software ]
Image S/N Ratio: 9.07
Image Trigger?: NO
Rate S/N Ratio: 17.0293863659264 [ if not an image trigger ]
Image S/N Ratio: 9.07
Analysis Position: [ source = BAT ]
RA: 196.638702463752 Dec: 18.6976486270083 [deg; J2000]
Refined Position: [ source = BAT pre-slew burst ]
RA: 196.647862245518 Dec: 18.6927658786719 [deg; J2000]
{ 13h 06m 35.5s , +18d 41' 34.0" }
+/- 1.93788954164244 [arcmin] (estimated 90% radius based on SNR)
+/- 0.887382560638733 [arcmin] (formal 1-sigma fit error)
SNR: 11.8208403788463
Angular difference between the analysis and refined position is 0.597362 arcmin
Partial Coding Fraction: 0.5703125 [ including projection effects ]
Duration
T90: 2.7399999499321 +/- 0.397854255722736
Measured from: -0.0120000243186951
to: 2.7279999256134 [s; relative to TRIGTIME]
T50: 1.87199991941452 +/- 0.397854255722736
Measured from: 0.175999999046326
to: 2.04799991846085 [s; relative to TRIGTIME]
Fluence
Peak Flux (peak 1 second)
Measured from: -0.0860000252723694
to: 0.913999974727631 [s; relative to TRIGTIME]
Total Fluence
Measured from: -0.0720000267028809
to: 2.83199995756149 [s; relative to TRIGTIME]
Band 1 Band 2 Band 3 Band 4
15-25 25-50 50-100 100-350 keV
Total 0.090618 0.086440 0.086362 0.039342
0.013742 0.014342 0.012778 0.011516 [error]
Peak 0.050412 0.060474 0.048483 0.010733
0.008424 0.009037 0.008097 0.007046 [error]
[ fluence units of on-axis counts / fully illuminated detector ]
======================================================================
====== Table of the duration information =============================
Value tstart tstop
T100 2.904 -0.072 2.832
T90 2.740 -0.012 2.728
T50 1.872 0.176 2.048
Peak 1.000 -0.086 0.914
====== Spectral Analysis Summary =====================================
Model : spectral model: simple power-law (PL) and cutoff power-law (CPL)
Ph_index : photon index: E^{Ph_index}
Ph_90err : 90% error of the photon index
Epeak : Epeak in keV
Epeak_90err: 90% error of Epeak
Norm : normalization at 50 keV in both the PL model and CPL model
Nomr_90err : 90% error of the normalization
chi2 : Chi-Squared
dof : degree of freedo
=== Time-averaged spectral analysis ===
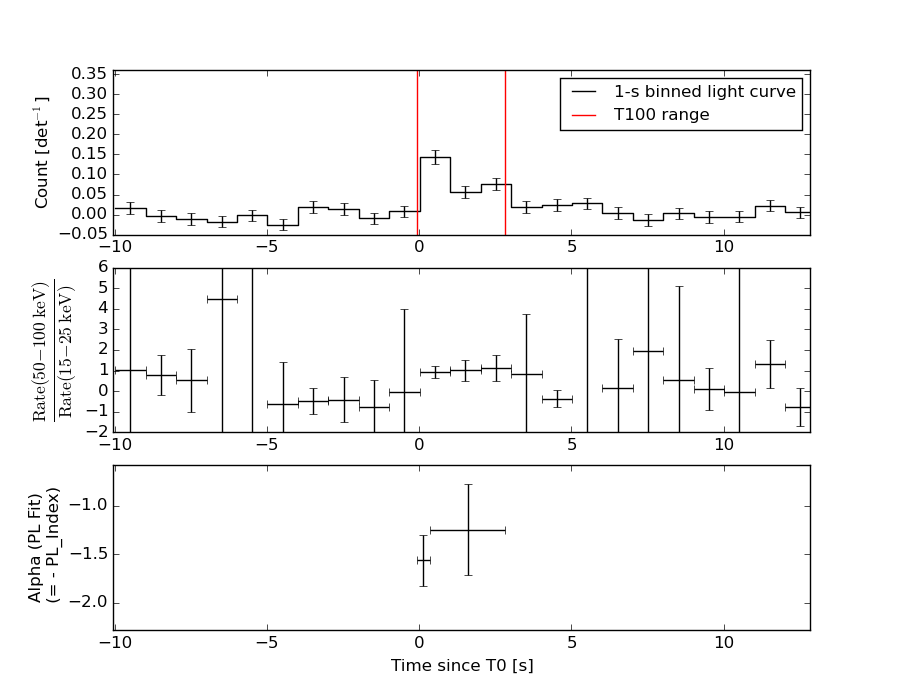
(Best model with acceptable fit: PL)
Model Ph_index Ph_90err_low Ph_90err_hi Epeak Epeak_90err_low Epeak_90err_hi Norm Nomr_90err_low Norm_90err_hi chi2 dof
PL -1.359 -0.279 0.280 - - - 6.13e-03 -9.53e-04 9.47e-04 53.880 57
CPL -1.325 -1.379 0.877 982.396 -982.396 -982.396 6.39e-03 -1.19e-03 -6.39e-03 53.920 56
=== 1-s peak spectral analysis ===
(Best model with acceptable fit: PL)
Model Ph_index Ph_90err_low Ph_90err_hi Epeak Epeak_90err_low Epeak_90err_hi Norm Nomr_90err_low Norm_90err_hi chi2 dof
PL -1.441 -0.280 0.280 - - - 1.03e-02 -1.73e-03 1.72e-03 65.080 57
CPL -1.285 N/A N/A 215.052 N/A N/A 1.25e-02 N/A N/A 65.000 56
=== Fluence/Peak Flux Summary ===
Model Band1 Band2 Band3 Band4 Band5 Total
15-25 25-50 50-100 100-350 15-150 15-350 keV
Fluence PL 1.99e-08 3.99e-08 6.23e-08 2.14e-07 1.74e-07 3.36e-07 erg/cm2
90%_error_low -5.30e-09 -6.62e-09 -1.26e-08 -8.10e-08 -3.03e-08 -9.22e-08 erg/cm2
90%_error_hi 5.65e-09 6.49e-09 1.24e-08 1.11e-07 3.08e-08 1.17e-07 erg/cm2
Peak flux PL 4.00e-01 4.16e-01 3.07e-01 3.64e-01 1.26e+00 1.49e+00 ph/cm2/s
90%_error_low -1.06e-01 -7.20e-02 -6.49e-02 -1.35e-01 -2.07e-01 -2.49e-01 ph/cm2/s
90%_error_hi 1.12e-01 7.11e-02 6.42e-02 1.78e-01 2.07e-01 2.54e-01 ph/cm2/s
Fluence CPL 2.01e-08 3.97e-08 6.20e-08 2.23e-07 1.74e-07 3.23e-07 erg/cm2
90%_error_low -6.05e-09 -6.59e-09 -1.27e-08 -1.64e-07 -3.25e-08 -1.45e-07 erg/cm2
90%_error_hi 5.67e-09 7.03e-09 1.34e-08 4.74e-08 2.22e-08 1.24e-07 erg/cm2
Peak flux CPL 3.92e-01 4.25e-01 3.10e-01 2.92e-01 1.26e+00 1.42e+00 ph/cm2/s
90%_error_low -1.17e-01 -7.86e-02 -6.70e-02 -2.92e-01 -2.10e-01 -3.16e-01 ph/cm2/s
90%_error_hi 1.15e-01 9.02e-02 6.97e-02 1.53e-01 2.10e-01 3.16e-01 ph/cm2/s
======================================================================
Image
Pre-slew 15.0-350.0 keV image (Event data)
#   RAcent    DECcent   POSerr    Theta     Phi              Peak Cts       SNR   Name
  196.6479    18.6928   0.0163    23.3829    64.3599         0.3039897     11.821 TRIG_00555600

Foreground time interval of the image:
 -0.072   2.832 (delta_t =   2.904 [sec])
Background time interval of the image:
-239.984  -0.072 (delta_t = 239.912 [sec])
Light Curves
Note: The mask-weighted lightcurves have units of either count/det or counts/sec/det, where a det is 0.4 x 0.4 = 0.16 sq cm.
Full-time range; 1 s binning
Other quick-look light curves:
- 64 ms binning (zoomed)
- 16 ms binning (zoomed)
- 8 ms binning (zoomed)
- 2 ms binning (zoomed)
- SN=5 or 10 s binning (full-time range)
- Raw light curve
Spectra
- 64 ms binning (zoomed)
- 16 ms binning (zoomed)
- 8 ms binning (zoomed)
- 2 ms binning (zoomed)
- SN=5 or 10 s binning (full-time range)
- Raw light curve
Spectra
Notes:
- 1) The fitting includes the systematic errors.
- 2) When the burst includes telescope slew time periods, the fitting uses an average response file made from multiple 5-s response files through out the slew time plus single time preiod for the non-slew times, and weighted by the total counts in the corresponding time period using addrmf. An average response file is needed becuase a spectral fit using the pre-slew DRM will introduce some errors in both a spectral shape and a normalization if the PHA file contains a lot of the slew/post-slew time interval.
- 3) For fits to more complicated models (e.g. a power-law over a cutoff power-law), the BAT team has decided to require a chi-square improvement of more than 6 for each extra dof.
Time averaged spectrum fit using the average DRM
Power-law model
Time interval is from   -0.072 sec. to    2.832 sec.

Spectral model in power-law:
------------------------------------------------------------
Parameters  : value       lower 90%   higher 90%
Photon index: -1.3591     ( -0.279249   0.279662 )
Norm@50keV  : 6.13270E-03    ( -0.000953225   0.000947467 )
------------------------------------------------------------
#Fit statistic : Chi-Squared =          53.88 using 59 PHA bins.
# Reduced chi-squared =         0.9453 for     57 degrees of freedom
# Null hypothesis probability =   5.928368e-01

Photon flux (15-150 keV)    in 2.904 sec: 0.740221 ( -0.114773  0.114983 ) ph/cm2/s
Energy fluence (15-150 keV)             : 1.73611e-07 ( -3.03468e-08  3.08155e-08 ) ergs/cm2
Cutoff power-law model

Time interval is from   -0.072 sec. to    2.832 sec.
Spectral model in the cutoff power-law:
------------------------------------------------------------
Parameters  : value       lower 90%   higher 90%
Photon index: -1.35588     ( -1.37906   0.877069 )
Epeak [keV] : 1.00000E+04      ( -10000 -10000 )
Norm@50keV  : 6.15607E-03    ( -0.000959513   -0.00615621 )
------------------------------------------------------------
#Fit statistic : Chi-Squared =          53.88 using 59 PHA bins.
# Reduced chi-squared =         0.9622 for     56 degrees of freedom
# Null hypothesis probability =   5.553756e-01

Photon flux (15-150 keV)    in 2.904 sec: 0.744662 (    ) ph/cm2/s
Energy fluence (15-150 keV)             : 1.74228e-07 ( -3.25384e-08  2.22381e-08 ) ergs/cm2
1-s peak spectrum fit
Power-law model
Time interval is from   -0.086 sec. to    0.914 sec.

Spectral model in power-law:
------------------------------------------------------------
Parameters  : value       lower 90%   higher 90%
Photon index: -1.44142     ( -0.280317   0.280249 )
Norm@50keV  : 1.02726E-02    ( -0.0017346   0.00171633 )
------------------------------------------------------------
#Fit statistic : Chi-Squared =          65.08 using 59 PHA bins.
# Reduced chi-squared =          1.142 for     57 degrees of freedom
# Null hypothesis probability =   2.160607e-01

Photon flux (15-150 keV)    in 1 sec: 1.26331 ( -0.20658  0.20675 ) ph/cm2/s
Energy fluence (15-150 keV)             : 9.84714e-08 ( -1.83276e-08  1.86699e-08 ) ergs/cm2
Cutoff power-law model
Time interval is from   -0.086 sec. to    0.914 sec.
Spectral model in the cutoff power-law:
------------------------------------------------------------
Parameters  : value       lower 90%   higher 90%
Photon index: -1.28493     (       )
Epeak [keV] : 215.052      (   )
Norm@50keV  : 1.24761E-02    (     )
------------------------------------------------------------
#Fit statistic : Chi-Squared =          65.00 using 59 PHA bins.
# Reduced chi-squared =          1.161 for     56 degrees of freedom
# Null hypothesis probability =   1.918498e-01

Photon flux (15-150 keV)    in 1 sec: 1.25675 ( -0.21007  0.21023 ) ph/cm2/s
Energy fluence (15-150 keV)             : 9.69483e-08 ( -2.0786e-08  1.98052e-08 ) ergs/cm2
Time-resolved spectra
Distribution
T90 vs. Hardness ratio plot
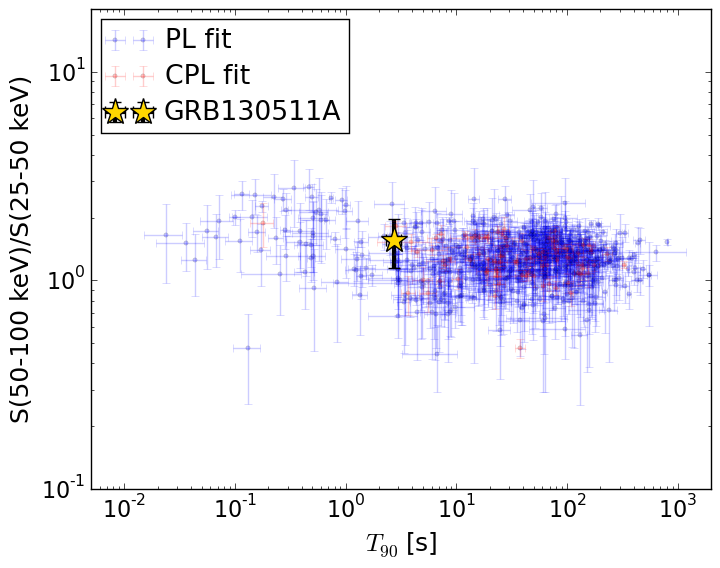
T90                                   = 2.74 sec.
Hardness ratio (energy fluence ratio) = 1.55933724951
S(15-50 keV) vs. S(50-150 keV) plot
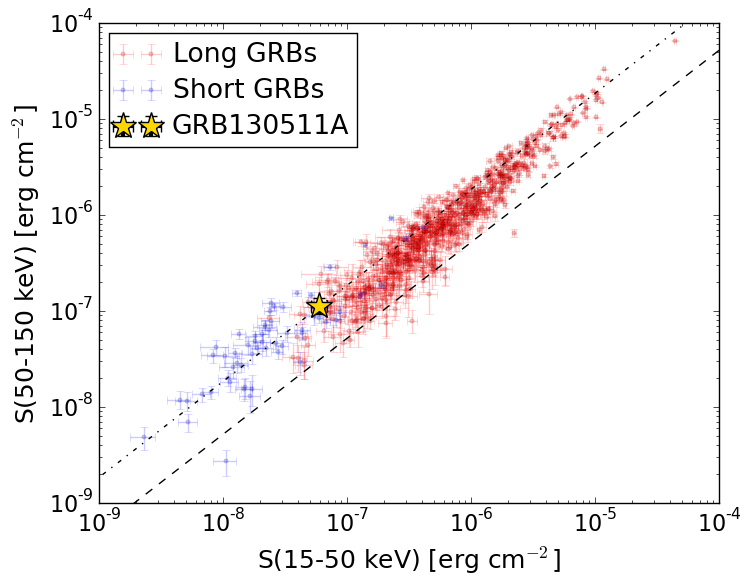
S(15-50 keV)  = 5.985375e-08
S(50-150 keV) = 1.1375621e-07
The dash-dotted line and the dashed line traces the fluences calculated from the Band function with Epeak = 15 and 150 keV, respectively. Both lines assume a canonical values of alpha = -1 and beta = -2.5.
Mask shadow pattern
IMX = 1.871003769884335E-01, IMY = -3.898075904469647E-01
Spacecraft aspect plot
Bright source in the pre-burst/pre-slew/post-slew images
Pre-burst image of 15-350 keV band
Time interval of the image:
-239.984000 -0.072000

# RAcent  DECcent POSerr Theta    Phi  PeakCts   SNR AngSep     Name
#  [deg]    [deg]    ['] [deg]  [deg]                   [']
162.0579 -21.7845    2.5  50.7  150.0   5.3870   4.6 ------	UNKNOWN
204.0058  17.0584    2.8  30.4   60.7   1.2889   4.1 ------	UNKNOWN
161.5089  -3.9707    2.3  33.6  158.0   1.6129   5.0 ------	UNKNOWN
153.4806 -10.6746    3.2  42.9  165.8   1.5773   3.6 ------	UNKNOWN
125.8726  -9.8181    3.5  59.1 -165.9   4.4855   3.3 ------	UNKNOWN
122.6051  -5.1641    4.2  58.8 -159.3   3.8369   2.8 ------	UNKNOWN
148.1494  72.8606    3.2  47.1  -53.1   3.3602   3.6 ------	UNKNOWN
Pre-slew background subtracted image of 15-350 keV band
Time interval of the image:
-0.072000 2.832000

# RAcent  DECcent POSerr Theta    Phi  PeakCts   SNR AngSep     Name
#  [deg]    [deg]    ['] [deg]  [deg]                   [']
161.4060 -13.9518    2.2  43.2  153.4   0.2407   5.2 ------	UNKNOWN
196.6479  18.6928    1.0  23.4   64.4   0.3040  11.8 ------	UNKNOWN
130.3118  11.3172    2.3  43.3 -146.9   0.1820   5.1 ------	UNKNOWN
Post-slew image of 15-350 keV band
Time interval of the image:
55.916600 962.097900

# RAcent  DECcent POSerr Theta    Phi  PeakCts   SNR AngSep     Name
#  [deg]    [deg]    ['] [deg]  [deg]                   [']
254.3700  35.2140    6.2  53.3   12.1  -4.2776  -1.9    8.8	Her X-1
243.4681   9.3929    2.4  46.3   47.4  10.9697   4.7 ------	UNKNOWN
202.7544 -18.1355    3.6  37.3  122.9   4.3798   3.2 ------	UNKNOWN
225.3338  17.6286    2.8  27.3   40.2   2.5779   4.2 ------	UNKNOWN
249.6084  37.0926    2.6  49.6    9.3   5.7770   4.5 ------	UNKNOWN
211.0683  19.3219    3.0  13.7   37.6   2.1381   3.9 ------	UNKNOWN
178.3899   5.5220    4.2  22.1 -171.8   1.5573   3.1 ------	UNKNOWN
178.3471   5.9414    4.9  21.9 -170.8   1.4822   2.9 ------	UNKNOWN
247.9127  61.2625    3.8  55.5  -20.4   5.8632   3.0 ------	UNKNOWN
143.3998  -7.6270    4.2  58.7 -159.2  11.8164   2.8 ------	UNKNOWN
143.2311  -5.2797    3.4  57.8 -156.6  12.5278   3.3 ------	UNKNOWN
186.8210  65.4180    3.7  47.2  -53.0   8.9810   3.1 ------	UNKNOWN