Analysis Summary
Notes:
- 1) No attempt has been made to eliminate the non-significant decimal places.
- 2) This batgrbproduct analysis is done using the HEASARC data.
- 3) This batgrbproduct analysis is using the flight position for the mask-weighting calculation.
======================================================================
BAT GRB EVENT DATA PROCESSING REPORT
Process Script Ver: batgrbproduct v2.46
Process Start Time: Sun Jan 12 03:12:19 EST 2014
Host Name: batevent1
Current Working Dir: /local/data/batevent/batevent_reproc/trigger555880
======================================================================
Trigger: 00555880 Segment: 000
BAT Trigger Time: 390273688.396 [s; MET]
Trigger Stop: 390273688.46 [s; MET]
UTC: 2013-05-15T01:21:17.839880 [includes UTCF correction]
Where From?: (*SHORT BURST*) TDRSS scaled map message
BAT
RA: 283.421862578053 Dec: -54.2810228525545 [deg; J2000]
Catalogged Source?: NO
Point Source?: YES
GRB Indicated?: YES [ by BAT flight software ]
Image S/N Ratio: 7.13
Image Trigger?: NO
Rate S/N Ratio: 60.390396587537 [ if not an image trigger ]
Image S/N Ratio: 7.13
Analysis Position: [ source = BAT ]
RA: 283.421862578053 Dec: -54.2810228525545 [deg; J2000]
Refined Position: [ source = BAT pre-slew burst ]
RA: 283.436108777723 Dec: -54.2823007474519 [deg; J2000]
{ 18h 53m 44.7s , -54d 16' 56.3" }
+/- 1.58171427143075 [arcmin] (estimated 90% radius based on SNR)
+/- 0.676250945416898 [arcmin] (formal 1-sigma fit error)
SNR: 15.7997334837692
Angular difference between the analysis and refined position is 0.504873 arcmin
Partial Coding Fraction: 0.6953125 [ including projection effects ]
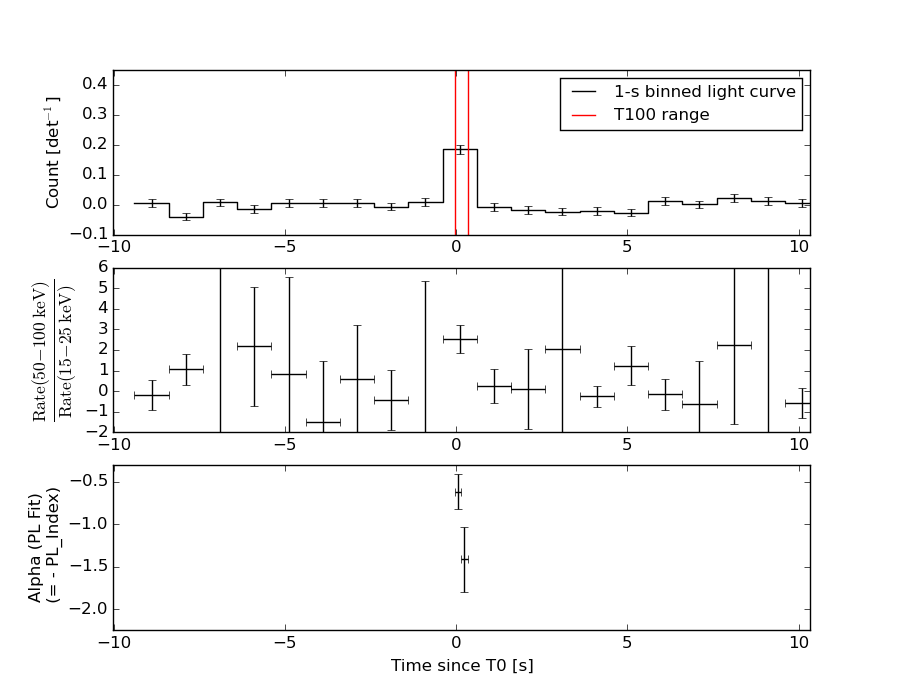
Duration
T90: 0.295999944210052 +/- 0.0609261752673085
Measured from: -0.0160000324249268
to: 0.279999911785126 [s; relative to TRIGTIME]
T50: 0.151999950408936 +/- 0.0526117745496101
Measured from: 0.0199999809265137
to: 0.171999931335449 [s; relative to TRIGTIME]
Fluence
Peak Flux (peak 1 second)
Measured from: -0.350000023841858
to: 0.649999976158142 [s; relative to TRIGTIME]
Total Fluence
Measured from: -0.0360000133514404
to: 0.331999957561493 [s; relative to TRIGTIME]
Band 1 Band 2 Band 3 Band 4
15-25 25-50 50-100 100-350 keV
Total 0.029868 0.053789 0.083314 0.024511
0.005169 0.006484 0.006710 0.005640 [error]
Peak 0.027870 0.056204 0.080536 0.022308
0.007449 0.008580 0.008336 0.007198 [error]
[ fluence units of on-axis counts / fully illuminated detector ]
======================================================================
====== Table of the duration information =============================
Value tstart tstop
T100 0.368 -0.036 0.332
T90 0.296 -0.016 0.280
T50 0.152 0.020 0.172
Peak 1.000 -0.350 0.650
====== Spectral Analysis Summary =====================================
Model : spectral model: simple power-law (PL) and cutoff power-law (CPL)
Ph_index : photon index: E^{Ph_index}
Ph_90err : 90% error of the photon index
Epeak : Epeak in keV
Epeak_90err: 90% error of Epeak
Norm : normalization at 50 keV in both the PL model and CPL model
Nomr_90err : 90% error of the normalization
chi2 : Chi-Squared
dof : degree of freedo
=== Time-averaged spectral analysis ===
(Best model with acceptable fit: N/A)
Model Ph_index Ph_90err_low Ph_90err_hi Epeak Epeak_90err_low Epeak_90err_hi Norm Nomr_90err_low Norm_90err_hi chi2 dof
PL -0.770 -0.181 0.186 - - - 3.45e-02 -3.67e-03 3.64e-03 60.980 57
CPL -0.330 -0.562 0.904 233.597 -233.597 -233.597 5.25e-02 N/A N/A 60.000 56
=== 1-s peak spectral analysis ===
(Best model with acceptable fit: PL)
Model Ph_index Ph_90err_low Ph_90err_hi Epeak Epeak_90err_low Epeak_90err_hi Norm Nomr_90err_low Norm_90err_hi chi2 dof
PL -0.891 -0.233 0.242 - - - 1.25e-02 -1.74e-03 1.73e-03 58.370 57
CPL 0.189 -1.081 1.630 122.446 -38.956 -122.446 3.51e-02 -3.51e-02 1.09e-01 55.730 56
=== Fluence/Peak Flux Summary ===
Model Band1 Band2 Band3 Band4 Band5 Total
15-25 25-50 50-100 100-350 15-150 15-350 keV
Fluence PL 8.22e-09 2.37e-08 5.57e-08 3.56e-07 1.50e-07 4.44e-07 erg/cm2
90%_error_low -1.75e-09 -3.14e-09 -6.21e-09 -8.48e-08 -1.70e-08 -8.85e-08 erg/cm2
90%_error_hi 1.89e-09 3.09e-09 6.15e-09 1.03e-07 1.71e-08 1.05e-07 erg/cm2
Peak flux PL 2.87e-01 4.16e-01 4.49e-01 9.03e-01 1.43e+00 2.06e+00 ph/cm2/s
90%_error_low -7.80e-02 -7.36e-02 -6.53e-02 -2.55e-01 -1.99e-01 -3.11e-01 ph/cm2/s
90%_error_hi 8.67e-02 7.25e-02 6.47e-02 3.14e-01 1.99e-01 3.30e-01 ph/cm2/s
Fluence CPL 1.31e-09 1.37e-09 1.14e-09 2.84e-09 7.32e-09 1.26e-08 erg/cm2
90%_error_low N/A N/A N/A N/A N/A N/A erg/cm2
90%_error_hi N/A N/A N/A N/A N/A N/A erg/cm2
Peak flux CPL 2.06e-01 4.25e-01 5.06e-01 3.99e-01 1.37e+00 1.54e+00 ph/cm2/s
90%_error_low -1.05e-01 -8.61e-02 -8.82e-02 -2.12e-01 -2.16e-01 -3.22e-01 ph/cm2/s
90%_error_hi 1.18e-01 8.30e-02 9.28e-02 5.41e-01 2.12e-01 5.37e-01 ph/cm2/s
======================================================================
Image
Pre-slew 15.0-350.0 keV image (Event data)
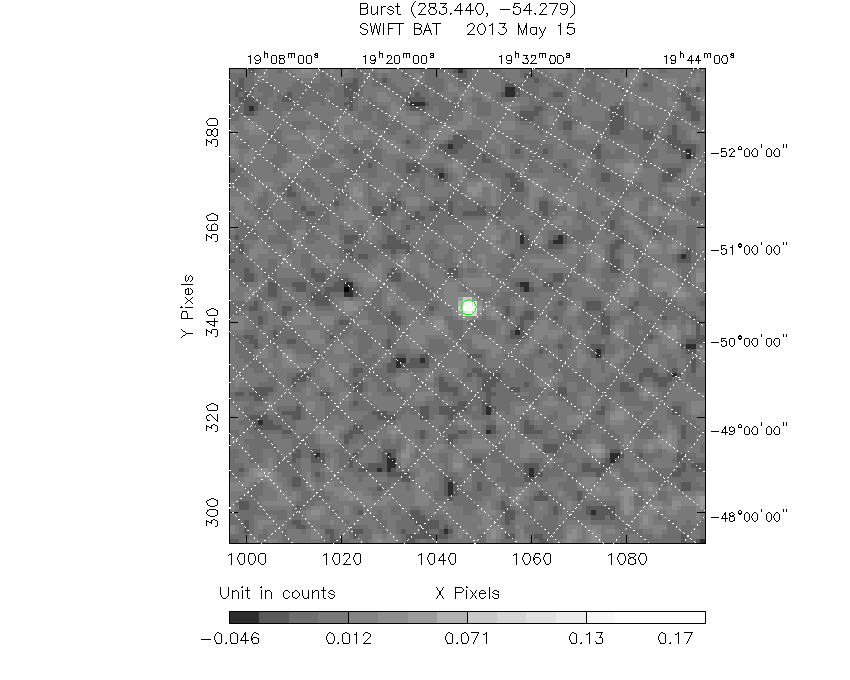
#   RAcent    DECcent   POSerr    Theta     Phi              Peak Cts       SNR   Name
  283.4361   -54.2823   0.0121    24.1920   141.3940         0.1966767     15.800 TRIG_00555880

Foreground time interval of the image:
 -0.036   0.332 (delta_t =   0.368 [sec])
Background time interval of the image:
-147.895  -0.036 (delta_t = 147.859 [sec])
Light Curves
Note: The mask-weighted lightcurves have units of either count/det or counts/sec/det, where a det is 0.4 x 0.4 = 0.16 sq cm.
Full-time range; 1 s binning
Other quick-look light curves:
- 64 ms binning (zoomed)
- 16 ms binning (zoomed)
- 8 ms binning (zoomed)
- 2 ms binning (zoomed)
- SN=5 or 10 s binning (full-time range)
- Raw light curve
Spectra
- 64 ms binning (zoomed)
- 16 ms binning (zoomed)
- 8 ms binning (zoomed)
- 2 ms binning (zoomed)
- SN=5 or 10 s binning (full-time range)
- Raw light curve
Spectra
Notes:
- 1) The fitting includes the systematic errors.
- 2) When the burst includes telescope slew time periods, the fitting uses an average response file made from multiple 5-s response files through out the slew time plus single time preiod for the non-slew times, and weighted by the total counts in the corresponding time period using addrmf. An average response file is needed becuase a spectral fit using the pre-slew DRM will introduce some errors in both a spectral shape and a normalization if the PHA file contains a lot of the slew/post-slew time interval.
- 3) For fits to more complicated models (e.g. a power-law over a cutoff power-law), the BAT team has decided to require a chi-square improvement of more than 6 for each extra dof.
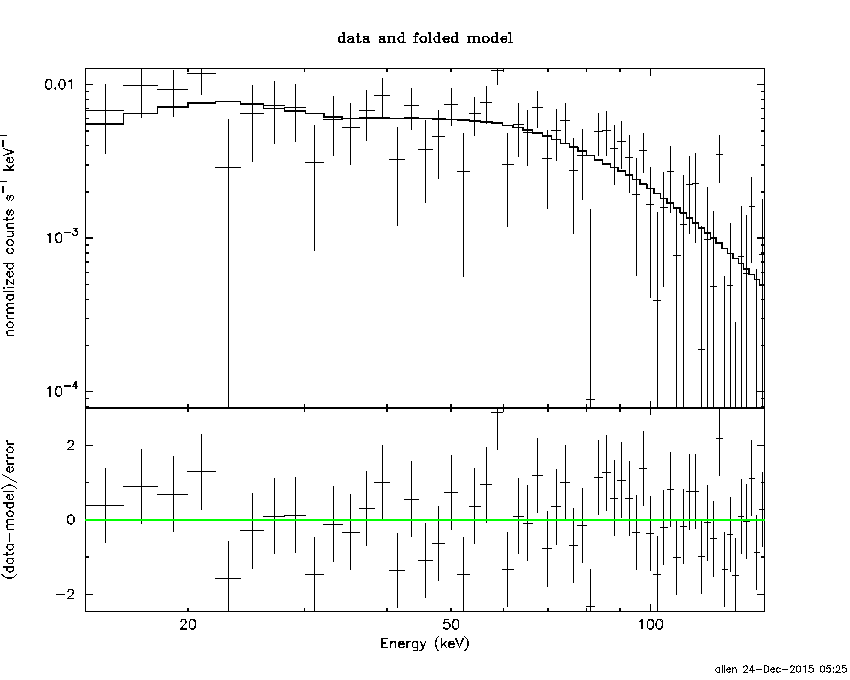
Time averaged spectrum fit using the average DRM
Power-law model

Time interval is from   -0.036 sec. to    0.332 sec.

Spectral model in power-law:
------------------------------------------------------------
Parameters  : value       lower 90%   higher 90%
Photon index: -0.769505     ( -0.180604   0.186431 )
Norm@50keV  : 3.45164E-02    ( -0.00366744   0.00363866 )
------------------------------------------------------------
#Fit statistic : Chi-Squared =          60.98 using 59 PHA bins.
# Reduced chi-squared =          1.070 for     57 degrees of freedom
# Null hypothesis probability =   3.347632e-01

Photon flux (15-150 keV)    in 0.368 sec: 0.262258 0.199025 0.151302 3.63373E-02 (    ) ph/cm2/s
Energy fluence (15-150 keV)             : 1.50389e-07 ( -1.70318e-08  1.71194e-08 ) ergs/cm2
Cutoff power-law model
Time interval is from   -0.036 sec. to    0.332 sec.
Spectral model in the cutoff power-law:
------------------------------------------------------------
Parameters  : value       lower 90%   higher 90%
Photon index: -0.330154     ( -0.561922   0.90365 )
Epeak [keV] : 233.597      ( -233.588 -233.588 )
Norm@50keV  : 5.24771E-02    (     )
------------------------------------------------------------
#Fit statistic : Chi-Squared =          60.00 using 59 PHA bins.
# Reduced chi-squared =          1.071 for     56 degrees of freedom
# Null hypothesis probability =   3.329590e-01

Photon flux (15-150 keV)    in 0.368 sec: 3.91074 ( -0.42808  0.42593 ) ph/cm2/s
Energy fluence (15-150 keV)             : 7.31639e-09 ( 0  0 ) ergs/cm2
1-s peak spectrum fit
Power-law model
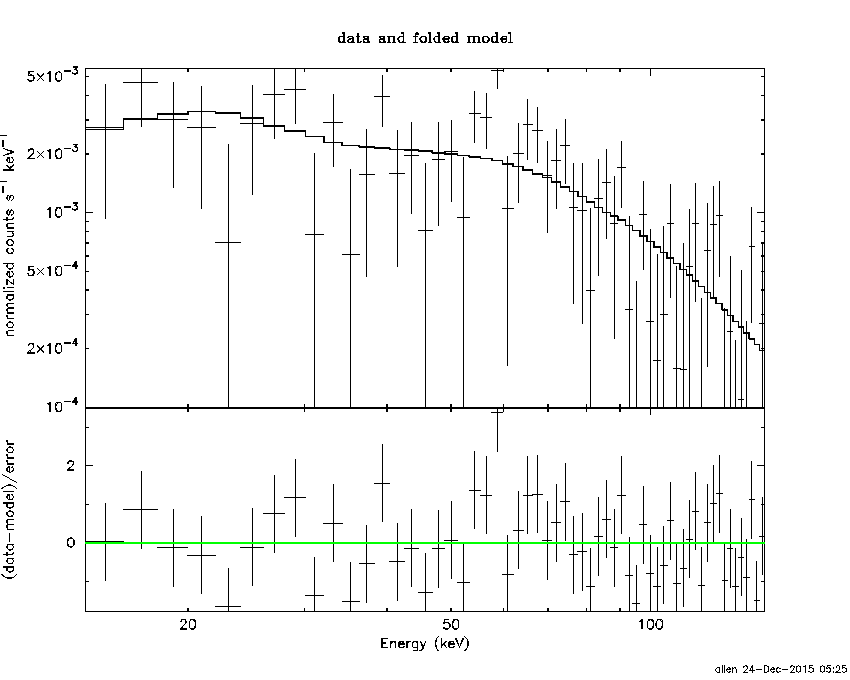
Time interval is from   -0.350 sec. to    0.650 sec.

Spectral model in power-law:
------------------------------------------------------------
Parameters  : value       lower 90%   higher 90%
Photon index: -0.890949     ( -0.232596   0.241533 )
Norm@50keV  : 1.24751E-02    ( -0.00173902   0.0017273 )
------------------------------------------------------------
#Fit statistic : Chi-Squared =          58.37 using 59 PHA bins.
# Reduced chi-squared =          1.024 for     57 degrees of freedom
# Null hypothesis probability =   4.247819e-01

Photon flux (15-150 keV)    in 1 sec: 1.43177 ( -0.19881  0.19936 ) ph/cm2/s
Energy fluence (15-150 keV)             : 1.40514e-07 ( -2.07269e-08  2.0881e-08 ) ergs/cm2
Cutoff power-law model

Time interval is from   -0.350 sec. to    0.650 sec.
Spectral model in the cutoff power-law:
------------------------------------------------------------
Parameters  : value       lower 90%   higher 90%
Photon index: 0.189485     ( -1.08129   1.62921 )
Epeak [keV] : 122.446      ( -38.9131 -122.403 )
Norm@50keV  : 3.51174E-02    ( -0.0351454   0.109364 )
------------------------------------------------------------
#Fit statistic : Chi-Squared =          55.73 using 59 PHA bins.
# Reduced chi-squared =         0.9952 for     56 degrees of freedom
# Null hypothesis probability =   4.850958e-01

Photon flux (15-150 keV)    in 1 sec: 1.36703 ( -0.21571  0.2124 ) ph/cm2/s
Energy fluence (15-150 keV)             : 1.3467e-07 ( -2.23648e-08  2.22181e-08 ) ergs/cm2
Time-resolved spectra
Distribution
T90 vs. Hardness ratio plot
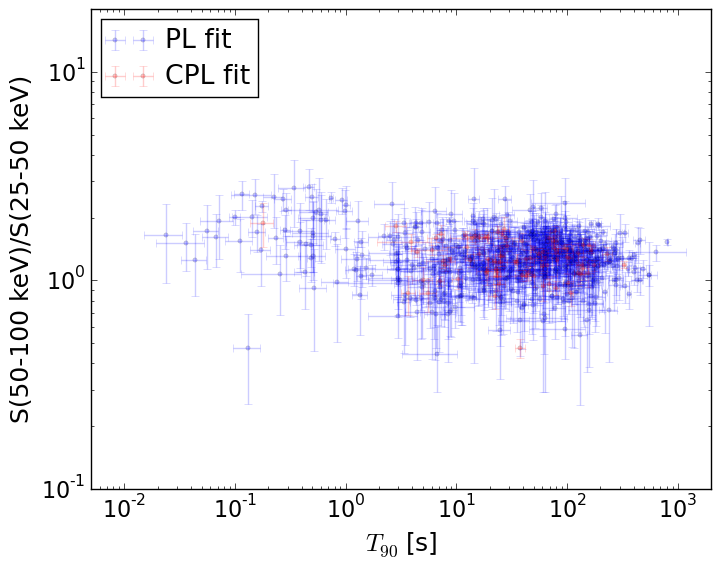
T90                                   = N/A sec.
Hardness ratio (energy fluence ratio) = N/A
S(15-50 keV) vs. S(50-150 keV) plot
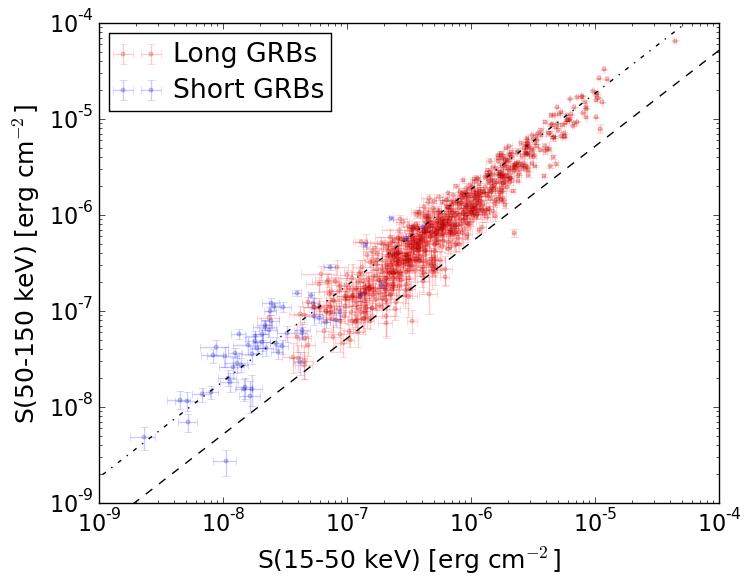
S(15-50 keV)  = N/A
S(50-150 keV) = N/A
The dash-dotted line and the dashed line traces the fluences calculated from the Band function with Epeak = 15 and 150 keV, respectively. Both lines assume a canonical values of alpha = -1 and beta = -2.5.
Mask shadow pattern
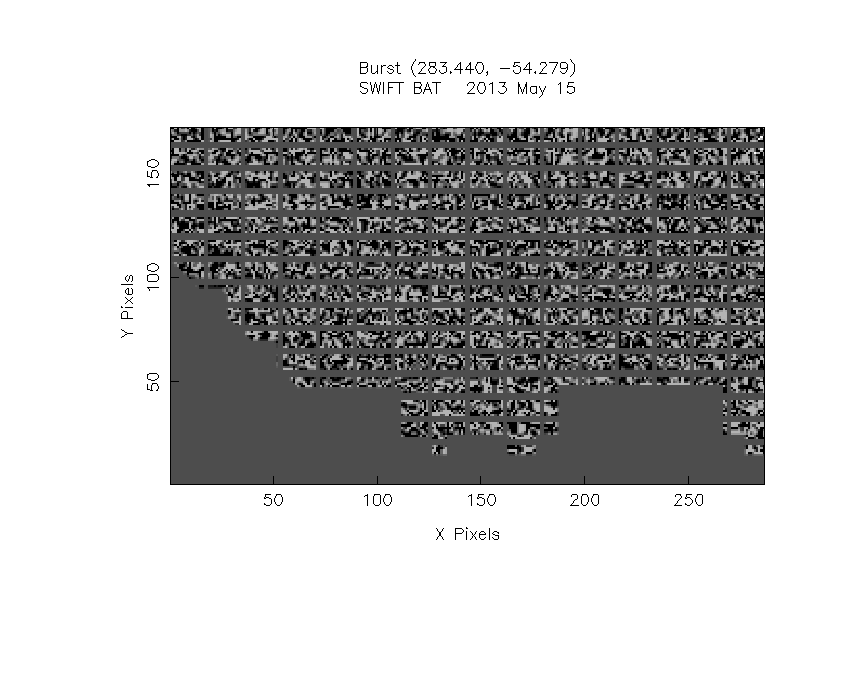
IMX = -3.510695361386565E-01, IMY = -2.803151470316865E-01
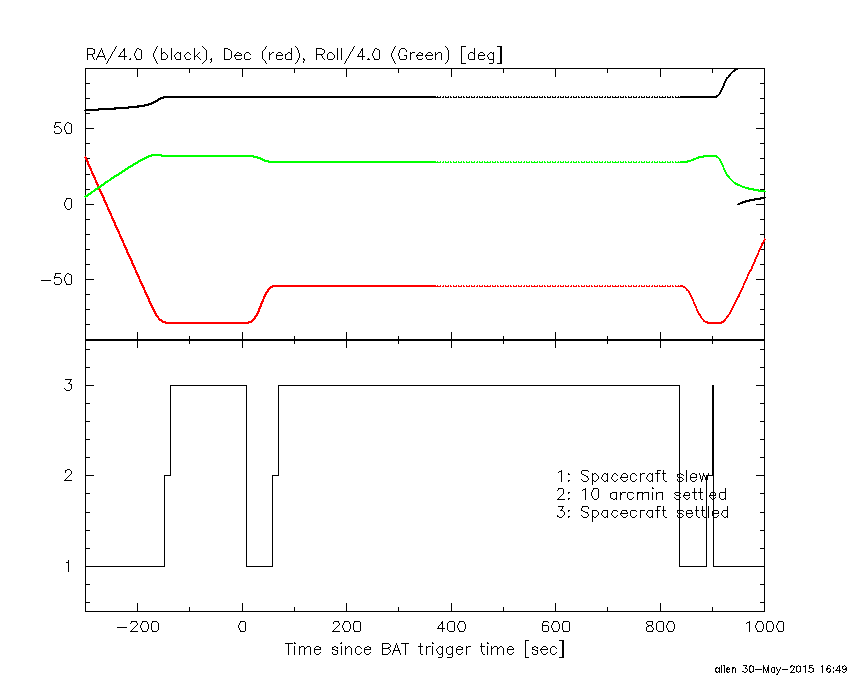
Spacecraft aspect plot
Bright source in the pre-burst/pre-slew/post-slew images
Pre-burst image of 15-350 keV band
Time interval of the image:
-147.895410 -0.036000

# RAcent  DECcent POSerr Theta    Phi  PeakCts   SNR AngSep     Name
#  [deg]    [deg]    ['] [deg]  [deg]                   [']
170.2245 -60.6206    4.2  35.5   13.0   0.5910   2.8    2.7	Cen X-3
187.1008 -62.7699  105.7  30.7   25.3   0.0223   0.1   12.2	GX 301-2
264.7253 -44.2902   74.2  35.0  117.9   0.0568   0.2    9.6	4U 1735-44
232.6834 -44.7627    2.4  38.9   80.2   2.8965   4.8 ------	UNKNOWN
166.2416 -66.7983    2.3  30.3    6.2   0.8911   5.0 ------	UNKNOWN
315.5066 -58.7336    2.6  22.2 -171.9   0.6599   4.4 ------	UNKNOWN
338.8428 -72.5978    2.1  14.2 -122.5   0.7934   5.4 ------	UNKNOWN
337.3728 -24.7549    3.5  58.7 -159.2   3.5815   3.3 ------	UNKNOWN
119.6331 -42.0796    2.3  59.1  -24.2   5.8691   4.9 ------	UNKNOWN
 98.4815 -49.3963    3.0  52.1  -42.2   3.5108   3.8 ------	UNKNOWN
357.3110 -36.4895    2.5  51.0 -135.6   4.0220   4.6 ------	UNKNOWN
Pre-slew background subtracted image of 15-350 keV band
Time interval of the image:
-0.036000 0.332000

# RAcent  DECcent POSerr Theta    Phi  PeakCts   SNR AngSep     Name
#  [deg]    [deg]    ['] [deg]  [deg]                   [']
170.0834 -60.6190    5.7  35.5   12.9  -0.0285  -2.0    6.8	Cen X-3
186.8417 -62.6680    3.8  30.8   25.2   0.0415   3.0    8.0	GX 301-2
264.9090 -44.4620    6.3  34.8  118.1  -0.0433  -1.8    7.1	4U 1735-44
238.0437 -43.7620    1.8  39.0   86.5   0.2745   6.3 ------	UNKNOWN
283.4361 -54.2823    0.7  24.2  141.4   0.1967  15.8 ------	UNKNOWN
237.6035 -79.4410    2.7   8.7   23.8   0.0395   4.2 ------	UNKNOWN
  8.3272 -70.8473    2.5  21.2 -102.0   0.0521   4.7 ------	UNKNOWN
Post-slew image of 15-350 keV band
Time interval of the image:
58.904590 836.504620

# RAcent  DECcent POSerr Theta    Phi  PeakCts   SNR AngSep     Name
#  [deg]    [deg]    ['] [deg]  [deg]                   [']
170.5294 -60.6066    6.4  53.4   13.0   4.7473   1.8    6.4	Cen X-3
186.6576 -62.8815    4.9  46.3   17.6   3.4227   2.3    6.7	GX 301-2
255.9598 -37.8425    0.8  24.9   98.8  13.5304  14.3    1.3	4U 1700-377
256.4871 -36.6004    4.4  25.6  101.4  -2.7227  -2.6   10.9	GX 349+2
263.0018 -24.7288   81.3  33.2  123.4   0.1856   0.1    1.1	GX 1+4
264.8364 -44.4072    6.7  15.6  100.6   1.1786   1.7    4.8	4U 1735-44
270.3372 -25.2573    0.0  30.6  135.0   2.2305   2.2   11.1	GX 5-1
270.4024 -25.7804    5.3  30.1  134.9   2.2066   2.2    5.8	GRS 1758-258
273.8748 -14.0202    3.9  41.0  144.5   5.8329   3.0    7.7	GX 17+2
275.9858 -30.4683    2.7  24.4  143.1   3.2102   4.2    6.8	H1820-303
284.9477 -24.7683    5.6  29.6  161.6   1.7677   2.0   10.3	HT1900.1-2455
262.9936 -33.8316   53.8  25.0  115.4   0.1885   0.2    0.3	GX 354-0
250.3512 -53.9766    4.0  19.2   56.2   1.9760   2.9 ------	UNKNOWN
261.2157 -75.3598    4.2  22.7   -6.9   1.8803   2.8 ------	UNKNOWN
316.8314  -1.3767    4.5  59.6 -161.6  17.5692   2.6 ------	UNKNOWN
318.3351  -2.8770    4.3  58.7 -159.3  15.5179   2.7 ------	UNKNOWN
 28.8530 -66.4081    3.6  47.0  -53.1  13.5089   3.2 ------	UNKNOWN
333.8151 -23.2566    3.4  48.5 -130.3  12.7065   3.4 ------	UNKNOWN
339.3170 -33.4424    3.4  43.9 -116.1  13.4095   3.4 ------	UNKNOWN
347.1049 -44.1975    5.6  41.3  -98.2  10.1865   2.1 ------	UNKNOWN