Analysis Summary
Notes:
- 1) No attempt has been made to eliminate the non-significant decimal places.
- 2) This batgrbproduct analysis is done using the HEASARC data.
- 3) This batgrbproduct analysis is using the flight position for the mask-weighting calculation.
FLUX-mask-weighted light curve (pcodethresh=0.05; aperture=CALDB:FLUX)
==========================================================================
BAT GROUND-DETECTED GRB DATA PROCESSING REPORT
Process Script Ver: batgrbproduct v2.46
Process Start Time: Thu Dec 17 15:00:42 EST 2015
Host Name: bat1
Current Working Dir: /local/data/bat1/alien/Swift_3rdBATcatalog/event/batevent_reproc/trigger556113
======================================================================
Trigger: 00556113 Segment: 000
BAT Trigger Time: 390578083.2
UTC: 2013-05-18T13:54:32.630 [includes UTCF correction]
Where From?: Ground analysis (best_duration.txt)
NOTE: BAT trigger time for ground-detected burst is the T100 start time.
Analysis Position: [ source = GCN ]
RA: 355.671 Dec: +47.478 [deg; J2000]
Refined Position: [ source = BAT pre-slew image ]
RA: 355.662099456 Dec: 47.4697202303 [deg; J2000]
{ 23h 42m 38.9s , +47d 28' 11.0" }
+/- 2.28750094054 [arcmin] (estimated 90% radius based on SNR)
SNR: 9.32828784329
Angular difference between the analysis and refined position is 0.614079 arcmin
Partial Coding Fraction: 0.04101562 [ including projection effects ]
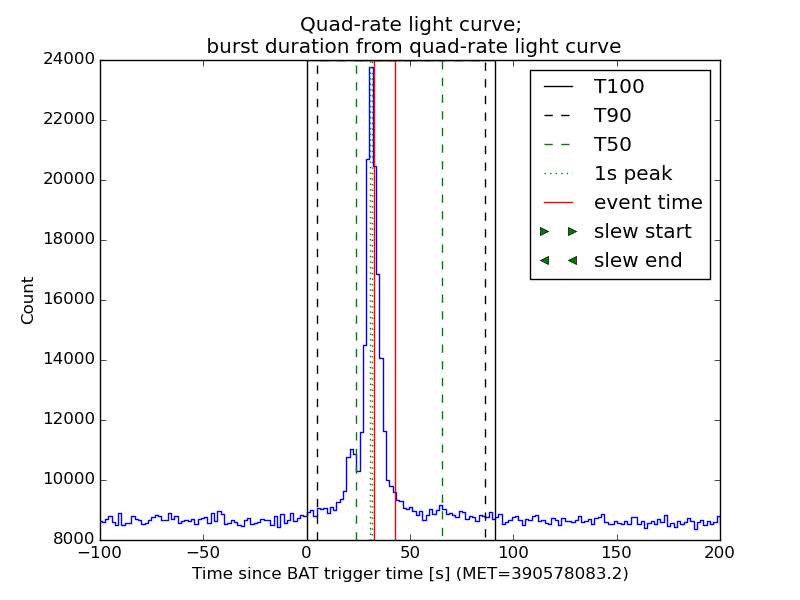
Duration
T90: 81.6000000238419 +/- 1.6
Measured from: 4.8
to: 86.4 [s; relative to TRIGTIME]
T50: 41.6000000238419 +/- 1.6
Measured from: 24
to: 65.6 [s; relative to TRIGTIME]
====== Table of the duration information =============================
Value tstart tstop
T100 91.200 0.000 91.200
T90 81.600 4.800 86.400
T50 41.600 24.000 65.600
Peak 1.000 30.700 31.700
====== Spectral Analysis Summary =====================================
Model : spectral model: simple power-law (PL) and cutoff power-law (CPL)
Ph_index : photon index: E^{Ph_index}
Ph_90err : 90% error of the photon index
Epeak : Epeak in keV
Epeak_90err: 90% error of Epeak
Norm : normalization at 50 keV in both the PL model and CPL model
Nomr_90err : 90% error of the normalization
chi2 : Chi-Squared
dof : degree of freedo
=== Time-averaged spectral analysis ===
(Best model with acceptable fit: N/A)
Model Ph_index Ph_90err_low Ph_90err_hi Epeak Epeak_90err_low Epeak_90err_hi Norm Nomr_90err_low Norm_90err_hi chi2 dof
PL N/A N/A N/A - - - N/A N/A N/A N/A N/A
CPL N/A N/A N/A N/A N/A N/A N/A N/A N/A N/A N/A
=== 1-s peak spectral analysis ===
(Best model with acceptable fit: N/A)
Model Ph_index Ph_90err_low Ph_90err_hi Epeak Epeak_90err_low Epeak_90err_hi Norm Nomr_90err_low Norm_90err_hi chi2 dof
PL N/A N/A N/A - - - N/A N/A N/A N/A N/A
CPL N/A N/A N/A N/A N/A N/A N/A N/A N/A N/A N/A
=== Fluence/Peak Flux Summary ===
Model Band1 Band2 Band3 Band4 Band5 Total
15-25 25-50 50-100 100-350 15-150 15-350 keV
Fluence PL N/A N/A N/A N/A N/A N/A erg/cm2
Image
15.0-350.0 keV image (Event data with DETECTION mask)
#RAcent DECcent POSerr Theta  Phi  Peak_Cts  SNR Name
355.662 47.470 0.021 43.654 -100.437 2.857 9.328 TRIG_00556113

Image time interval: 34.770 to 42.877 [sec]
Light Curves
Note: The mask-weighted lightcurves have units of either count/det or counts/sec/det, where a det is 0.4 x 0.4 = 0.16 sq cm.
Best duration plot
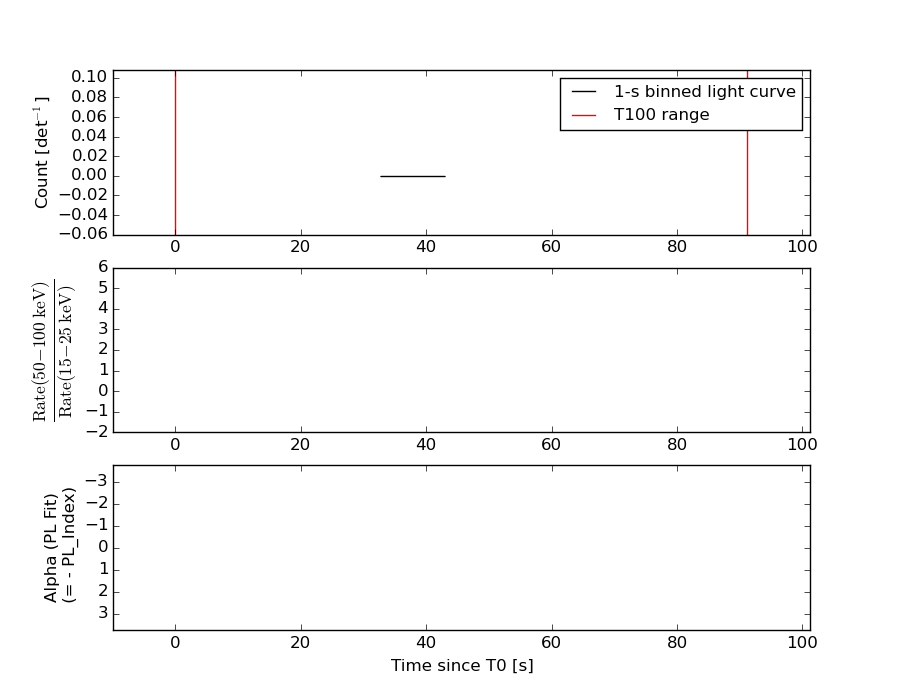
Full-time range; 1 s binning
Other quick-look light curves:
Spectra
Notes:
- 1) The fitting includes the systematic errors.
- 2) When the burst includes telescope slew time periods, the fitting uses an average response file made from multiple 5-s response files through out the slew time plus single time preiod for the non-slew times, and weighted by the total counts in the corresponding time period using addrmf. An average response file is needed becuase a spectral fit using the pre-slew DRM will introduce some errors in both a spectral shape and a normalization if the PHA file contains a lot of the slew/post-slew time interval.
- 3) For fits to more complicated models (e.g. a power-law over a cutoff power-law), the BAT team has decided to require a chi-square improvement of more than 6 for each extra dof.
Time averaged spectrum fit using the average DRM
Power-law model

Multiple GTIs in the spectrum
tstart tstop
Photon index:       (       )
Cutoff power-law model

Multiple GTIs in the spectrum
tstart tstop
Photon index:       (       )
1-s peak spectrum fit
Power-law model

Time interval is from   34.770 sec. to   42.877 sec.
Photon index:       (       )
Cutoff power-law model

Time interval is from   34.770 sec. to   42.877 sec.
Photon index:       (       )
Time-resolved spectra
Distribution
T90 vs. Hardness ratio plot
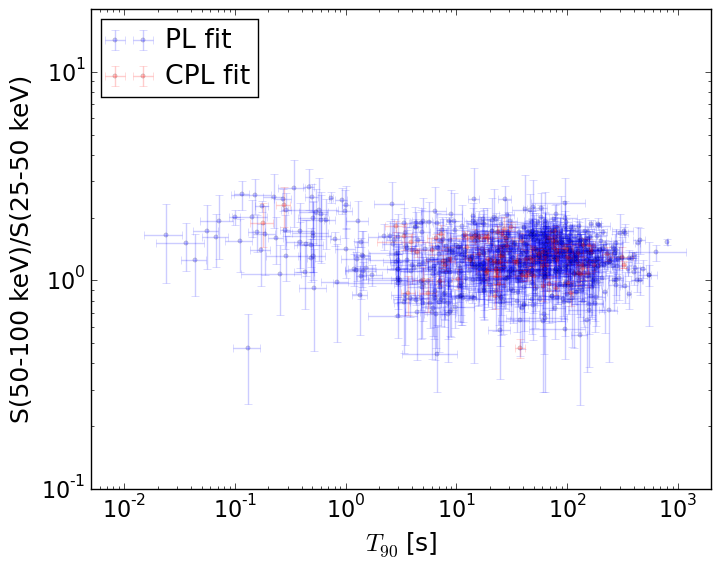
T90                                   = N/A sec.
Hardness ratio (energy fluence ratio) = N/A
S(15-50 keV) vs. S(50-150 keV) plot
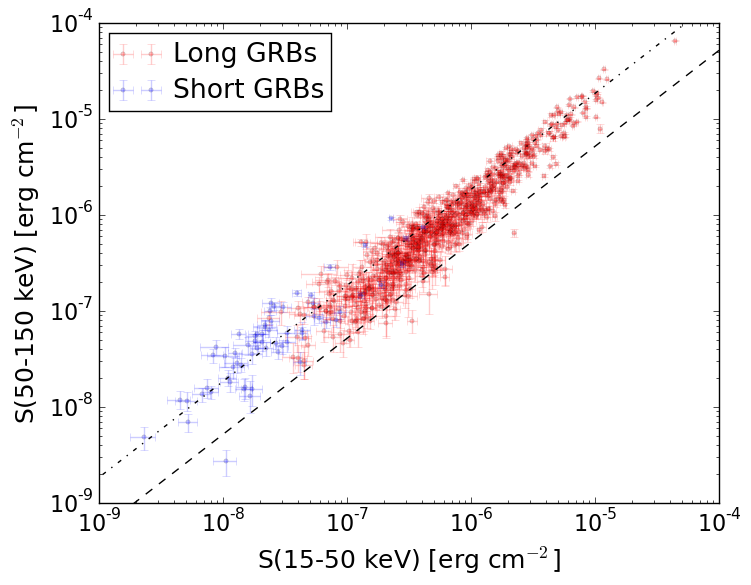
S(15-50 keV)  = N/A
S(50-150 keV) = N/A
The dash-dotted line and the dashed line traces the fluences calculated from the Band function with Epeak = 15 and 150 keV, respectively. Both lines assume a canonical values of alpha = -1 and beta = -2.5.
Mask shadow pattern (with DETECTION mask)
IMX = -0.172833007684, IMY = 0.93830197837
Spacecraft aspect plot
Bright source in the event data image
Event data image of 15-350 keV band
Time interval of the image:
34.770000 42.877200

# RAcent  DECcent POSerr Theta    Phi  PeakCts   SNR AngSep     Name
#  [deg]    [deg]    ['] [deg]  [deg]                   [']
254.2671  35.3153   28.8  46.0  147.7   0.0436   0.4    9.5	Her X-1
289.0069  10.9294    0.0  22.7   85.0   0.2223   4.9   12.3	GRS 1915+105
299.5585  35.2195   98.8  11.5  179.6   0.0042   0.1    1.9	Cyg X-1
308.1614  40.9868    6.7  15.3 -144.8   0.0635   1.7    3.1	Cyg X-3
326.2986  38.4713    5.6  20.5 -100.6  -0.0910  -2.1   10.8	Cyg X-2
339.0794 -24.1726    3.0  58.7   -2.0   1.2028   3.9 ------	UNKNOWN
355.6621  47.4697    1.3  43.7 -100.4   2.8568   8.9 ------	UNKNOWN
Webpage updated on:
Thu Dec 17 15:10:12 EST 2015