Analysis Summary
Notes:
- 1) No attempt has been made to eliminate the non-significant decimal places.
- 2) This batgrbproduct analysis is done using the HEASARC data.
- 3) This batgrbproduct analysis is using the flight position for the mask-weighting calculation.
======================================================================
BAT GRB EVENT DATA PROCESSING REPORT
Process Script Ver: batgrbproduct v2.46
Process Start Time: Sun Jan 12 03:07:39 EST 2014
Host Name: batevent1
Current Working Dir: /local/data/batevent/batevent_reproc/trigger556344
======================================================================
Trigger: 00556344 Segment: 000
BAT Trigger Time: 390869367.36 [s; MET]
Trigger Stop: 390869368.384 [s; MET]
UTC: 2013-05-21T22:49:16.777540 [includes UTCF correction]
Where From?: TDRSS position message
BAT
RA: 87.5593927071589 Dec: 14.4524334755583 [deg; J2000]
Catalogged Source?: NO
Point Source?: YES
GRB Indicated?: YES [ by BAT flight software ]
Image S/N Ratio: 12.11
Image Trigger?: NO
Rate S/N Ratio: 24.5153013442625 [ if not an image trigger ]
Image S/N Ratio: 12.11
Analysis Position: [ source = BAT ]
RA: 87.5593927071589 Dec: 14.4524334755583 [deg; J2000]
Refined Position: [ source = BAT pre-slew burst ]
RA: 87.5671644965006 Dec: 14.4708670445226 [deg; J2000]
{ 05h 50m 16.1s , +14d 28' 15.1" }
+/- 1.61520536666794 [arcmin] (estimated 90% radius based on SNR)
+/- 0.760141059001048 [arcmin] (formal 1-sigma fit error)
SNR: 15.3338131634135
Angular difference between the analysis and refined position is 1.194633 arcmin
Partial Coding Fraction: 0.671875 [ including projection effects ]
Duration
T90: 10.9559999704361 +/- 2.50452706799813
Measured from: -0.328000009059906
to: 10.6279999613762 [s; relative to TRIGTIME]
T50: 2.35999995470047 +/- 1.94983590135906
Measured from: 0.472000002861023
to: 2.83199995756149 [s; relative to TRIGTIME]
Fluence
Peak Flux (peak 1 second)
Measured from: -0.136000037193298
to: 0.863999962806702 [s; relative to TRIGTIME]
Total Fluence
Measured from: -0.643999993801117
to: 12.6399999856949 [s; relative to TRIGTIME]
Band 1 Band 2 Band 3 Band 4
15-25 25-50 50-100 100-350 keV
Total 0.345609 0.317768 0.155107 0.034583
0.027603 0.028142 0.023719 0.019499 [error]
Peak 0.090310 0.085501 0.041724 0.011170
0.008862 0.009196 0.007451 0.005254 [error]
[ fluence units of on-axis counts / fully illuminated detector ]
======================================================================
====== Table of the duration information =============================
Value tstart tstop
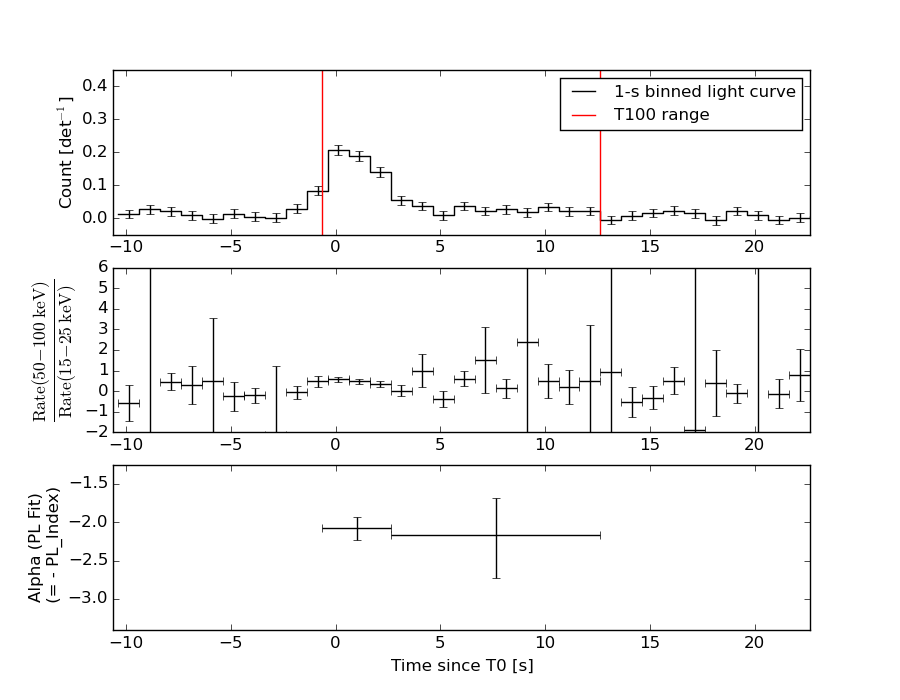
T100 13.284 -0.644 12.640
T90 10.956 -0.328 10.628
T50 2.360 0.472 2.832
Peak 1.000 -0.136 0.864
====== Spectral Analysis Summary =====================================
Model : spectral model: simple power-law (PL) and cutoff power-law (CPL)
Ph_index : photon index: E^{Ph_index}
Ph_90err : 90% error of the photon index
Epeak : Epeak in keV
Epeak_90err: 90% error of Epeak
Norm : normalization at 50 keV in both the PL model and CPL model
Nomr_90err : 90% error of the normalization
chi2 : Chi-Squared
dof : degree of freedo
=== Time-averaged spectral analysis ===
(Best model with acceptable fit: PL)
Model Ph_index Ph_90err_low Ph_90err_hi Epeak Epeak_90err_low Epeak_90err_hi Norm Nomr_90err_low Norm_90err_hi chi2 dof
PL -2.088 -0.198 0.188 - - - 3.45e-03 -4.58e-04 4.47e-04 50.700 57
CPL -1.862 -0.216 0.770 24.954 N/A N/A 4.68e-03 N/A N/A 50.370 56
=== 1-s peak spectral analysis ===
(Best model with acceptable fit: PL)
Model Ph_index Ph_90err_low Ph_90err_hi Epeak Epeak_90err_low Epeak_90err_hi Norm Nomr_90err_low Norm_90err_hi chi2 dof
PL -2.153 -0.228 0.210 - - - 1.19e-02 -1.90e-03 1.84e-03 48.660 57
CPL -1.636 -0.597 0.990 29.095 -25.429 -29.095 2.40e-02 N/A N/A 47.520 56
=== Fluence/Peak Flux Summary ===
Model Band1 Band2 Band3 Band4 Band5 Total
15-25 25-50 50-100 100-350 15-150 15-350 keV
Fluence PL 1.02e-07 1.31e-07 1.23e-07 2.05e-07 4.25e-07 5.61e-07 erg/cm2
90%_error_low -1.37e-08 -1.31e-08 -2.21e-08 -6.40e-08 -5.05e-08 -9.18e-08 erg/cm2
90%_error_hi 1.40e-08 1.31e-08 2.27e-08 8.12e-08 5.16e-08 1.05e-07 erg/cm2
Peak flux PL 9.24e-01 6.34e-01 2.85e-01 1.78e-01 1.93e+00 2.02e+00 ph/cm2/s
90%_error_low -1.42e-01 -7.40e-02 -5.82e-02 -6.00e-02 -2.21e-01 -2.33e-01 ph/cm2/s
90%_error_hi 1.45e-01 7.37e-02 5.92e-02 7.54e-02 2.21e-01 2.33e-01 ph/cm2/s
Fluence CPL N/A N/A N/A N/A N/A N/A erg/cm2
90%_error_low -1.37e-08 -1.31e-08 -2.21e-08 -6.40e-08 -5.05e-08 -9.18e-08 erg/cm2
90%_error_hi 1.40e-08 1.31e-08 2.27e-08 8.12e-08 5.16e-08 1.05e-07 erg/cm2
Peak flux CPL 8.85e-01 6.76e-01 2.84e-01 8.90e-02 1.91e+00 1.93e+00 ph/cm2/s
90%_error_low -1.59e-01 -9.48e-02 -6.62e-02 -8.90e-02 -2.24e-01 -2.38e-01 ph/cm2/s
90%_error_hi 1.57e-01 1.03e-01 6.42e-02 1.72e-01 2.24e-01 2.57e-01 ph/cm2/s
======================================================================
Image
Pre-slew 15.0-350.0 keV image (Event data)
#   RAcent    DECcent   POSerr    Theta     Phi              Peak Cts       SNR   Name
   87.5672    14.4709   0.0125    22.9651   -82.6553         0.8141038     15.334 TRIG_00556344

Foreground time interval of the image:
 -0.644  12.640 (delta_t =  13.284 [sec])
Background time interval of the image:
-210.659  -0.644 (delta_t = 210.015 [sec])
Light Curves
Note: The mask-weighted lightcurves have units of either count/det or counts/sec/det, where a det is 0.4 x 0.4 = 0.16 sq cm.
Full-time range; 1 s binning
Other quick-look light curves:
- 64 ms binning (zoomed)
- 16 ms binning (zoomed)
- 8 ms binning (zoomed)
- 2 ms binning (zoomed)
- SN=5 or 10 s binning (full-time range)
- Raw light curve
Spectra
- 64 ms binning (zoomed)
- 16 ms binning (zoomed)
- 8 ms binning (zoomed)
- 2 ms binning (zoomed)
- SN=5 or 10 s binning (full-time range)
- Raw light curve
Spectra
Notes:
- 1) The fitting includes the systematic errors.
- 2) When the burst includes telescope slew time periods, the fitting uses an average response file made from multiple 5-s response files through out the slew time plus single time preiod for the non-slew times, and weighted by the total counts in the corresponding time period using addrmf. An average response file is needed becuase a spectral fit using the pre-slew DRM will introduce some errors in both a spectral shape and a normalization if the PHA file contains a lot of the slew/post-slew time interval.
- 3) For fits to more complicated models (e.g. a power-law over a cutoff power-law), the BAT team has decided to require a chi-square improvement of more than 6 for each extra dof.
Time averaged spectrum fit using the average DRM
Power-law model
Time interval is from   -0.644 sec. to   12.640 sec.

Spectral model in power-law:
------------------------------------------------------------
Parameters  : value       lower 90%   higher 90%
Photon index: -2.08788     ( -0.198462   0.187755 )
Norm@50keV  : 3.44525E-03    ( -0.000457922   0.000447201 )
------------------------------------------------------------
#Fit statistic : Chi-Squared =          50.70 using 59 PHA bins.
# Reduced chi-squared =         0.8895 for     57 degrees of freedom
# Null hypothesis probability =   7.089609e-01

Photon flux (15-150 keV)    in 13.28 sec: 0.538853 ( -0.052789  0.052796 ) ph/cm2/s
Energy fluence (15-150 keV)             : 4.24686e-07 ( -5.05086e-08  5.15779e-08 ) ergs/cm2
Cutoff power-law model

Time interval is from   -0.644 sec. to   12.640 sec.
Spectral model in the cutoff power-law:
------------------------------------------------------------
Parameters  : value       lower 90%   higher 90%
Photon index: -1.86177     ( -0.216086   0.769823 )
Epeak [keV] : 24.9544      (   )
Norm@50keV  : 4.68165E-03    (     )
------------------------------------------------------------
#Fit statistic : Chi-Squared =          50.37 using 59 PHA bins.
# Reduced chi-squared =         0.8994 for     56 degrees of freedom
# Null hypothesis probability =   6.871255e-01

Photon flux (15-150 keV)    in 13.28 sec: 0.534402 ( -0.054324  0.053944 ) ph/cm2/s
Energy fluence (15-150 keV)             : 0 ( 0  0 ) ergs/cm2
1-s peak spectrum fit
Power-law model
Time interval is from   -0.136 sec. to    0.864 sec.

Spectral model in power-law:
------------------------------------------------------------
Parameters  : value       lower 90%   higher 90%
Photon index: -2.15322     ( -0.228189   0.210152 )
Norm@50keV  : 1.19360E-02    ( -0.00189673   0.00184138 )
------------------------------------------------------------
#Fit statistic : Chi-Squared =          48.66 using 59 PHA bins.
# Reduced chi-squared =         0.8537 for     57 degrees of freedom
# Null hypothesis probability =   7.762194e-01

Photon flux (15-150 keV)    in 1 sec: 1.92890 ( -0.2211  0.22112 ) ph/cm2/s
Energy fluence (15-150 keV)             : 1.11563e-07 ( -1.54549e-08  1.57492e-08 ) ergs/cm2
Cutoff power-law model
Time interval is from   -0.136 sec. to    0.864 sec.
Spectral model in the cutoff power-law:
------------------------------------------------------------
Parameters  : value       lower 90%   higher 90%
Photon index: -1.63596     ( -0.596757   0.990136 )
Epeak [keV] : 29.0950      ( -25.428 -29.0944 )
Norm@50keV  : 2.40163E-02    (     )
------------------------------------------------------------
#Fit statistic : Chi-Squared =          47.52 using 59 PHA bins.
# Reduced chi-squared =         0.8486 for     56 degrees of freedom
# Null hypothesis probability =   7.828199e-01

Photon flux (15-150 keV)    in 1 sec: 1.90568 ( -0.22414  0.22412 ) ph/cm2/s
Energy fluence (15-150 keV)             : 0 ( 0  0 ) ergs/cm2
Time-resolved spectra
Distribution
T90 vs. Hardness ratio plot
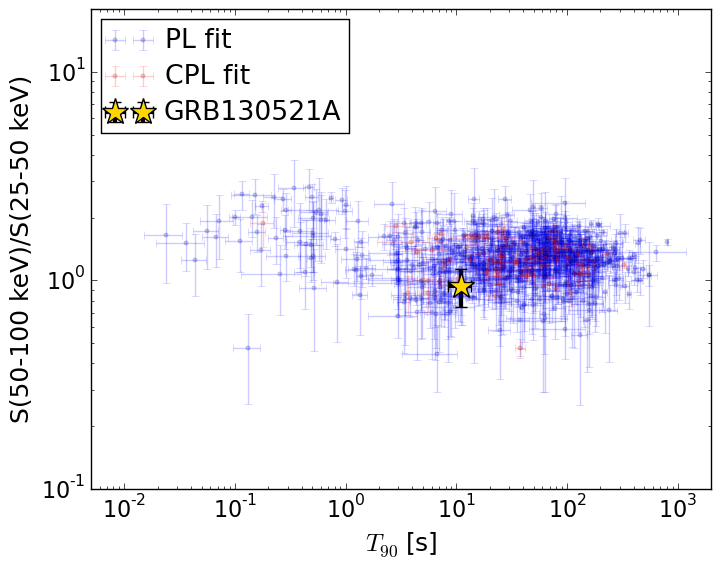
T90                                   = 10.956 sec.
Hardness ratio (energy fluence ratio) = 0.940936426609
S(15-50 keV) vs. S(50-150 keV) plot
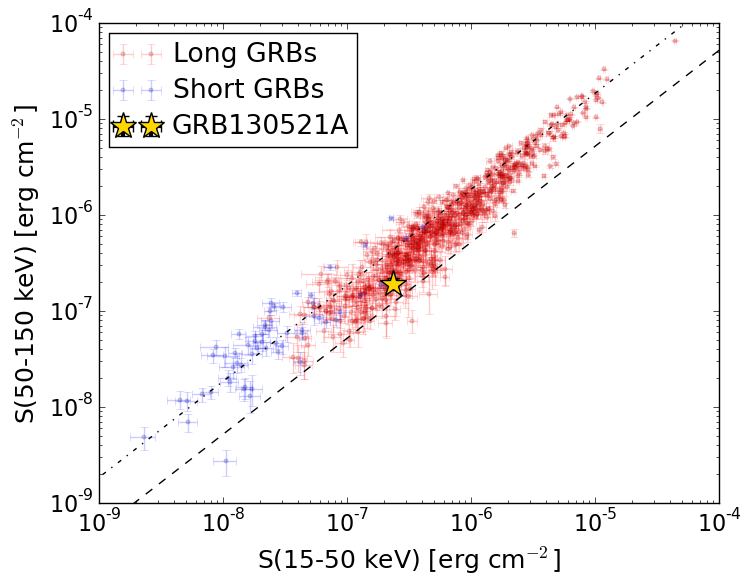
S(15-50 keV)  = 2.327575e-07
S(50-150 keV) = 1.9193068e-07
The dash-dotted line and the dashed line traces the fluences calculated from the Band function with Epeak = 15 and 150 keV, respectively. Both lines assume a canonical values of alpha = -1 and beta = -2.5.
Mask shadow pattern
IMX = 5.417203364954370E-02, IMY = 4.202798181786878E-01
Spacecraft aspect plot
Bright source in the pre-burst/pre-slew/post-slew images
Pre-burst image of 15-350 keV band
Time interval of the image:
-210.659410 -0.644000

# RAcent  DECcent POSerr Theta    Phi  PeakCts   SNR AngSep     Name
#  [deg]    [deg]    ['] [deg]  [deg]                   [']
 83.6366  22.0178    0.4  31.0  -77.3   8.5240  28.9    0.3	Crab
126.4361 -25.7633    2.9  32.3   99.5   1.4378   4.0 ------	UNKNOWN
 80.2897 -49.3385    2.7  51.2  159.7   4.0091   4.3 ------	UNKNOWN
128.0260  49.1245    3.0  55.5  -20.3   2.4155   3.9 ------	UNKNOWN
111.5837  53.0211    2.3  55.6  -33.7   5.6750   4.9 ------	UNKNOWN
 55.9775  -0.9222    2.3  47.6 -128.8   4.2925   4.9 ------	UNKNOWN
Pre-slew background subtracted image of 15-350 keV band
Time interval of the image:
-0.644000 12.640000

# RAcent  DECcent POSerr Theta    Phi  PeakCts   SNR AngSep     Name
#  [deg]    [deg]    ['] [deg]  [deg]                   [']
 83.5246  21.9261    3.8  31.0  -77.6   0.2038   3.0    8.0	Crab
137.2958 -12.4180    2.6  35.0   69.2   0.3945   4.4 ------	UNKNOWN
149.7731  10.5896    2.5  47.7   34.0   0.6301   4.7 ------	UNKNOWN
 99.5743 -43.9954    2.7  42.0  144.7   0.4354   4.4 ------	UNKNOWN
 87.5671  14.4708    0.7  23.0  -82.7   0.8138  15.3 ------	UNKNOWN
Post-slew image of 15-350 keV band
Time interval of the image:
153.740600 334.540600

# RAcent  DECcent POSerr Theta    Phi  PeakCts   SNR AngSep     Name
#  [deg]    [deg]    ['] [deg]  [deg]                   [']
 16.7415  55.4782    2.6  50.7  -44.5   3.8282   4.4 ------	UNKNOWN