Analysis Summary
Notes:
- 1) No attempt has been made to eliminate the non-significant decimal places.
- 2) This batgrbproduct analysis is done using the HEASARC data.
- 3) This batgrbproduct analysis is using the flight position for the mask-weighting calculation.
======================================================================
BAT GRB EVENT DATA PROCESSING REPORT
Process Script Ver: batgrbproduct v2.46
Process Start Time: Sun Jan 12 03:01:18 EST 2014
Host Name: batevent1
Current Working Dir: /local/data/batevent/batevent_reproc/trigger556753
======================================================================
Trigger: 00556753 Segment: 000
BAT Trigger Time: 391357300.8 [s; MET]
Trigger Stop: 391357301.824 [s; MET]
UTC: 2013-05-27T14:21:30.195820 [includes UTCF correction]
Where From?: TDRSS position message
BAT
RA: 309.278622826908 Dec: -24.7278211819239 [deg; J2000]
Catalogged Source?: NO
Point Source?: YES
GRB Indicated?: YES [ by BAT flight software ]
Image S/N Ratio: 13.89
Image Trigger?: NO
Rate S/N Ratio: 255.998046867549 [ if not an image trigger ]
Image S/N Ratio: 13.89
Analysis Position: [ source = BAT ]
RA: 309.278622826908 Dec: -24.7278211819239 [deg; J2000]
Refined Position: [ source = BAT pre-slew burst ]
RA: 309.28367215012 Dec: -24.7256766136192 [deg; J2000]
{ 20h 37m 08.1s , -24d 43' 32.4" }
+/- 1.09781641137707 [arcmin] (estimated 90% radius based on SNR)
+/- 0.452517545266986 [arcmin] (formal 1-sigma fit error)
SNR: 26.6206577351153
Angular difference between the analysis and refined position is 0.303780 arcmin
Partial Coding Fraction: 0.1005859 [ including projection effects ]
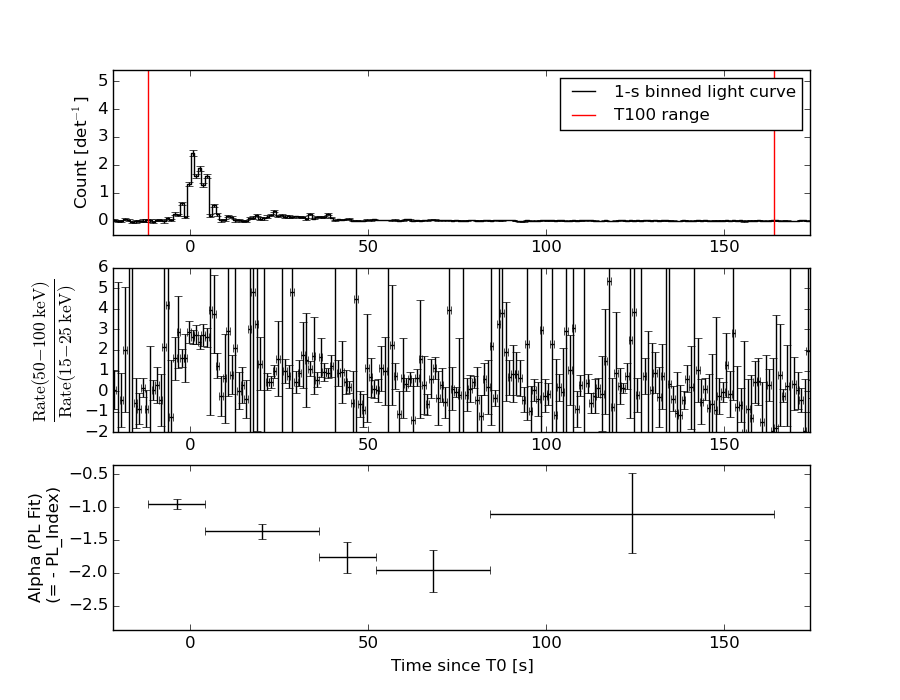
Duration
T90: 64 +/- 16
Measured from: -11.8000000119209
to: 52.1999999880791 [s; relative to TRIGTIME]
T50: 32 +/- 16
Measured from: -11.8000000119209
to: 20.1999999880791 [s; relative to TRIGTIME]
Fluence
Peak Flux (peak 1 second)
Measured from: -4.30000001192093
to: -3.30000001192093 [s; relative to TRIGTIME]
Total Fluence
Measured from: -11.8000000119209
to: 164.199999988079 [s; relative to TRIGTIME]
Band 1 Band 2 Band 3 Band 4
15-25 25-50 50-100 100-350 keV
Total 3.274903 5.901808 6.010891 2.751821
0.181348 0.198521 0.188777 0.165669 [error]
Peak 0.018947 0.010782 0.010736 -0.026477
0.021768 0.022964 0.018371 0.017685 [error]
[ fluence units of on-axis counts / fully illuminated detector ]
======================================================================
====== Table of the duration information =============================
Value tstart tstop
T100 176.000 -11.800 164.200
T90 64.000 -11.800 52.200
T50 32.000 -11.800 20.200
Peak 1.000 -4.300 -3.300
====== Spectral Analysis Summary =====================================
Model : spectral model: simple power-law (PL) and cutoff power-law (CPL)
Ph_index : photon index: E^{Ph_index}
Ph_90err : 90% error of the photon index
Epeak : Epeak in keV
Epeak_90err: 90% error of Epeak
Norm : normalization at 50 keV in both the PL model and CPL model
Nomr_90err : 90% error of the normalization
chi2 : Chi-Squared
dof : degree of freedo
=== Time-averaged spectral analysis ===
(Best model with acceptable fit: PL)
Model Ph_index Ph_90err_low Ph_90err_hi Epeak Epeak_90err_low Epeak_90err_hi Norm Nomr_90err_low Norm_90err_hi chi2 dof
PL -1.167 -0.065 0.066 - - - 7.35e-03 -2.66e-04 2.65e-04 49.710 57
CPL -1.164 -0.064 0.124 9999.340 -9999.340 -9999.340 7.39e-03 -2.60e-04 1.26e-03 49.760 56
=== 1-s peak spectral analysis ===
(Best model with acceptable fit: N/A)
Model Ph_index Ph_90err_low Ph_90err_hi Epeak Epeak_90err_low Epeak_90err_hi Norm Nomr_90err_low Norm_90err_hi chi2 dof
PL -1.615 1.615 1.615 - - - 3.06e-03 -3.06e-03 -3.06e-03 69.870 57
CPL -1.731 1.731 1.731 9997.830 -9997.830 -9997.830 3.06e-03 N/A N/A 69.880 56
=== Fluence/Peak Flux Summary ===
Model Band1 Band2 Band3 Band4 Band5 Total
15-25 25-50 50-100 100-350 15-150 15-350 keV
Fluence PL 1.21e-06 2.73e-06 4.86e-06 2.04e-05 1.33e-05 2.92e-05 erg/cm2
90%_error_low -9.28e-08 -1.25e-07 -1.87e-07 -1.80e-06 -4.82e-07 -1.87e-06 erg/cm2
90%_error_hi 9.57e-08 1.24e-07 1.86e-07 1.92e-06 4.83e-07 1.97e-06 erg/cm2
Peak flux PL 1.45e-01 1.34e-01 8.60e-02 8.49e-02 4.01e-01 4.48e-01 ph/cm2/s
90%_error_low -1.45e-01 -1.34e-01 -8.60e-02 -8.49e-02 -4.01e-01 -4.48e-01 ph/cm2/s
90%_error_hi 6.46e-01 2.12e-01 1.12e-01 1.34e+00 6.86e-01 6.64e-01 ph/cm2/s
Fluence CPL 1.23e-06 2.73e-06 4.82e-06 2.20e-05 1.33e-05 2.91e-05 erg/cm2
90%_error_low -1.22e-07 -1.43e-07 N/A N/A -6.13e-07 -3.82e-06 erg/cm2
90%_error_hi 7.17e-08 1.49e-07 N/A N/A 5.30e-07 1.90e-06 erg/cm2
Peak flux CPL N/A N/A N/A N/A N/A N/A ph/cm2/s
90%_error_low -1.45e-01 -1.34e-01 -8.60e-02 -8.49e-02 -4.01e-01 -4.48e-01 ph/cm2/s
90%_error_hi 6.46e-01 2.12e-01 1.12e-01 1.34e+00 6.86e-01 6.64e-01 ph/cm2/s
======================================================================
Image
Pre-slew 15.0-350.0 keV image (Event data)
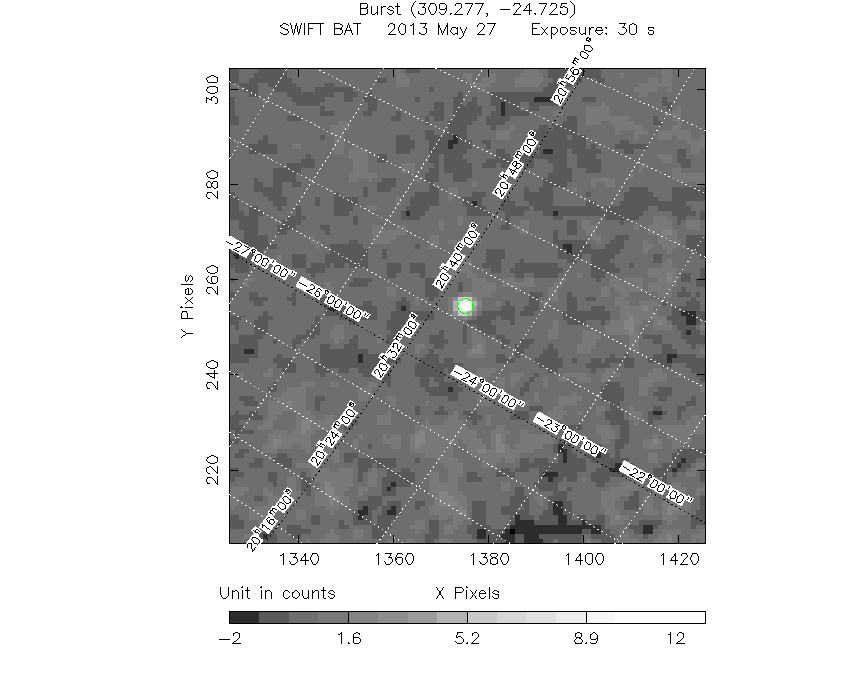
#   RAcent    DECcent   POSerr    Theta     Phi              Peak Cts       SNR   Name
  309.2837   -24.7257   0.0072    48.7603   155.8505        13.4439160     26.621 TRIG_00556753

Foreground time interval of the image:
-11.800  17.701 (delta_t =  29.501 [sec])
Background time interval of the image:
-644.699 -630.292 (delta_t =  14.408 [sec])
-239.800 -11.800 (delta_t = 228.000 [sec])
Light Curves
Note: The mask-weighted lightcurves have units of either count/det or counts/sec/det, where a det is 0.4 x 0.4 = 0.16 sq cm.
Full-time range; 1 s binning
Other quick-look light curves:
- 64 ms binning (zoomed)
- 16 ms binning (zoomed)
- 8 ms binning (zoomed)
- 2 ms binning (zoomed)
- SN=5 or 10 s binning (full-time range)
- Raw light curve
Spectra
- 64 ms binning (zoomed)
- 16 ms binning (zoomed)
- 8 ms binning (zoomed)
- 2 ms binning (zoomed)
- SN=5 or 10 s binning (full-time range)
- Raw light curve
Spectra
Notes:
- 1) The fitting includes the systematic errors.
- 2) When the burst includes telescope slew time periods, the fitting uses an average response file made from multiple 5-s response files through out the slew time plus single time preiod for the non-slew times, and weighted by the total counts in the corresponding time period using addrmf. An average response file is needed becuase a spectral fit using the pre-slew DRM will introduce some errors in both a spectral shape and a normalization if the PHA file contains a lot of the slew/post-slew time interval.
- 3) For fits to more complicated models (e.g. a power-law over a cutoff power-law), the BAT team has decided to require a chi-square improvement of more than 6 for each extra dof.
Time averaged spectrum fit using the average DRM
Power-law model
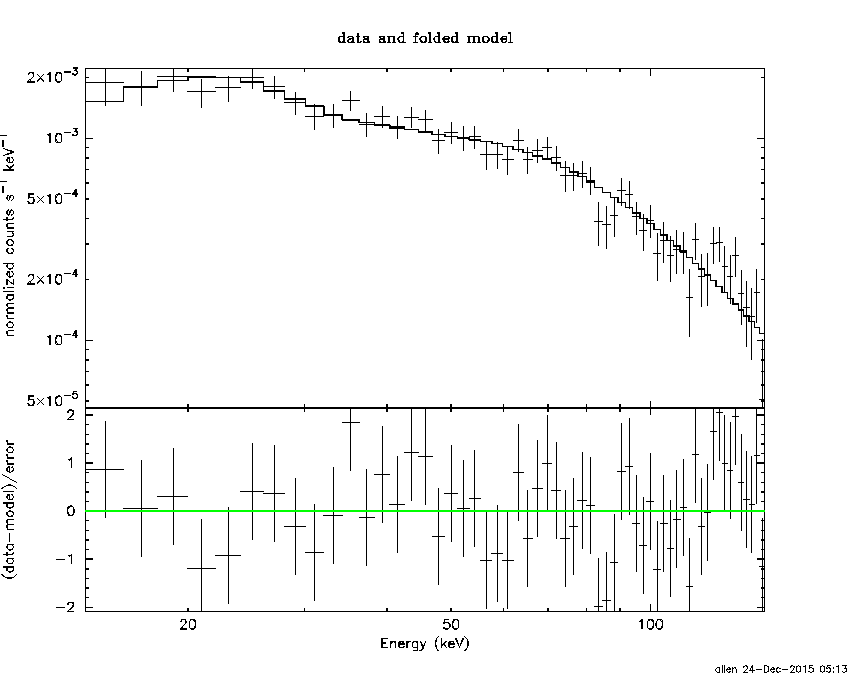
Time interval is from  -11.800 sec. to  164.200 sec.

Spectral model in power-law:
------------------------------------------------------------
Parameters  : value       lower 90%   higher 90%
Photon index: -1.16667     ( -0.0649779   0.0655488 )
Norm@50keV  : 7.35439E-03    ( -0.000265596   0.000264573 )
------------------------------------------------------------
#Fit statistic : Chi-Squared =          49.71 using 59 PHA bins.
# Reduced chi-squared =         0.8720 for     57 degrees of freedom
# Null hypothesis probability =   7.426208e-01

Photon flux (15-150 keV)    in 176 sec: 0.859428 ( -0.03336  0.033508 ) ph/cm2/s
Energy fluence (15-150 keV)             : 1.32603e-05 ( -4.82286e-07  4.82756e-07 ) ergs/cm2
Cutoff power-law model
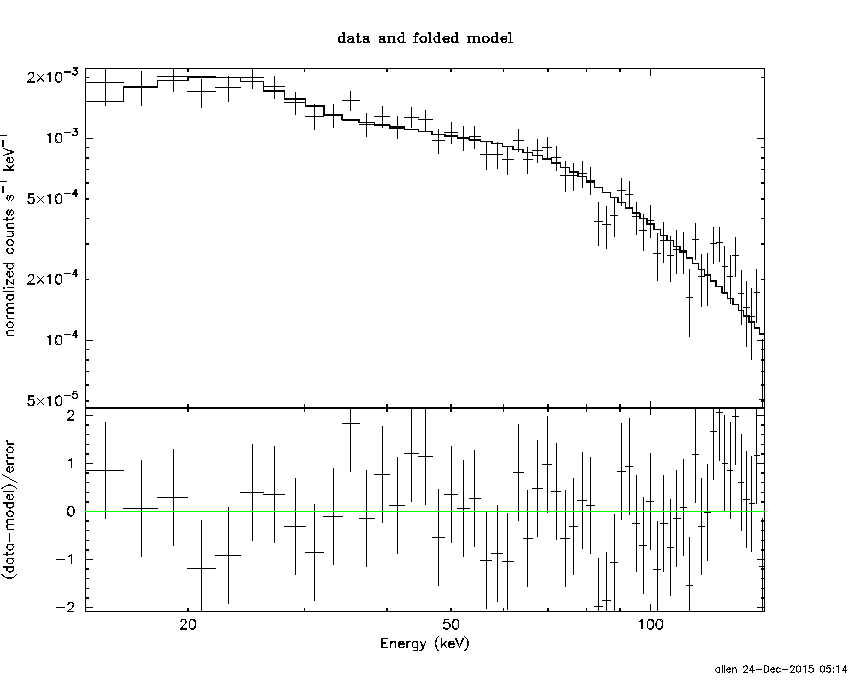
Time interval is from  -11.800 sec. to  164.200 sec.
Spectral model in the cutoff power-law:
------------------------------------------------------------
Parameters  : value       lower 90%   higher 90%
Photon index: -1.16364     ( -0.063713   0.123839 )
Epeak [keV] : 9999.34      ( -9999.36 -9999.36 )
Norm@50keV  : 7.38834E-03    ( -0.000263815   0.00125916 )
------------------------------------------------------------
#Fit statistic : Chi-Squared =          49.76 using 59 PHA bins.
# Reduced chi-squared =         0.8886 for     56 degrees of freedom
# Null hypothesis probability =   7.086090e-01

Photon flux (15-150 keV)    in 176 sec: 0.863891 ( -0.038057  0.028761 ) ph/cm2/s
Energy fluence (15-150 keV)             : 1.33043e-05 ( -6.13115e-07  5.29841e-07 ) ergs/cm2
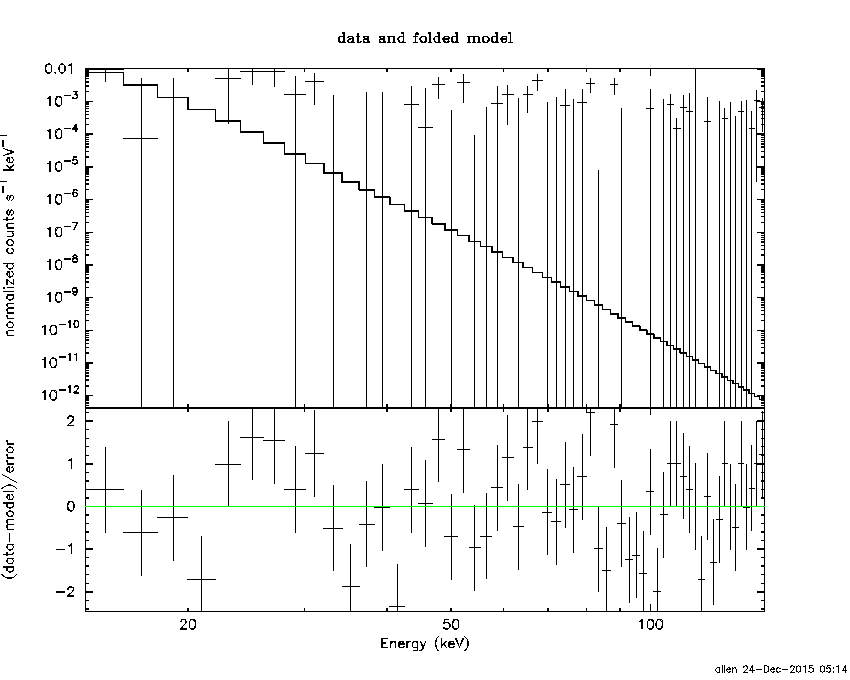
1-s peak spectrum fit
Power-law model

Time interval is from   -4.300 sec. to   -3.300 sec.

Spectral model in power-law:
------------------------------------------------------------
Parameters  : value       lower 90%   higher 90%
Photon index: -10     ( 10   10 )
Norm@50keV  : 9.35567E-07    ( -9.18882e-07   -9.18882e-07 )
------------------------------------------------------------
#Fit statistic : Chi-Squared =          69.34 using 59 PHA bins.
# Reduced chi-squared =          1.216 for     57 degrees of freedom
# Null hypothesis probability =   1.265352e-01

Photon flux (15-150 keV)    in 1 sec: 0.400585 0.258543 0.260471 (    ) ph/cm2/s
Energy fluence (15-150 keV)             : 2.8622e-08 ( 1  3.57801e-08 ) ergs/cm2
Cutoff power-law model
Time interval is from   -4.300 sec. to   -3.300 sec.
Spectral model in the cutoff power-law:
------------------------------------------------------------
Parameters  : value       lower 90%   higher 90%
Photon index: -9.97353     ( 9.99718   9.99718 )
Epeak [keV] : 9999.36      ( -10000 -10000 )
Norm@50keV  : 9.76092E-07    (     )
------------------------------------------------------------
#Fit statistic : Chi-Squared =          69.34 using 59 PHA bins.
# Reduced chi-squared =          1.238 for     56 degrees of freedom
# Null hypothesis probability =   1.085385e-01

Photon flux (15-150 keV)    in 1 sec:  (    ) ph/cm2/s
Energy fluence (15-150 keV)             : 2.35407e-08 ( 0  0 ) ergs/cm2
Time-resolved spectra
Distribution
T90 vs. Hardness ratio plot
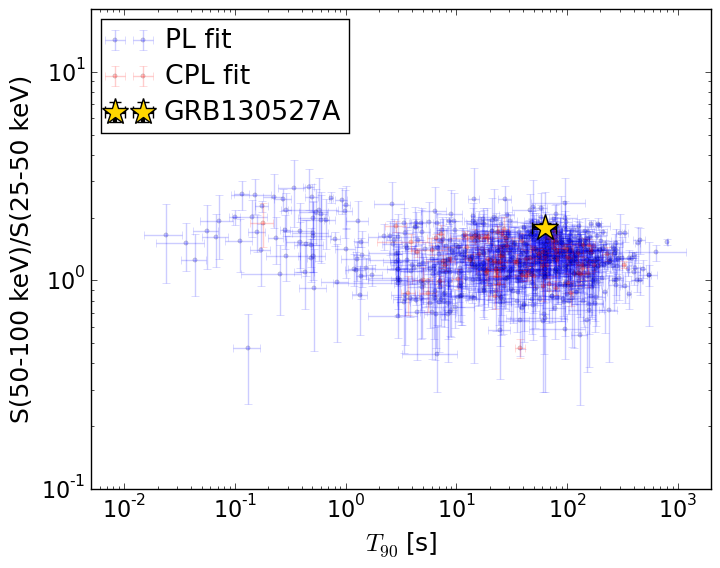
T90                                   = 64.0 sec.
Hardness ratio (energy fluence ratio) = 1.78184551034
S(15-50 keV) vs. S(50-150 keV) plot
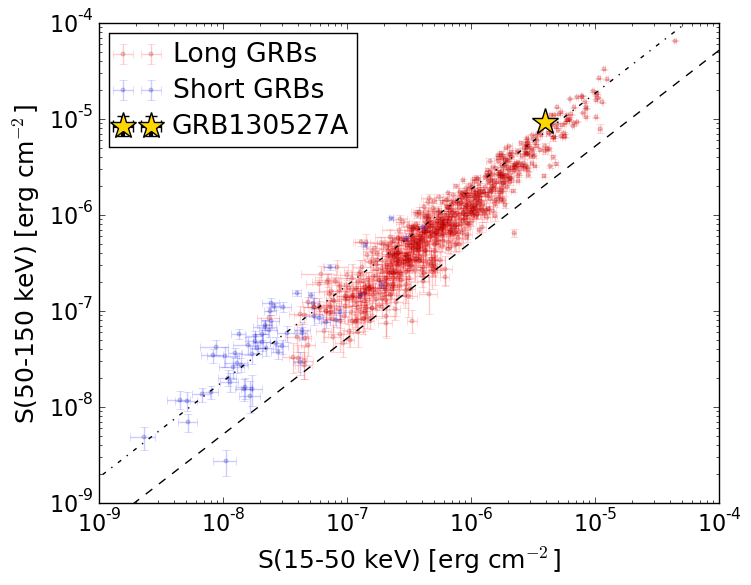
S(15-50 keV)  = 3.940299e-06
S(50-150 keV) = 9.319966e-06
The dash-dotted line and the dashed line traces the fluences calculated from the Band function with Epeak = 15 and 150 keV, respectively. Both lines assume a canonical values of alpha = -1 and beta = -2.5.
Mask shadow pattern

IMX = -1.040862663714176E+00, IMY = -4.666803415466253E-01
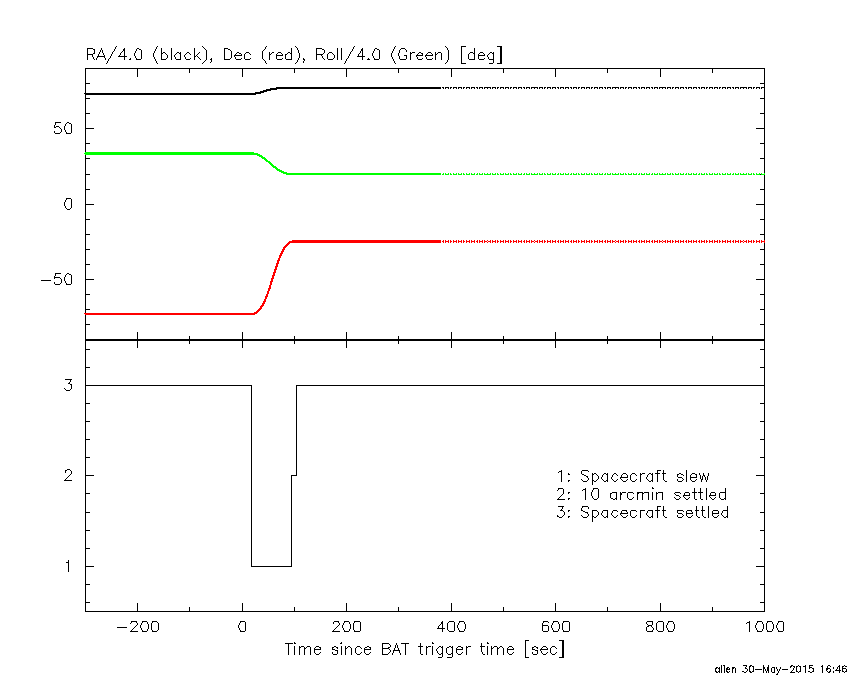
Spacecraft aspect plot
Bright source in the pre-burst/pre-slew/post-slew images
Pre-burst image of 15-350 keV band
Time interval of the image:
-644.699410 -630.291900
-239.800000 -11.800000

# RAcent  DECcent POSerr Theta    Phi  PeakCts   SNR AngSep     Name
#  [deg]    [deg]    ['] [deg]  [deg]                   [']
170.4168 -60.6356    5.7  41.1   -5.2   0.6448   2.0    3.1	Cen X-3
186.6606 -62.7652    9.0  35.8    4.4   0.3817   1.3    0.3	GX 301-2
255.8959 -38.0172    6.5  39.1   87.2   1.7562   1.8   11.2	4U 1700-377
264.5889 -44.5218    7.1  31.0   95.0   0.7091   1.6    7.9	4U 1735-44
275.1702 -54.4532    2.8  19.6  104.2   1.0321   4.2 ------	UNKNOWN
319.8802 -19.9909    3.4  54.8  167.4   4.7239   3.5 ------	UNKNOWN
146.9880 -45.4890    3.5  59.5  -17.0   4.8279   3.3 ------	UNKNOWN
125.4661 -51.9410    3.7  55.1  -34.7   4.4437   3.1 ------	UNKNOWN
 48.8672 -59.6168    3.0  40.8  -88.3   4.5069   3.9 ------	UNKNOWN
  7.9572 -36.5153    3.0  51.0 -135.6   4.8801   3.9 ------	UNKNOWN
Pre-slew background subtracted image of 15-350 keV band
Time interval of the image:
-11.800000 17.700600

# RAcent  DECcent POSerr Theta    Phi  PeakCts   SNR AngSep     Name
#  [deg]    [deg]    ['] [deg]  [deg]                   [']
170.2168 -60.7162    5.3  41.1   -5.4  -0.2796  -2.2    6.3	Cen X-3
186.4347 -62.8376    5.9  35.8    4.2   0.2270   1.9    7.3	GX 301-2
256.0329 -37.9079    3.8  39.2   87.4   1.5289   3.0    4.4	4U 1700-377
264.9616 -44.4928   20.1  31.0   95.5   0.1295   0.6    9.7	4U 1735-44
220.9103 -41.3379    3.8  45.6   47.8   1.2618   3.1 ------	UNKNOWN
281.6635 -33.0668    2.5  40.0  121.2   1.9644   4.5 ------	UNKNOWN
309.2837 -24.7257    0.4  48.8  155.9  13.4432  26.6 ------	UNKNOWN
183.6073 -43.2733    2.0  54.3   13.6   2.5694   5.9 ------	UNKNOWN
338.8132 -34.3329    2.9  44.8 -166.7   0.6553   4.0 ------	UNKNOWN
154.4253 -45.2580    2.5  58.6  -11.0   2.2642   4.7 ------	UNKNOWN
357.2890 -38.6386    2.8  45.9 -145.0   0.7045   4.2 ------	UNKNOWN
 50.2827 -59.9312    3.0  40.8  -87.1   1.1849   3.9 ------	UNKNOWN
Post-slew image of 15-350 keV band
Time interval of the image:
93.700590 962.270000

# RAcent  DECcent POSerr Theta    Phi  PeakCts   SNR AngSep     Name
#  [deg]    [deg]    ['] [deg]  [deg]                   [']
264.8693 -44.5221    8.1  40.9   61.0  -3.4330  -1.4    6.9	4U 1735-44
270.3737 -25.0841    3.6  35.2   92.3   4.6216   3.2    4.9	GX 5-1
270.1514 -25.6066    0.0  35.3   91.3  -1.0166  -0.7   11.6	GRS 1758-258
273.8939 -14.1417    4.3  34.9  112.3   4.2515   2.7    9.1	GX 17+2
275.7582 -30.3096    5.1  30.1   83.0   2.5478   2.3    9.3	H1820-303
284.8712 -24.9661    4.8  22.1   95.5  -1.8147  -2.4    9.4	HT1900.1-2455
288.8033  10.9470    1.1  40.9  159.6  12.8436  10.3    0.3	GRS 1915+105
280.7428 -16.8086    2.7  27.8  112.3   3.9393   4.3 ------	UNKNOWN
285.3544  -5.8314    2.4  29.7  136.8   4.2901   4.9 ------	UNKNOWN
299.5766 -13.3391    2.7  14.6  150.7   2.2832   4.3 ------	UNKNOWN
 12.2688 -60.9592    3.9  55.5  -20.4   6.7084   3.0 ------	UNKNOWN
  7.6744 -41.2726    4.1  50.7  -44.6  11.0308   2.8 ------	UNKNOWN