Analysis Summary
Notes:
- 1) No attempt has been made to eliminate the non-significant decimal places.
- 2) This batgrbproduct analysis is done using the HEASARC data.
- 3) This batgrbproduct analysis is using the flight position for the mask-weighting calculation.
======================================================================
BAT GRB EVENT DATA PROCESSING REPORT
Process Script Ver: batgrbproduct v2.46
Process Start Time: Sun Jan 12 02:48:09 EST 2014
Host Name: batevent1
Current Working Dir: /local/data/batevent/batevent_reproc/trigger556930
======================================================================
Trigger: 00556930 Segment: 000
BAT Trigger Time: 391518936 [s; MET]
Trigger Stop: 391519000 [s; MET]
UTC: 2013-05-29T11:15:25.388620 [includes UTCF correction]
Where From?: TDRSS position message
BAT
RA: 24.2588443927767 Dec: -64.1383871612738 [deg; J2000]
Catalogged Source?: NO
Point Source?: YES
GRB Indicated?: YES [ by BAT flight software ]
Image S/N Ratio: 7.22
Image Trigger?: YES
Rate S/N Ratio: 0 [ if not an image trigger ]
Image S/N Ratio: 7.22
Analysis Position: [ source = BAT ]
RA: 24.2588443927767 Dec: -64.1383871612738 [deg; J2000]
Refined Position: [ source = BAT pre-slew burst ]
RA: 24.3081515004987 Dec: -64.1305370416994 [deg; J2000]
{ 01h 37m 14.0s , -64d 07' 49.9" }
+/- 1.5502380195838 [arcmin] (estimated 90% radius based on SNR)
+/- 0.616314714947689 [arcmin] (formal 1-sigma fit error)
SNR: 16.2600055280406
Angular difference between the analysis and refined position is 1.373904 arcmin
Partial Coding Fraction: 1 [ including projection effects ]
Duration
T90: 87.5919999480247 +/- 11.0791425584706
Measured from: 42.4079999923706
to: 129.999999940395 [s; relative to TRIGTIME]
T50: 41.2159999608994 +/- 18.7858504970482
Measured from: 59.1480000019073
to: 100.363999962807 [s; relative to TRIGTIME]
Fluence
Peak Flux (peak 1 second)
Measured from: 59.1320000290871
to: 60.1320000290871 [s; relative to TRIGTIME]
Total Fluence
Measured from: 36.1280000209808
to: 146.459999978542 [s; relative to TRIGTIME]
Band 1 Band 2 Band 3 Band 4
15-25 25-50 50-100 100-350 keV
Total 0.694293 0.843487 0.592798 0.119075
0.059199 0.061343 0.054634 0.047801 [error]
Peak 0.014150 0.027085 0.016748 0.004640
0.005886 0.006047 0.005362 0.004498 [error]
[ fluence units of on-axis counts / fully illuminated detector ]
======================================================================
====== Table of the duration information =============================
Value tstart tstop
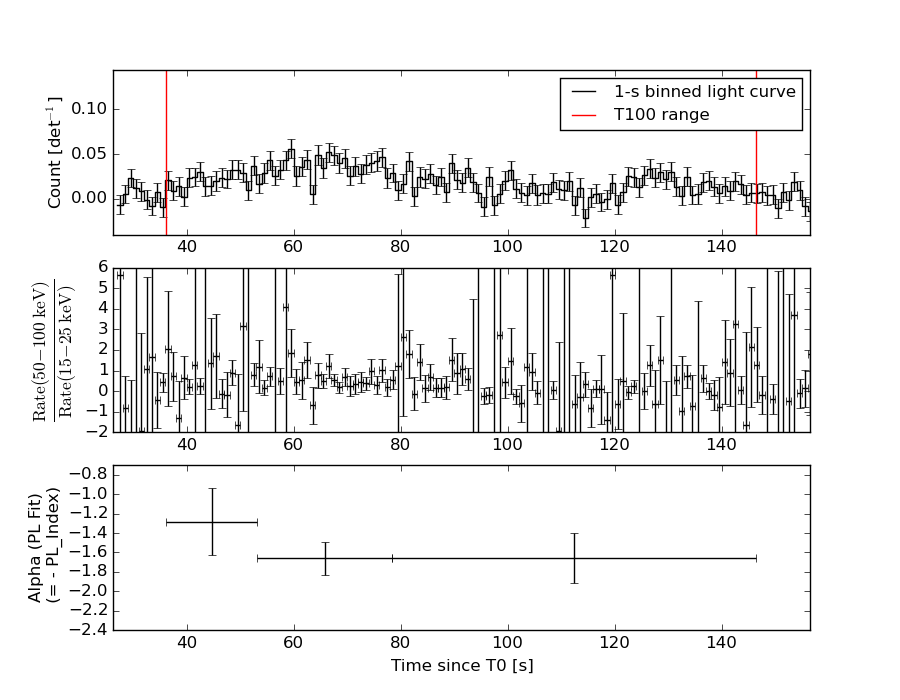
T100 110.332 36.128 146.460
T90 87.592 42.408 130.000
T50 41.216 59.148 100.364
Peak 1.000 59.132 60.132
====== Spectral Analysis Summary =====================================
Model : spectral model: simple power-law (PL) and cutoff power-law (CPL)
Ph_index : photon index: E^{Ph_index}
Ph_90err : 90% error of the photon index
Epeak : Epeak in keV
Epeak_90err: 90% error of Epeak
Norm : normalization at 50 keV in both the PL model and CPL model
Nomr_90err : 90% error of the normalization
chi2 : Chi-Squared
dof : degree of freedo
=== Time-averaged spectral analysis ===
(Best model with acceptable fit: PL)
Model Ph_index Ph_90err_low Ph_90err_hi Epeak Epeak_90err_low Epeak_90err_hi Norm Nomr_90err_low Norm_90err_hi chi2 dof
PL -1.609 -0.146 0.144 - - - 1.22e-03 -1.10e-04 1.08e-04 58.060 57
CPL -1.205 -0.484 0.615 88.931 -30.833 -88.931 2.03e-03 -8.79e-04 2.32e-03 56.450 56
=== 1-s peak spectral analysis ===
(Best model with acceptable fit: PL)
Model Ph_index Ph_90err_low Ph_90err_hi Epeak Epeak_90err_low Epeak_90err_hi Norm Nomr_90err_low Norm_90err_hi chi2 dof
PL -1.592 -0.504 0.464 - - - 3.75e-03 -1.17e-03 1.13e-03 56.610 57
CPL 0.155 -2.352 5.144 55.794 -29.131 -55.794 3.29e-02 -3.29e-02 1.13e+01 55.310 56
=== Fluence/Peak Flux Summary ===
Model Band1 Band2 Band3 Band4 Band5 Total
15-25 25-50 50-100 100-350 15-150 15-350 keV
Fluence PL 1.90e-07 3.27e-07 4.29e-07 1.14e-06 1.26e-06 2.09e-06 erg/cm2
90%_error_low -2.40e-08 -2.68e-08 -5.17e-08 -2.61e-07 -1.22e-07 -3.13e-07 erg/cm2
90%_error_hi 2.47e-08 2.68e-08 5.19e-08 3.10e-07 1.24e-07 3.53e-07 erg/cm2
Peak flux PL 1.69e-01 1.61e-01 1.07e-01 1.10e-01 4.81e-01 5.46e-01 ph/cm2/s
90%_error_low -6.71e-02 -4.49e-02 -4.15e-02 -6.57e-02 -1.32e-01 -1.55e-01 ph/cm2/s
90%_error_hi 7.35e-02 4.47e-02 4.17e-02 1.05e-01 1.33e-01 1.60e-01 ph/cm2/s
Fluence CPL 1.82e-07 3.44e-07 4.30e-07 5.71e-07 1.20e-06 1.53e-06 erg/cm2
90%_error_low -2.71e-08 -3.44e-08 -5.57e-08 -3.27e-07 -1.40e-07 -3.60e-07 erg/cm2
90%_error_hi 2.72e-08 3.54e-08 5.53e-08 6.66e-07 1.43e-07 6.92e-07 erg/cm2
Peak flux CPL 1.31e-01 1.91e-01 1.11e-01 2.00e-02 4.50e-01 4.53e-01 ph/cm2/s
90%_error_low -1.31e-01 -6.29e-02 -5.13e-02 -2.00e-02 -1.44e-01 -1.46e-01 ph/cm2/s
90%_error_hi 9.20e-02 6.68e-02 5.09e-02 9.26e-02 1.41e-01 1.85e-01 ph/cm2/s
======================================================================
Image
Pre-slew 15.0-350.0 keV image (Event data)
#   RAcent    DECcent   POSerr    Theta     Phi              Peak Cts       SNR   Name
   24.3082   -64.1305   0.0118     9.4972  -126.9359         1.1279834     16.260 TRIG_00556930

Foreground time interval of the image:
 36.128  72.501 (delta_t =  36.373 [sec])
Background time interval of the image:
-465.699 -449.564 (delta_t =  16.135 [sec])
-239.000  36.128 (delta_t = 275.128 [sec])
Light Curves
Note: The mask-weighted lightcurves have units of either count/det or counts/sec/det, where a det is 0.4 x 0.4 = 0.16 sq cm.
Full-time range; 1 s binning
Other quick-look light curves:
- 64 ms binning (zoomed)
- 16 ms binning (zoomed)
- 8 ms binning (zoomed)
- 2 ms binning (zoomed)
- SN=5 or 10 s binning (full-time range)
- Raw light curve
Spectra
- 64 ms binning (zoomed)
- 16 ms binning (zoomed)
- 8 ms binning (zoomed)
- 2 ms binning (zoomed)
- SN=5 or 10 s binning (full-time range)
- Raw light curve
Spectra
Notes:
- 1) The fitting includes the systematic errors.
- 2) When the burst includes telescope slew time periods, the fitting uses an average response file made from multiple 5-s response files through out the slew time plus single time preiod for the non-slew times, and weighted by the total counts in the corresponding time period using addrmf. An average response file is needed becuase a spectral fit using the pre-slew DRM will introduce some errors in both a spectral shape and a normalization if the PHA file contains a lot of the slew/post-slew time interval.
- 3) For fits to more complicated models (e.g. a power-law over a cutoff power-law), the BAT team has decided to require a chi-square improvement of more than 6 for each extra dof.
Time averaged spectrum fit using the average DRM
Power-law model
Time interval is from   36.128 sec. to  146.460 sec.

Spectral model in power-law:
------------------------------------------------------------
Parameters  : value       lower 90%   higher 90%
Photon index: -1.60872     ( -0.146453   0.144099 )
Norm@50keV  : 1.22007E-03    ( -0.000109576   0.00010837 )
------------------------------------------------------------
#Fit statistic : Chi-Squared =          58.06 using 59 PHA bins.
# Reduced chi-squared =          1.019 for     57 degrees of freedom
# Null hypothesis probability =   4.360963e-01

Photon flux (15-150 keV)    in 110.3 sec: 0.157217 ( -0.012831  0.012835 ) ph/cm2/s
Energy fluence (15-150 keV)             : 1.25741e-06 ( -1.21626e-07  1.23534e-07 ) ergs/cm2
Cutoff power-law model
Time interval is from   36.128 sec. to  146.460 sec.
Spectral model in the cutoff power-law:
------------------------------------------------------------
Parameters  : value       lower 90%   higher 90%
Photon index: -1.20464     ( -0.483611   0.615031 )
Epeak [keV] : 88.9309      ( -30.8334 -88.9309 )
Norm@50keV  : 2.03219E-03    ( -0.000879442   0.00231838 )
------------------------------------------------------------
#Fit statistic : Chi-Squared =          56.45 using 59 PHA bins.
# Reduced chi-squared =          1.008 for     56 degrees of freedom
# Null hypothesis probability =   4.580259e-01

Photon flux (15-150 keV)    in 110.3 sec: 0.154466 ( -0.013354  0.013341 ) ph/cm2/s
Energy fluence (15-150 keV)             : 1.2023e-06 ( -1.40399e-07  1.42893e-07 ) ergs/cm2
1-s peak spectrum fit
Power-law model
Time interval is from   59.132 sec. to   60.132 sec.

Spectral model in power-law:
------------------------------------------------------------
Parameters  : value       lower 90%   higher 90%
Photon index: -1.59196     ( -0.503924   0.463889 )
Norm@50keV  : 3.75045E-03    ( -0.00116906   0.00112704 )
------------------------------------------------------------
#Fit statistic : Chi-Squared =          56.61 using 59 PHA bins.
# Reduced chi-squared =         0.9932 for     57 degrees of freedom
# Null hypothesis probability =   4.896599e-01

Photon flux (15-150 keV)    in 1 sec: 0.480774 ( -0.132492  0.132528 ) ph/cm2/s
Energy fluence (15-150 keV)             : 3.5114e-08 ( -1.13981e-08  1.19274e-08 ) ergs/cm2
Cutoff power-law model
Time interval is from   59.132 sec. to   60.132 sec.
Spectral model in the cutoff power-law:
------------------------------------------------------------
Parameters  : value       lower 90%   higher 90%
Photon index: 0.155263     ( -2.38282   5.11294 )
Epeak [keV] : 55.7945      ( -28.9151 -55.579 )
Norm@50keV  : 3.29253E-02    ( -0.0350527   11.3394 )
------------------------------------------------------------
#Fit statistic : Chi-Squared =          55.31 using 59 PHA bins.
# Reduced chi-squared =         0.9877 for     56 degrees of freedom
# Null hypothesis probability =   5.008038e-01

Photon flux (15-150 keV)    in 1 sec: 0.450181 ( -0.143527  0.141041 ) ph/cm2/s
Energy fluence (15-150 keV)             : 3.0334e-08 ( -1.04108e-08  1.36627e-08 ) ergs/cm2
Time-resolved spectra
Distribution
T90 vs. Hardness ratio plot
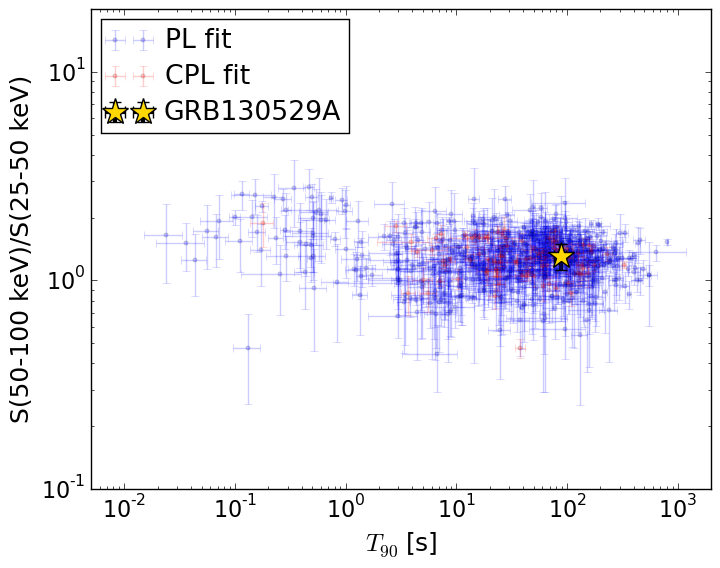
T90                                   = 87.592 sec.
Hardness ratio (energy fluence ratio) = 1.31159561787
S(15-50 keV) vs. S(50-150 keV) plot
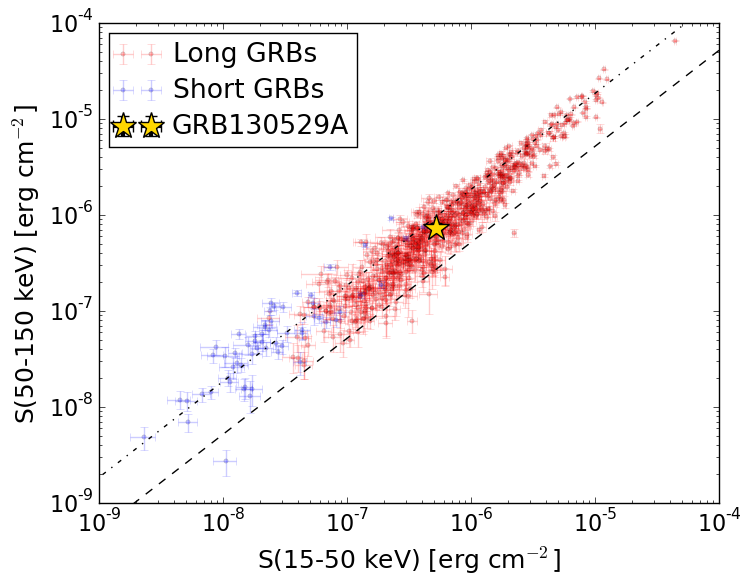
S(15-50 keV)  = 5.175542e-07
S(50-150 keV) = 7.398614e-07
The dash-dotted line and the dashed line traces the fluences calculated from the Band function with Epeak = 15 and 150 keV, respectively. Both lines assume a canonical values of alpha = -1 and beta = -2.5.
Mask shadow pattern
IMX = -1.005298123265684E-01, IMY = 1.337184207226820E-01
Spacecraft aspect plot
Bright source in the pre-burst/pre-slew/post-slew images
Pre-burst image of 15-350 keV band
Time interval of the image:
-465.699400 -449.564300
-239.000000 36.128000

# RAcent  DECcent POSerr Theta    Phi  PeakCts   SNR AngSep     Name
#  [deg]    [deg]    ['] [deg]  [deg]                   [']
135.5134 -40.6786   11.8  57.4   -8.9   1.3195   1.0    7.5	Vela X-1
169.9734 -60.5052   36.3  44.2   24.8   0.1617   0.3   12.3	Cen X-3
186.7563 -62.7379  216.9  43.3   36.6   0.0311   0.1    3.4	GX 301-2
296.2606 -49.5125    2.2  42.0  122.2   4.9608   5.2 ------	UNKNOWN
152.4087 -54.4010    3.1  47.7    9.9   1.8592   3.7 ------	UNKNOWN
151.9749 -48.5695    2.3  53.2    7.5   4.5405   5.1 ------	UNKNOWN
358.9529 -16.2769    4.8  58.8 -159.3   4.0432   2.4 ------	UNKNOWN
 97.7328 -37.0831    5.5  50.7  -44.6   2.8720   2.1 ------	UNKNOWN
Pre-slew background subtracted image of 15-350 keV band
Time interval of the image:
36.128000 72.500600

# RAcent  DECcent POSerr Theta    Phi  PeakCts   SNR AngSep     Name
#  [deg]    [deg]    ['] [deg]  [deg]                   [']
135.3516 -40.6039    5.0  57.4   -9.1   0.8460   2.3    8.6	Vela X-1
170.2517 -60.7239   18.0  44.0   25.0   0.1056   0.6    6.3	Cen X-3
186.8659 -62.6897   14.5  43.4   36.7   0.1625   0.8    7.5	GX 301-2
134.8614 -52.0192    2.6  46.5   -4.7   0.5689   4.5 ------	UNKNOWN
 24.3082 -64.1305    0.7   9.5 -126.9   1.1281  16.3 ------	UNKNOWN
104.2562 -38.9233    1.9  50.8  -37.5   1.4366   5.9 ------	UNKNOWN
Post-slew image of 15-350 keV band
Time interval of the image:
101.500600 963.057000

# RAcent  DECcent POSerr Theta    Phi  PeakCts   SNR AngSep     Name
#  [deg]    [deg]    ['] [deg]  [deg]                   [']
 38.8885 -77.0609    3.5  13.7   37.7   1.8414   3.3 ------	UNKNOWN
  2.8810 -45.5846    3.5  22.0 -171.3   1.7992   3.3 ------	UNKNOWN
113.0122 -38.4226    3.6  55.5  -20.4   6.9540   3.2 ------	UNKNOWN
 89.7573 -32.4201    5.2  50.6  -44.5   8.7301   2.3 ------	UNKNOWN
 89.9619 -32.2667    4.9  50.8  -44.5  10.9870   2.8 ------	UNKNOWN