Analysis Summary
Notes:
- 1) No attempt has been made to eliminate the non-significant decimal places.
- 2) This batgrbproduct analysis is done using the HEASARC data.
- 3) This batgrbproduct analysis is using the flight position for the mask-weighting calculation.
======================================================================
BAT GRB EVENT DATA PROCESSING REPORT
Process Script Ver: batgrbproduct v2.46
Process Start Time: Sun Jan 12 02:33:24 EST 2014
Host Name: batevent1
Current Working Dir: /local/data/batevent/batevent_reproc/trigger557274
======================================================================
Trigger: 00557274 Segment: 000
BAT Trigger Time: 391931983.296 [s; MET]
Trigger Stop: 391931991.488 [s; MET]
UTC: 2013-06-03T05:59:32.666180 [includes UTCF correction]
Where From?: TDRSS position message
BAT
RA: 86.9541212664379 Dec: 82.9339151120058 [deg; J2000]
Catalogged Source?: NO
Point Source?: YES
GRB Indicated?: YES [ by BAT flight software ]
Image S/N Ratio: 11.2
Image Trigger?: NO
Rate S/N Ratio: 9 [ if not an image trigger ]
Image S/N Ratio: 11.2
Analysis Position: [ source = BAT ]
RA: 86.9541212664379 Dec: 82.9339151120058 [deg; J2000]
Refined Position: [ source = BAT pre-slew burst ]
RA: 86.9304984442012 Dec: 82.9109451215811 [deg; J2000]
{ 05h 47m 43.3s , +82d 54' 39.4" }
+/- 1.25997412600766 [arcmin] (estimated 90% radius based on SNR)
+/- 0.382512649525744 [arcmin] (formal 1-sigma fit error)
SNR: 21.8647556065317
Angular difference between the analysis and refined position is 1.389220 arcmin
Partial Coding Fraction: 0.984375 [ including projection effects ]
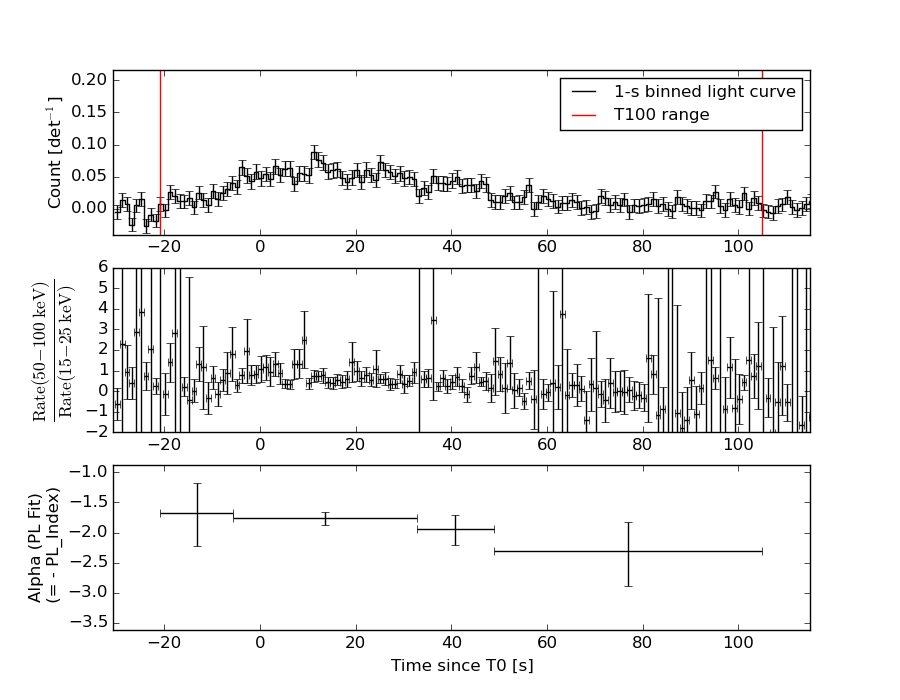
Duration
T90: 69.1279999613762 +/- 23.4262938267232
Measured from: -8.92800003290176
to: 60.1999999284744 [s; relative to TRIGTIME]
T50: 32.4239999055862 +/- 4.02004972002492
Measured from: 5.68400001525879
to: 38.107999920845 [s; relative to TRIGTIME]
Fluence
Peak Flux (peak 1 second)
Measured from: 11.2680000066757
to: 12.2680000066757 [s; relative to TRIGTIME]
Total Fluence
Measured from: -20.811999976635
to: 104.980000019073 [s; relative to TRIGTIME]
Band 1 Band 2 Band 3 Band 4
15-25 25-50 50-100 100-350 keV
Total 1.271948 1.296522 0.817463 0.102862
0.063729 0.066677 0.059953 0.054494 [error]
Peak 0.029284 0.030868 0.026124 0.011178
0.005958 0.006277 0.005551 0.004993 [error]
[ fluence units of on-axis counts / fully illuminated detector ]
======================================================================
====== Table of the duration information =============================
Value tstart tstop
T100 125.792 -20.812 104.980
T90 69.128 -8.928 60.200
T50 32.424 5.684 38.108
Peak 1.000 11.268 12.268
====== Spectral Analysis Summary =====================================
Model : spectral model: simple power-law (PL) and cutoff power-law (CPL)
Ph_index : photon index: E^{Ph_index}
Ph_90err : 90% error of the photon index
Epeak : Epeak in keV
Epeak_90err: 90% error of Epeak
Norm : normalization at 50 keV in both the PL model and CPL model
Nomr_90err : 90% error of the normalization
chi2 : Chi-Squared
dof : degree of freedo
=== Time-averaged spectral analysis ===
(Best model with acceptable fit: PL)
Model Ph_index Ph_90err_low Ph_90err_hi Epeak Epeak_90err_low Epeak_90err_hi Norm Nomr_90err_low Norm_90err_hi chi2 dof
PL -1.835 -0.122 0.119 - - - 1.64e-03 -1.15e-04 1.14e-04 40.940 57
CPL -1.705 -0.246 0.469 104.195 N/A N/A 1.93e-03 N/A N/A 40.680 56
=== 1-s peak spectral analysis ===
(Best model with acceptable fit: PL)
Model Ph_index Ph_90err_low Ph_90err_hi Epeak Epeak_90err_low Epeak_90err_hi Norm Nomr_90err_low Norm_90err_hi chi2 dof
PL -1.461 -0.341 0.335 - - - 6.06e-03 -1.23e-03 1.20e-03 55.400 57
CPL -1.255 -1.397 1.432 171.420 -171.420 -171.420 7.80e-03 -7.80e-03 3.65e-02 55.310 56
=== Fluence/Peak Flux Summary ===
Model Band1 Band2 Band3 Band4 Band5 Total
15-25 25-50 50-100 100-350 15-150 15-350 keV
Fluence PL 3.62e-07 5.43e-07 6.09e-07 1.29e-06 1.90e-06 2.81e-06 erg/cm2
90%_error_low -3.51e-08 -3.25e-08 -5.96e-08 -2.48e-07 -1.34e-07 -3.04e-07 erg/cm2
90%_error_hi 3.62e-08 3.25e-08 6.00e-08 2.86e-07 1.36e-07 3.35e-07 erg/cm2
Peak flux PL 2.40e-01 2.47e-01 1.80e-01 2.10e-01 7.49e-01 8.77e-01 ph/cm2/s
90%_error_low -7.30e-02 -4.93e-02 -4.63e-02 -9.18e-02 -1.42e-01 -1.74e-01 ph/cm2/s
90%_error_hi 7.82e-02 4.86e-02 4.59e-02 1.29e-01 1.42e-01 1.78e-01 ph/cm2/s
Fluence CPL 3.68e-07 5.11e-07 6.09e-07 1.27e-06 1.76e-06 2.69e-06 erg/cm2
90%_error_low -4.04e-08 -5.45e-08 -6.10e-08 -7.72e-07 -1.78e-07 -7.90e-07 erg/cm2
90%_error_hi 2.44e-08 4.38e-08 6.13e-08 4.03e-07 1.37e-07 2.09e-07 erg/cm2
Peak flux CPL 2.33e-01 2.53e-01 1.82e-01 1.59e-01 7.43e-01 8.28e-01 ph/cm2/s
90%_error_low -8.36e-02 -5.43e-02 -4.80e-02 -1.59e-01 -1.47e-01 -2.08e-01 ph/cm2/s
90%_error_hi 7.98e-02 6.17e-02 5.01e-02 7.67e-02 1.46e-01 2.22e-01 ph/cm2/s
======================================================================
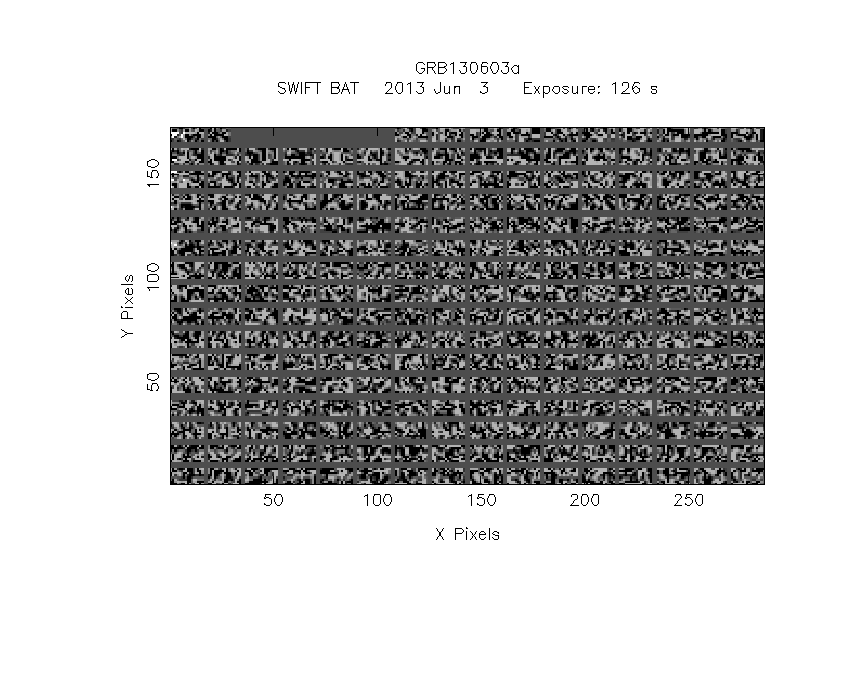
Image
Pre-slew 15.0-350.0 keV image (Event data)
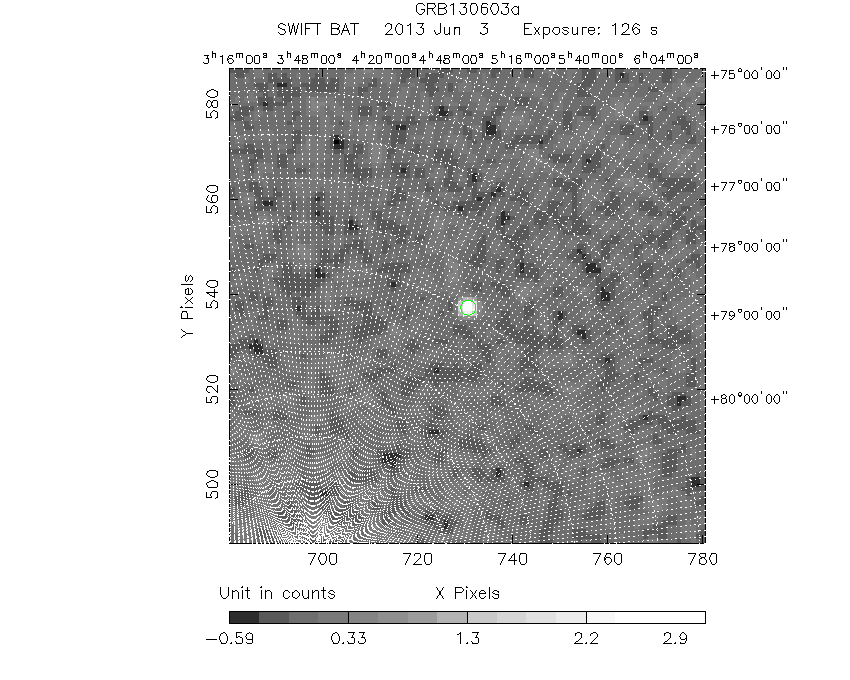
#   RAcent    DECcent   POSerr    Theta     Phi              Peak Cts       SNR   Name
   86.9305    82.9109   0.0088    18.6644   -22.1108         3.4578330     21.865 TRIG_00557274

Foreground time interval of the image:
-20.812 104.980 (delta_t = 125.792 [sec])
Background time interval of the image:
-590.195 -572.306 (delta_t =  17.890 [sec])
-239.296 -20.812 (delta_t = 218.484 [sec])
Light Curves
Note: The mask-weighted lightcurves have units of either count/det or counts/sec/det, where a det is 0.4 x 0.4 = 0.16 sq cm.
Full-time range; 1 s binning
Other quick-look light curves:
- 64 ms binning (zoomed)
- 16 ms binning (zoomed)
- 8 ms binning (zoomed)
- 2 ms binning (zoomed)
- SN=5 or 10 s binning (full-time range)
- Raw light curve
Spectra
- 64 ms binning (zoomed)
- 16 ms binning (zoomed)
- 8 ms binning (zoomed)
- 2 ms binning (zoomed)
- SN=5 or 10 s binning (full-time range)
- Raw light curve
Spectra
Notes:
- 1) The fitting includes the systematic errors.
- 2) When the burst includes telescope slew time periods, the fitting uses an average response file made from multiple 5-s response files through out the slew time plus single time preiod for the non-slew times, and weighted by the total counts in the corresponding time period using addrmf. An average response file is needed becuase a spectral fit using the pre-slew DRM will introduce some errors in both a spectral shape and a normalization if the PHA file contains a lot of the slew/post-slew time interval.
- 3) For fits to more complicated models (e.g. a power-law over a cutoff power-law), the BAT team has decided to require a chi-square improvement of more than 6 for each extra dof.
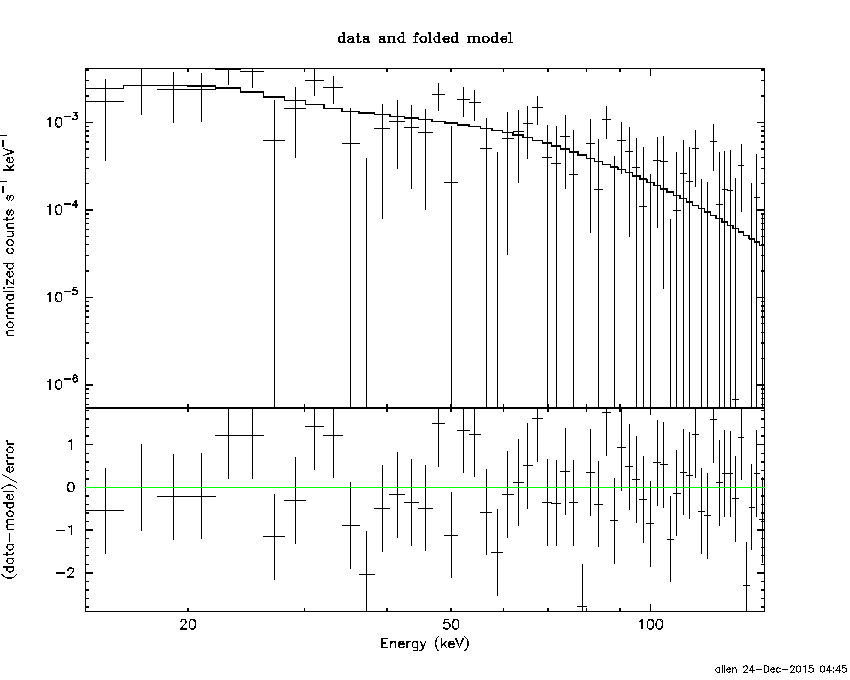
Time averaged spectrum fit using the average DRM
Power-law model
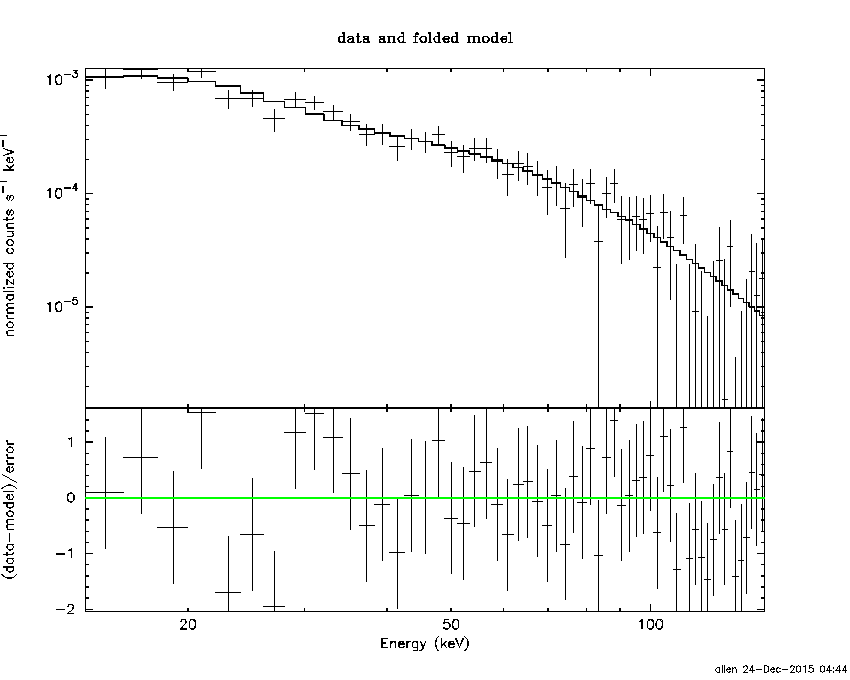
Time interval is from  -20.812 sec. to  104.980 sec.

Spectral model in power-law:
------------------------------------------------------------
Parameters  : value       lower 90%   higher 90%
Photon index: -1.83538     ( -0.122132   0.119303 )
Norm@50keV  : 1.64484E-03    ( -0.000115207   0.000113692 )
------------------------------------------------------------
#Fit statistic : Chi-Squared =          40.94 using 59 PHA bins.
# Reduced chi-squared =         0.7182 for     57 degrees of freedom
# Null hypothesis probability =   9.463526e-01

Photon flux (15-150 keV)    in 125.8 sec: 0.229852 ( -0.014024  0.014051 ) ph/cm2/s
Energy fluence (15-150 keV)             : 1.9034e-06 ( -1.33864e-07  1.35518e-07 ) ergs/cm2
Cutoff power-law model
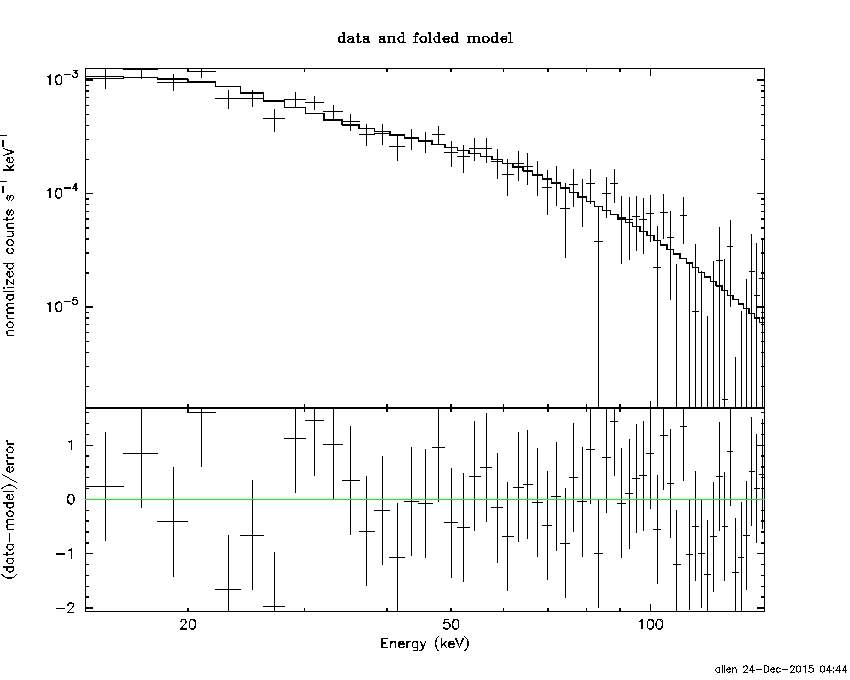
Time interval is from  -20.812 sec. to  104.980 sec.
Spectral model in the cutoff power-law:
------------------------------------------------------------
Parameters  : value       lower 90%   higher 90%
Photon index: -1.70508     ( -0.246069   0.469274 )
Epeak [keV] : 104.195      (   )
Norm@50keV  : 1.93049E-03    (     )
------------------------------------------------------------
#Fit statistic : Chi-Squared =          40.68 using 59 PHA bins.
# Reduced chi-squared =         0.7264 for     56 degrees of freedom
# Null hypothesis probability =   9.384025e-01

Photon flux (15-150 keV)    in 125.8 sec: 0.227982 ( -0.01527  0.015181 ) ph/cm2/s
Energy fluence (15-150 keV)             : 1.76109e-06 ( -1.77796e-07  1.37501e-07 ) ergs/cm2
1-s peak spectrum fit
Power-law model
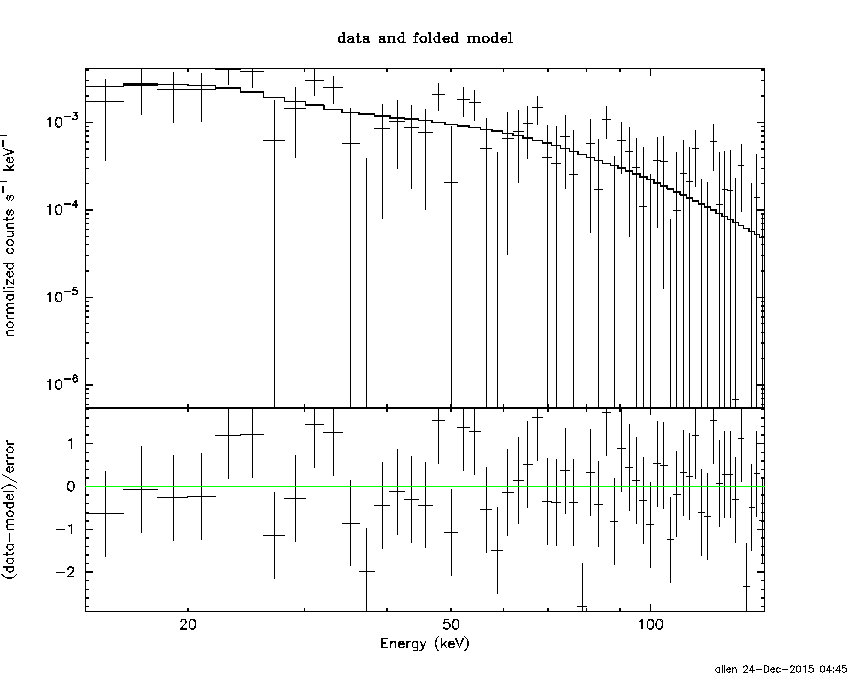
Time interval is from   11.268 sec. to   12.268 sec.

Spectral model in power-law:
------------------------------------------------------------
Parameters  : value       lower 90%   higher 90%
Photon index: -1.46054     ( -0.341095   0.335075 )
Norm@50keV  : 6.06180E-03    ( -0.00122674   0.00120385 )
------------------------------------------------------------
#Fit statistic : Chi-Squared =          55.40 using 59 PHA bins.
# Reduced chi-squared =         0.9719 for     57 degrees of freedom
# Null hypothesis probability =   5.353561e-01

Photon flux (15-150 keV)    in 1 sec: 0.749022 ( -0.142415  0.142488 ) ph/cm2/s
Energy fluence (15-150 keV)             : 5.79029e-08 ( -1.29032e-08  1.3261e-08 ) ergs/cm2
Cutoff power-law model
Time interval is from   11.268 sec. to   12.268 sec.
Spectral model in the cutoff power-law:
------------------------------------------------------------
Parameters  : value       lower 90%   higher 90%
Photon index: -1.25468     ( -1.39582   1.43315 )
Epeak [keV] : 171.420      ( -172.222 -172.222 )
Norm@50keV  : 7.80297E-03    ( -0.00779484   0.0364659 )
------------------------------------------------------------
#Fit statistic : Chi-Squared =          55.31 using 59 PHA bins.
# Reduced chi-squared =         0.9876 for     56 degrees of freedom
# Null hypothesis probability =   5.010487e-01

Photon flux (15-150 keV)    in 1 sec: 0.743026 ( -0.146573  0.146018 ) ph/cm2/s
Energy fluence (15-150 keV)             : 5.67336e-08 ( -1.45027e-08  1.41425e-08 ) ergs/cm2
Time-resolved spectra
Distribution
T90 vs. Hardness ratio plot
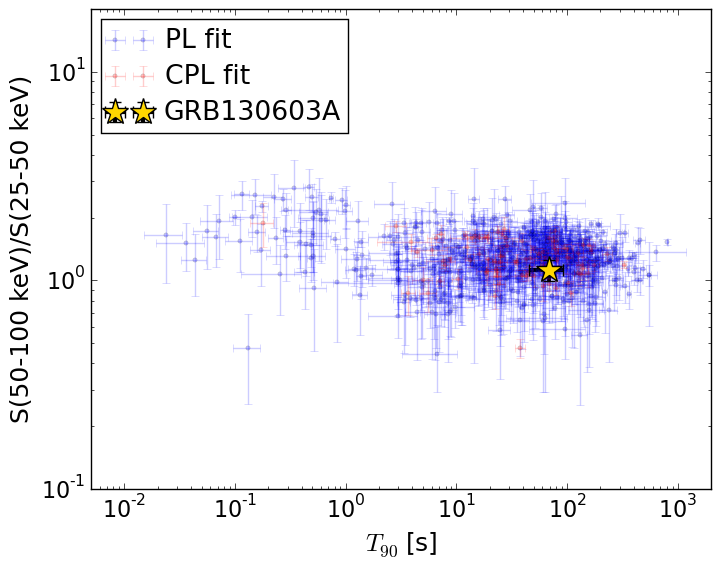
T90                                   = 69.128 sec.
Hardness ratio (energy fluence ratio) = 1.12090816916
S(15-50 keV) vs. S(50-150 keV) plot
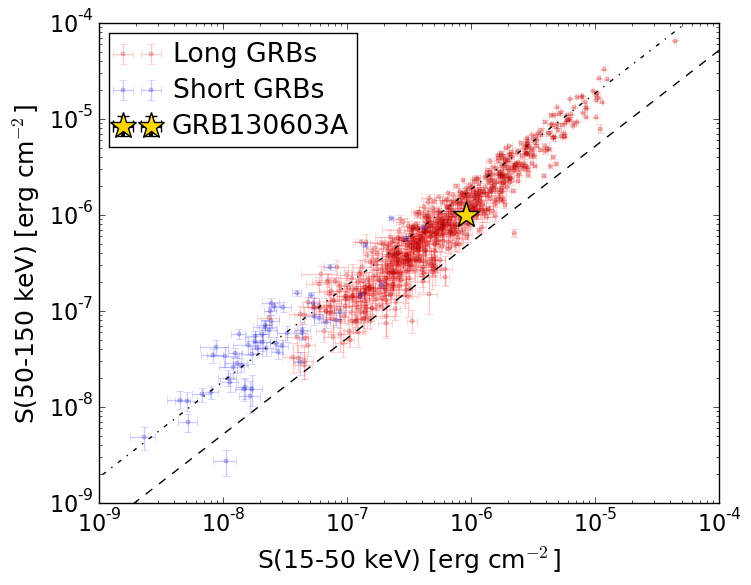
S(15-50 keV)  = 9.052488e-07
S(50-150 keV) = 9.981229e-07
The dash-dotted line and the dashed line traces the fluences calculated from the Band function with Epeak = 15 and 150 keV, respectively. Both lines assume a canonical values of alpha = -1 and beta = -2.5.
Mask shadow pattern
IMX = 3.129479552960023E-01, IMY = 1.271434766404723E-01
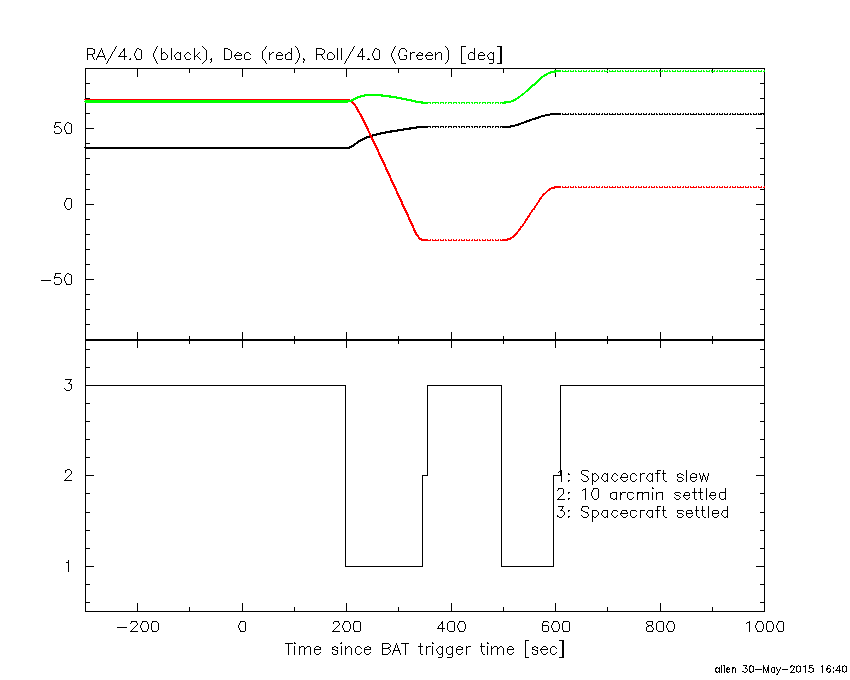
Spacecraft aspect plot
Bright source in the pre-burst/pre-slew/post-slew images
Pre-burst image of 15-350 keV band
Time interval of the image:
-590.195400 -572.305500
-239.296000 -20.812000

# RAcent  DECcent POSerr Theta    Phi  PeakCts   SNR AngSep     Name
#  [deg]    [deg]    ['] [deg]  [deg]                   [']
196.9250  37.2128    2.4  40.8  113.9   3.7648   4.8 ------	UNKNOWN
169.7399  61.6142    2.1  11.2  119.8   1.0585   5.7 ------	UNKNOWN
168.5712  61.8390    2.6  10.7  121.3   0.8967   4.7 ------	UNKNOWN
346.4959  83.0952    2.3  27.6   -6.5   1.0157   5.1 ------	UNKNOWN
111.7924  23.3483    2.6  51.0 -135.9   4.3694   4.4 ------	UNKNOWN
Pre-slew background subtracted image of 15-350 keV band
Time interval of the image:
-20.812000 104.980000

# RAcent  DECcent POSerr Theta    Phi  PeakCts   SNR AngSep     Name
#  [deg]    [deg]    ['] [deg]  [deg]                   [']
 86.9305  82.9109    0.5  18.7  -22.1   3.4582  21.9 ------	UNKNOWN
121.8799  59.1287    2.2  15.4 -118.7   0.7968   5.3 ------	UNKNOWN
Post-slew image of 15-350 keV band
Time interval of the image:
344.804590 496.904600

# RAcent  DECcent POSerr Theta    Phi  PeakCts   SNR AngSep     Name
#  [deg]    [deg]    ['] [deg]  [deg]                   [']
170.1432 -60.5149  173.0  43.8 -155.5  -0.0201  -0.1    8.2	Cen X-3
186.4523 -62.6909    5.8  40.8 -166.6   0.4822   2.0    7.4	GX 301-2
244.9570 -15.6270    1.2  38.6   86.1   7.6527   9.9    1.5	Sco X-1
235.8238  13.5614    2.0  48.1   43.0   4.8775   5.7 ------	UNKNOWN
227.9613   5.5757    2.4  37.1   41.2   1.5574   4.9 ------	UNKNOWN
223.5443 -62.8885    2.2  41.1  167.8   1.4637   5.2 ------	UNKNOWN
218.8327 -77.4069    3.1  54.1  176.9   2.4893   3.8 ------	UNKNOWN
141.9307 -70.7246    3.6  58.8 -159.3   3.2651   3.2 ------	UNKNOWN
159.5224 -24.0094    3.5  41.2  -99.2   2.8985   3.3 ------	UNKNOWN