Analysis Summary
Notes:
- 1) No attempt has been made to eliminate the non-significant decimal places.
- 2) This batgrbproduct analysis is done using the HEASARC data.
- 3) This batgrbproduct analysis is using the flight position for the mask-weighting calculation.
======================================================================
BAT GRB EVENT DATA PROCESSING REPORT
Process Script Ver: batgrbproduct v2.46
Process Start Time: Sun Jan 12 02:26:24 EST 2014
Host Name: batevent1
Current Working Dir: /local/data/batevent/batevent_reproc/trigger557310
======================================================================
Trigger: 00557310 Segment: 000
BAT Trigger Time: 391967364.768 [s; MET]
Trigger Stop: 391967364.8 [s; MET]
UTC: 2013-06-03T15:49:14.136600 [includes UTCF correction]
Where From?: (*SHORT BURST*) TDRSS scaled map message
BAT
RA: 172.20866268286 Dec: 17.0451158220811 [deg; J2000]
Catalogged Source?: NO
Point Source?: YES
GRB Indicated?: YES [ by BAT flight software ]
Image S/N Ratio: 17.27
Image Trigger?: NO
Rate S/N Ratio: 242.441745580253 [ if not an image trigger ]
Image S/N Ratio: 17.27
Analysis Position: [ source = BAT ]
RA: 172.20866268286 Dec: 17.0451158220811 [deg; J2000]
Refined Position: [ source = BAT pre-slew burst ]
RA: 172.221471892461 Dec: 17.0632338872491 [deg; J2000]
{ 11h 28m 53.2s , +17d 03' 47.6" }
+/- 0.717474690355698 [arcmin] (estimated 90% radius based on SNR)
+/- 0.237390618169689 [arcmin] (formal 1-sigma fit error)
SNR: 48.8774986204871
Angular difference between the analysis and refined position is 1.312105 arcmin
Partial Coding Fraction: 1 [ including projection effects ]
Duration
T90: 0.175999999046326 +/- 0.0240000486373901
Measured from: 0.0119999647140503
to: 0.187999963760376 [s; relative to TRIGTIME]
T50: 0.059999942779541 +/- 0.00400000810623169
Measured from: 0.0239999890327454
to: 0.0839999318122864 [s; relative to TRIGTIME]
Fluence
Peak Flux (peak 1 second)
Measured from: -0.364000022411346
to: 0.635999977588654 [s; relative to TRIGTIME]
Total Fluence
Measured from: 0.00800001621246338
to: 0.259999990463257 [s; relative to TRIGTIME]
Band 1 Band 2 Band 3 Band 4
15-25 25-50 50-100 100-350 keV
Total 0.132881 0.277126 0.307952 0.123182
0.006679 0.009147 0.010285 0.008639 [error]
Peak 0.140651 0.284678 0.309057 0.124159
0.008400 0.010336 0.011167 0.009387 [error]
[ fluence units of on-axis counts / fully illuminated detector ]
======================================================================
====== Table of the duration information =============================
Value tstart tstop
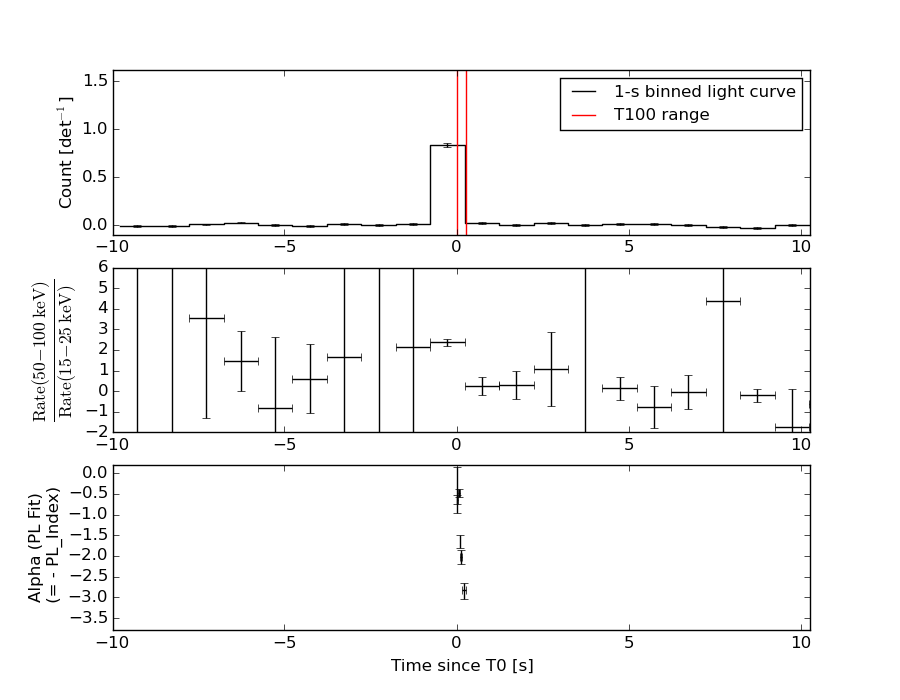
T100 0.252 0.008 0.260
T90 0.176 0.012 0.188
T50 0.060 0.024 0.084
Peak 1.000 -0.364 0.636
====== Spectral Analysis Summary =====================================
Model : spectral model: simple power-law (PL) and cutoff power-law (CPL)
Ph_index : photon index: E^{Ph_index}
Ph_90err : 90% error of the photon index
Epeak : Epeak in keV
Epeak_90err: 90% error of Epeak
Norm : normalization at 50 keV in both the PL model and CPL model
Nomr_90err : 90% error of the normalization
chi2 : Chi-Squared
dof : degree of freedo
=== Time-averaged spectral analysis ===
(Best model with acceptable fit: PL)
Model Ph_index Ph_90err_low Ph_90err_hi Epeak Epeak_90err_low Epeak_90err_hi Norm Nomr_90err_low Norm_90err_hi chi2 dof
PL -0.822 -0.065 0.066 - - - 2.15e-01 -7.81e-03 7.80e-03 58.800 57
CPL -0.750 -0.099 0.248 997.498 -997.498 -997.498 2.31e-01 -2.16e-02 6.54e-02 58.570 56
=== 1-s peak spectral analysis ===
(Best model with acceptable fit: PL)
Model Ph_index Ph_90err_low Ph_90err_hi Epeak Epeak_90err_low Epeak_90err_hi Norm Nomr_90err_low Norm_90err_hi chi2 dof
PL -0.853 -0.072 0.073 - - - 5.54e-02 -2.19e-03 2.19e-03 57.860 57
CPL -0.847 -0.072 0.074 9999.360 -9999.360 -9999.360 5.58e-02 -2.17e-03 1.60e-02 57.860 56
=== Fluence/Peak Flux Summary ===
Model Band1 Band2 Band3 Band4 Band5 Total
15-25 25-50 50-100 100-350 15-150 15-350 keV
Fluence PL 3.68e-08 1.03e-07 2.32e-07 1.40e-06 6.27e-07 1.78e-06 erg/cm2
90%_error_low -2.71e-09 -4.50e-09 -9.65e-09 -1.33e-07 -2.63e-08 -1.38e-07 erg/cm2
90%_error_hi 2.78e-09 4.47e-09 9.61e-09 1.42e-07 2.64e-08 1.47e-07 erg/cm2
Peak flux PL 1.23e+00 1.83e+00 2.02e+00 4.22e+00 6.36e+00 9.30e+00 ph/cm2/s
90%_error_low -1.03e-01 -9.17e-02 -8.75e-02 -3.99e-01 -2.50e-01 -4.44e-01 ph/cm2/s
90%_error_hi 1.06e-01 9.11e-02 8.71e-02 4.27e-01 2.51e-01 4.56e-01 ph/cm2/s
Fluence CPL 3.62e-08 1.03e-07 2.54e-07 1.33e-06 6.24e-07 1.64e-06 erg/cm2
90%_error_low -3.35e-09 -4.61e-09 -3.02e-08 -4.37e-07 -2.78e-08 -3.69e-07 erg/cm2
90%_error_hi 2.98e-09 4.87e-09 -8.46e-09 1.08e-07 2.77e-08 2.95e-07 erg/cm2
Peak flux CPL 1.23e+00 1.83e+00 2.02e+00 4.21e+00 6.36e+00 9.28e+00 ph/cm2/s
90%_error_low -1.32e-01 -9.28e-02 -8.72e-02 -1.09e+00 -2.51e-01 -1.07e+00 ph/cm2/s
90%_error_hi 1.06e-01 7.51e-02 1.04e-01 4.18e-01 2.50e-01 4.18e-01 ph/cm2/s
======================================================================
Image
Pre-slew 15.0-350.0 keV image (Event data)

#   RAcent    DECcent   POSerr    Theta     Phi              Peak Cts       SNR   Name
  172.2215    17.0632   0.0040    10.6879   152.0417         0.8602893     48.877 TRIG_00557310

Foreground time interval of the image:
  0.008   0.260 (delta_t =   0.252 [sec])
Background time interval of the image:
-239.768   0.008 (delta_t = 239.776 [sec])
Light Curves
Note: The mask-weighted lightcurves have units of either count/det or counts/sec/det, where a det is 0.4 x 0.4 = 0.16 sq cm.
Full-time range; 1 s binning
Other quick-look light curves:
- 64 ms binning (zoomed)
- 16 ms binning (zoomed)
- 8 ms binning (zoomed)
- 2 ms binning (zoomed)
- SN=5 or 10 s binning (full-time range)
- Raw light curve
Spectra
- 64 ms binning (zoomed)
- 16 ms binning (zoomed)
- 8 ms binning (zoomed)
- 2 ms binning (zoomed)
- SN=5 or 10 s binning (full-time range)
- Raw light curve
Spectra
Notes:
- 1) The fitting includes the systematic errors.
- 2) When the burst includes telescope slew time periods, the fitting uses an average response file made from multiple 5-s response files through out the slew time plus single time preiod for the non-slew times, and weighted by the total counts in the corresponding time period using addrmf. An average response file is needed becuase a spectral fit using the pre-slew DRM will introduce some errors in both a spectral shape and a normalization if the PHA file contains a lot of the slew/post-slew time interval.
- 3) For fits to more complicated models (e.g. a power-law over a cutoff power-law), the BAT team has decided to require a chi-square improvement of more than 6 for each extra dof.
Time averaged spectrum fit using the average DRM
Power-law model
Time interval is from    0.008 sec. to    0.260 sec.

Spectral model in power-law:
------------------------------------------------------------
Parameters  : value       lower 90%   higher 90%
Photon index: -0.82213     ( -0.0652556   0.065733 )
Norm@50keV  : 0.214760    ( -0.00780902   0.00779875 )
------------------------------------------------------------
#Fit statistic : Chi-Squared =          58.80 using 59 PHA bins.
# Reduced chi-squared =          1.032 for     57 degrees of freedom
# Null hypothesis probability =   4.092510e-01

Photon flux (15-150 keV)    in 0.252 sec: 24.6658 ( -0.8911  0.8912 ) ph/cm2/s
Energy fluence (15-150 keV)             : 6.26686e-07 ( -2.63418e-08  2.64451e-08 ) ergs/cm2
Cutoff power-law model
Time interval is from    0.008 sec. to    0.260 sec.
Spectral model in the cutoff power-law:
------------------------------------------------------------
Parameters  : value       lower 90%   higher 90%
Photon index: -0.75039     ( -0.0989092   0.248112 )
Epeak [keV] : 997.498      ( -998.36 -998.36 )
Norm@50keV  : 0.231323    ( -0.0215412   0.0654065 )
------------------------------------------------------------
#Fit statistic : Chi-Squared =          58.57 using 59 PHA bins.
# Reduced chi-squared =          1.046 for     56 degrees of freedom
# Null hypothesis probability =   3.814122e-01

Photon flux (15-150 keV)    in 0.252 sec: 24.6021 ( -0.9155  0.9136 ) ph/cm2/s
Energy fluence (15-150 keV)             : 6.24108e-07 ( -2.78004e-08  2.7746e-08 ) ergs/cm2
1-s peak spectrum fit
Power-law model

Time interval is from   -0.364 sec. to    0.636 sec.

Spectral model in power-law:
------------------------------------------------------------
Parameters  : value       lower 90%   higher 90%
Photon index: -0.852985     ( -0.0719528   0.072621 )
Norm@50keV  : 5.54337E-02    ( -0.00219363   0.00218883 )
------------------------------------------------------------
#Fit statistic : Chi-Squared =          57.86 using 59 PHA bins.
# Reduced chi-squared =          1.015 for     57 degrees of freedom
# Null hypothesis probability =   4.434230e-01

Photon flux (15-150 keV)    in 1 sec: 6.36302 ( -0.25046  0.25058 ) ph/cm2/s
Energy fluence (15-150 keV)             : 6.3387e-07 ( -2.83758e-08  2.84838e-08 ) ergs/cm2
Cutoff power-law model
Time interval is from   -0.364 sec. to    0.636 sec.
Spectral model in the cutoff power-law:
------------------------------------------------------------
Parameters  : value       lower 90%   higher 90%
Photon index: -0.847217     ( -0.0719322   0.0737469 )
Epeak [keV] : 9999.36      ( -9999.36 -9999.36 )
Norm@50keV  : 5.58127E-02    ( -0.00217249   0.0159567 )
------------------------------------------------------------
#Fit statistic : Chi-Squared =          57.86 using 59 PHA bins.
# Reduced chi-squared =          1.033 for     56 degrees of freedom
# Null hypothesis probability =   4.062690e-01

Photon flux (15-150 keV)    in 1 sec: 6.36296 ( -0.25147  0.24975 ) ph/cm2/s
Energy fluence (15-150 keV)             : 6.3403e-07 ( -2.76708e-08  2.86288e-08 ) ergs/cm2
Time-resolved spectra
Distribution
T90 vs. Hardness ratio plot
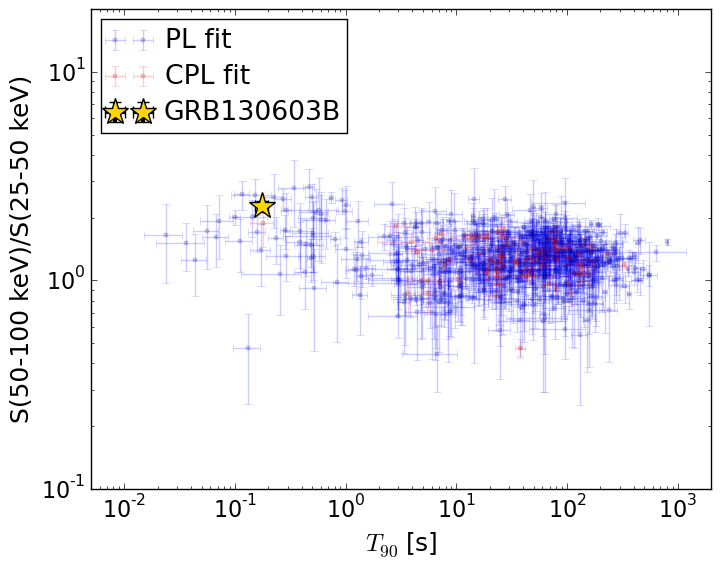
T90                                   = 0.176 sec.
Hardness ratio (energy fluence ratio) = 2.26245440186
S(15-50 keV) vs. S(50-150 keV) plot
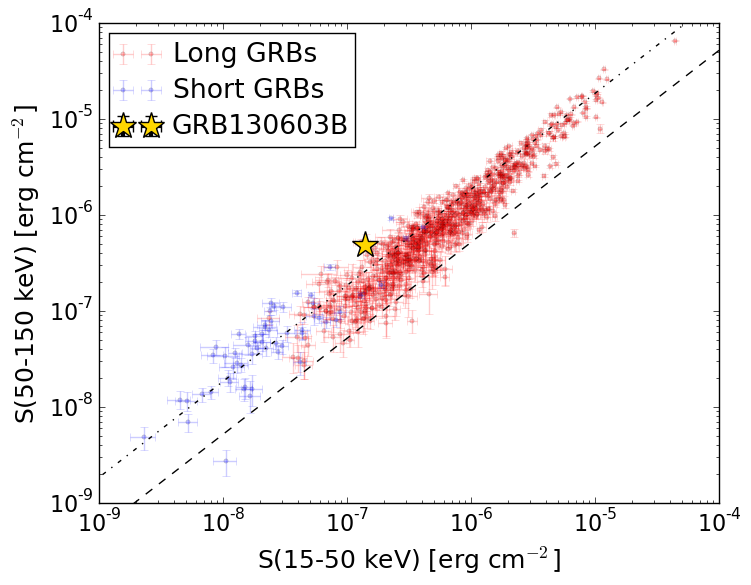
S(15-50 keV)  = 1.3946882e-07
S(50-150 keV) = 4.872215e-07
The dash-dotted line and the dashed line traces the fluences calculated from the Band function with Epeak = 15 and 150 keV, respectively. Both lines assume a canonical values of alpha = -1 and beta = -2.5.
Mask shadow pattern
IMX = -1.667061113585569E-01, IMY = -8.848377010167226E-02
Spacecraft aspect plot
Bright source in the pre-burst/pre-slew/post-slew images
Pre-burst image of 15-350 keV band
Time interval of the image:
-239.768000 0.008000

# RAcent  DECcent POSerr Theta    Phi  PeakCts   SNR AngSep     Name
#  [deg]    [deg]    ['] [deg]  [deg]                   [']
237.3272  51.9437    2.3  52.8   11.3   3.9599   4.9 ------	UNKNOWN
188.1594  31.5097    2.8  13.6   37.3   0.8190   4.1 ------	UNKNOWN
125.0828   7.3626    3.2  49.8 -137.6   2.9470   3.6 ------	UNKNOWN
136.1929  74.9418    4.5  50.7  -44.5   2.9778   2.6 ------	UNKNOWN
123.2475   8.5931    2.8  50.7 -135.1   4.3339   4.2 ------	UNKNOWN
Pre-slew background subtracted image of 15-350 keV band
Time interval of the image:
0.008000 0.260000

# RAcent  DECcent POSerr Theta    Phi  PeakCts   SNR AngSep     Name
#  [deg]    [deg]    ['] [deg]  [deg]                   [']
172.2215  17.0632    0.2  10.7  152.0   0.8603  48.9 ------	UNKNOWN
Post-slew image of 15-350 keV band
Time interval of the image:
42.532590 785.632600

# RAcent  DECcent POSerr Theta    Phi  PeakCts   SNR AngSep     Name
#  [deg]    [deg]    ['] [deg]  [deg]                   [']
185.2934  23.0536    3.0  13.7   37.7   1.8985   3.8 ------	UNKNOWN
203.4626  47.3707    3.0  39.7    9.2   3.0794   3.9 ------	UNKNOWN
181.0740  20.7589    3.4   9.2   40.6   1.6812   3.4 ------	UNKNOWN
180.7796  38.6141    2.9  22.8   -6.7   2.0440   3.9 ------	UNKNOWN
162.1907   9.9935    2.9  12.0 -149.0   1.9194   3.9 ------	UNKNOWN
143.6604  18.0066    3.3  27.2 -107.9   2.1836   3.5 ------	UNKNOWN
130.3306 -25.2558    4.5  58.8 -159.3  10.3648   2.5 ------	UNKNOWN