Analysis Summary
Notes:
- 1) No attempt has been made to eliminate the non-significant decimal places.
- 2) This batgrbproduct analysis is done using the HEASARC data.
- 3) This batgrbproduct analysis is using the flight position for the mask-weighting calculation.
======================================================================
BAT GRB EVENT DATA PROCESSING REPORT
Process Script Ver: batgrbproduct v2.46
Process Start Time: Sun Jan 12 02:18:33 EST 2014
Host Name: batevent1
Current Working Dir: /local/data/batevent/batevent_reproc/trigger557354
======================================================================
Trigger: 00557354 Segment: 000
BAT Trigger Time: 392021677.632 [s; MET]
Trigger Stop: 392021681.728 [s; MET]
UTC: 2013-06-04T06:54:26.998160 [includes UTCF correction]
Where From?: TDRSS position message
BAT
RA: 250.080442177307 Dec: 68.2100394725204 [deg; J2000]
Catalogged Source?: NO
Point Source?: YES
GRB Indicated?: YES [ by BAT flight software ]
Image S/N Ratio: 7.99
Image Trigger?: NO
Rate S/N Ratio: 12.369316876853 [ if not an image trigger ]
Image S/N Ratio: 7.99
Analysis Position: [ source = BAT ]
RA: 250.080442177307 Dec: 68.2100394725204 [deg; J2000]
Refined Position: [ source = BAT pre-slew burst ]
RA: 250.166094294742 Dec: 68.224703294494 [deg; J2000]
{ 16h 40m 39.9s , +68d 13' 28.9" }
+/- 1.11626650385319 [arcmin] (estimated 90% radius based on SNR)
+/- 0.499931470338852 [arcmin] (formal 1-sigma fit error)
SNR: 25.9943243081518
Angular difference between the analysis and refined position is 2.100232 arcmin
Partial Coding Fraction: 0.8125 [ including projection effects ]
Duration
T90: 76.2839999198914 +/- 29.7594602090569
Measured from: 1.43999999761581
to: 77.7239999175072 [s; relative to TRIGTIME]
T50: 22.3879999518394 +/- 4.0223793880458
Measured from: 8.74399995803833
to: 31.1319999098778 [s; relative to TRIGTIME]
Fluence
Peak Flux (peak 1 second)
Measured from: 14.3919999599457
to: 15.3919999599457 [s; relative to TRIGTIME]
Total Fluence
Measured from: -0.444000005722046
to: 95.7679999470711 [s; relative to TRIGTIME]
Band 1 Band 2 Band 3 Band 4
15-25 25-50 50-100 100-350 keV
Total 0.797853 0.965488 0.605254 0.150162
0.063199 0.064999 0.057662 0.051240 [error]
Peak 0.018830 0.040178 0.022490 0.017232
0.007328 0.007340 0.006754 0.005644 [error]
[ fluence units of on-axis counts / fully illuminated detector ]
======================================================================
====== Table of the duration information =============================
Value tstart tstop
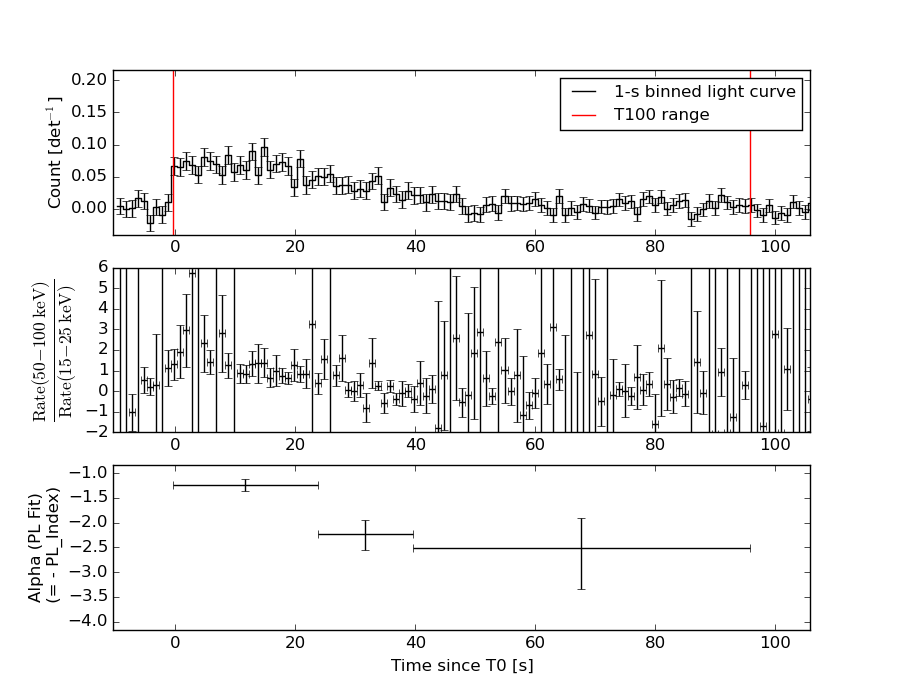
T100 96.212 -0.444 95.768
T90 76.284 1.440 77.724
T50 22.388 8.744 31.132
Peak 1.000 14.392 15.392
====== Spectral Analysis Summary =====================================
Model : spectral model: simple power-law (PL) and cutoff power-law (CPL)
Ph_index : photon index: E^{Ph_index}
Ph_90err : 90% error of the photon index
Epeak : Epeak in keV
Epeak_90err: 90% error of Epeak
Norm : normalization at 50 keV in both the PL model and CPL model
Nomr_90err : 90% error of the normalization
chi2 : Chi-Squared
dof : degree of freedo
=== Time-averaged spectral analysis ===
(Best model with acceptable fit: PL)
Model Ph_index Ph_90err_low Ph_90err_hi Epeak Epeak_90err_low Epeak_90err_hi Norm Nomr_90err_low Norm_90err_hi chi2 dof
PL -1.628 -0.145 0.143 - - - 1.72e-03 -1.39e-04 1.38e-04 56.410 57
CPL -1.635 -0.138 0.154 9999.360 -9999.350 -9999.360 1.71e-03 -8.98e-04 -5.91e-04 56.440 56
=== 1-s peak spectral analysis ===
(Best model with acceptable fit: PL)
Model Ph_index Ph_90err_low Ph_90err_hi Epeak Epeak_90err_low Epeak_90err_hi Norm Nomr_90err_low Norm_90err_hi chi2 dof
PL -1.318 -0.410 0.427 - - - 6.40e-03 -1.44e-03 1.43e-03 58.410 57
CPL -1.325 -0.402 0.440 9999.360 -9999.360 -9999.360 6.42e-03 N/A N/A 58.420 56
=== Fluence/Peak Flux Summary ===
Model Band1 Band2 Band3 Band4 Band5 Total
15-25 25-50 50-100 100-350 15-150 15-350 keV
Fluence PL 2.38e-07 4.05e-07 5.24e-07 1.37e-06 1.54e-06 2.53e-06 erg/cm2
90%_error_low -3.04e-08 -3.14e-08 -5.78e-08 -2.98e-07 -1.34e-07 -3.49e-07 erg/cm2
90%_error_hi 3.14e-08 3.13e-08 5.77e-08 3.52e-07 1.35e-07 3.92e-07 erg/cm2
Peak flux PL 2.21e-01 2.48e-01 1.99e-01 2.65e-01 7.66e-01 9.34e-01 ph/cm2/s
90%_error_low -8.94e-02 -6.52e-02 -5.50e-02 -1.27e-01 -1.76e-01 -2.15e-01 ph/cm2/s
90%_error_hi 9.97e-02 6.26e-02 5.35e-02 1.91e-01 1.77e-01 2.21e-01 ph/cm2/s
Fluence CPL 2.42e-07 3.99e-07 5.20e-07 1.49e-06 1.57e-06 2.52e-06 erg/cm2
90%_error_low -3.46e-08 -2.50e-08 -5.45e-08 -6.46e-07 -1.63e-07 -5.01e-07 erg/cm2
90%_error_hi 2.73e-08 3.81e-08 6.10e-08 1.01e-07 1.06e-07 3.84e-07 erg/cm2
Peak flux CPL 2.22e-01 2.45e-01 1.97e-01 3.20e-01 7.68e-01 9.40e-01 ph/cm2/s
90%_error_low N/A -7.06e-02 -5.37e-02 N/A -1.71e-01 -2.79e-01 ph/cm2/s
90%_error_hi N/A 7.57e-02 5.57e-02 N/A 1.76e-01 2.14e-01 ph/cm2/s
======================================================================
Image
Pre-slew 15.0-350.0 keV image (Event data)
#   RAcent    DECcent   POSerr    Theta     Phi              Peak Cts       SNR   Name
  250.1661    68.2247   0.0074    30.8365  -168.0504         2.2375506     25.994 TRIG_00557354

Foreground time interval of the image:
 -0.444  36.469 (delta_t =  36.913 [sec])
Background time interval of the image:
-330.931 -315.946 (delta_t =  14.986 [sec])
-239.632  -0.444 (delta_t = 239.188 [sec])
Light Curves
Note: The mask-weighted lightcurves have units of either count/det or counts/sec/det, where a det is 0.4 x 0.4 = 0.16 sq cm.
Full-time range; 1 s binning
Other quick-look light curves:
- 64 ms binning (zoomed)
- 16 ms binning (zoomed)
- 8 ms binning (zoomed)
- 2 ms binning (zoomed)
- SN=5 or 10 s binning (full-time range)
- Raw light curve
Spectra
- 64 ms binning (zoomed)
- 16 ms binning (zoomed)
- 8 ms binning (zoomed)
- 2 ms binning (zoomed)
- SN=5 or 10 s binning (full-time range)
- Raw light curve
Spectra
Notes:
- 1) The fitting includes the systematic errors.
- 2) When the burst includes telescope slew time periods, the fitting uses an average response file made from multiple 5-s response files through out the slew time plus single time preiod for the non-slew times, and weighted by the total counts in the corresponding time period using addrmf. An average response file is needed becuase a spectral fit using the pre-slew DRM will introduce some errors in both a spectral shape and a normalization if the PHA file contains a lot of the slew/post-slew time interval.
- 3) For fits to more complicated models (e.g. a power-law over a cutoff power-law), the BAT team has decided to require a chi-square improvement of more than 6 for each extra dof.
Time averaged spectrum fit using the average DRM
Power-law model

Time interval is from   -0.444 sec. to   95.768 sec.

Spectral model in power-law:
------------------------------------------------------------
Parameters  : value       lower 90%   higher 90%
Photon index: -1.62848     ( -0.144571   0.142904 )
Norm@50keV  : 1.71904E-03    ( -0.000139227   0.000137782 )
------------------------------------------------------------
#Fit statistic : Chi-Squared =          56.41 using 59 PHA bins.
# Reduced chi-squared =         0.9896 for     57 degrees of freedom
# Null hypothesis probability =   4.973221e-01

Photon flux (15-150 keV)    in 96.21 sec: 0.222905 ( -0.017152  0.017191 ) ph/cm2/s
Energy fluence (15-150 keV)             : 1.54188e-06 ( -1.33921e-07  1.3534e-07 ) ergs/cm2
Cutoff power-law model
Time interval is from   -0.444 sec. to   95.768 sec.
Spectral model in the cutoff power-law:
------------------------------------------------------------
Parameters  : value       lower 90%   higher 90%
Photon index: -2.12844     ( -0.138374   0.153514 )
Epeak [keV] : 50.0426      ( -9999.35 -9999.36 )
Norm@50keV  : 9.25714E-04    ( -0.000110235   0.000197258 )
------------------------------------------------------------
#Fit statistic : Chi-Squared =          53.86 using 59 PHA bins.
# Reduced chi-squared =         0.9619 for     56 degrees of freedom
# Null hypothesis probability =   5.561166e-01

Photon flux (15-150 keV)    in 96.21 sec: 0.222899 ( -0.017174  0.017173 ) ph/cm2/s
Energy fluence (15-150 keV)             : 1.57072e-06 ( -1.63218e-07  1.05995e-07 ) ergs/cm2
1-s peak spectrum fit
Power-law model

Time interval is from   14.392 sec. to   15.392 sec.

Spectral model in power-law:
------------------------------------------------------------
Parameters  : value       lower 90%   higher 90%
Photon index: -1.31784     ( -0.409536   0.427064 )
Norm@50keV  : 6.40191E-03    ( -0.00143698   0.00143343 )
------------------------------------------------------------
#Fit statistic : Chi-Squared =          58.41 using 59 PHA bins.
# Reduced chi-squared =          1.025 for     57 degrees of freedom
# Null hypothesis probability =   4.233681e-01

Photon flux (15-150 keV)    in 1 sec: 0.766341 ( -0.176313  0.176994 ) ph/cm2/s
Energy fluence (15-150 keV)             : 6.29985e-08 ( -1.56877e-08  1.59602e-08 ) ergs/cm2
Cutoff power-law model
Time interval is from   14.392 sec. to   15.392 sec.
Spectral model in the cutoff power-law:
------------------------------------------------------------
Parameters  : value       lower 90%   higher 90%
Photon index: -1.32496     ( -0.402516   0.439052 )
Epeak [keV] : 9999.36      ( -9999.36 -9999.36 )
Norm@50keV  : 6.42261E-03    (     )
------------------------------------------------------------
#Fit statistic : Chi-Squared =          58.42 using 59 PHA bins.
# Reduced chi-squared =          1.043 for     56 degrees of freedom
# Null hypothesis probability =   3.866569e-01

Photon flux (15-150 keV)    in 1 sec: 0.768335 ( -0.17073  0.176037 ) ph/cm2/s
Energy fluence (15-150 keV)             : 6.29492e-08 ( 0  0 ) ergs/cm2
Time-resolved spectra
Distribution
T90 vs. Hardness ratio plot
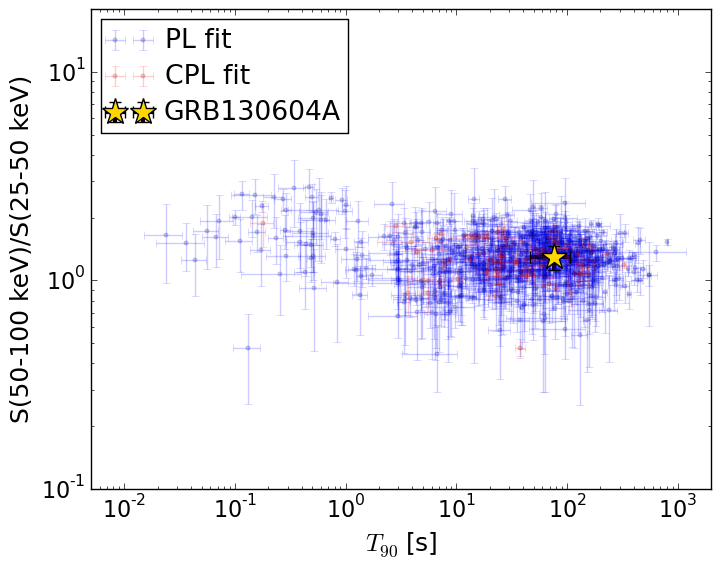
T90                                   = 76.284 sec.
Hardness ratio (energy fluence ratio) = 1.2937192786
S(15-50 keV) vs. S(50-150 keV) plot
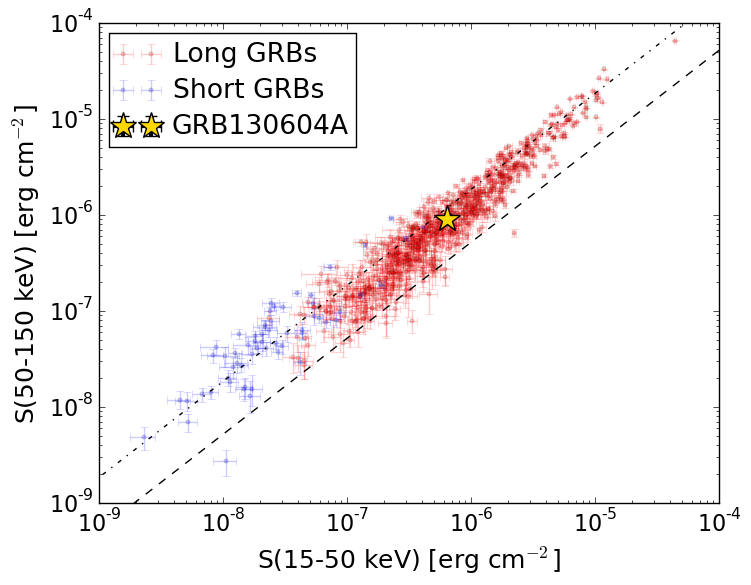
S(15-50 keV)  = 6.430982e-07
S(50-150 keV) = 8.98767e-07
The dash-dotted line and the dashed line traces the fluences calculated from the Band function with Epeak = 15 and 150 keV, respectively. Both lines assume a canonical values of alpha = -1 and beta = -2.5.
Mask shadow pattern

IMX = -5.840468575128441E-01, IMY = 1.236059627389259E-01
Spacecraft aspect plot
Bright source in the pre-burst/pre-slew/post-slew images
Pre-burst image of 15-350 keV band
Time interval of the image:
-330.931340 -315.945500
-239.632000 -0.444000

# RAcent  DECcent POSerr Theta    Phi  PeakCts   SNR AngSep     Name
#  [deg]    [deg]    ['] [deg]  [deg]                   [']
254.6033  35.4564    4.8  40.7  136.4   1.4890   2.4    9.9	Her X-1
299.6290  35.2064    1.7  18.3   70.9   1.7270   6.7    1.9	Cyg X-1
308.0904  40.9532    1.0  11.6   48.0   2.7311  11.7    0.9	Cyg X-3
326.1694  38.3489    7.3  19.1    0.2   0.3194   1.6    1.6	Cyg X-2
278.1197  48.4392    2.2  19.1  138.9   1.1697   5.3 ------	UNKNOWN
351.1074  42.2062    2.9  30.6  -38.3   1.0776   3.9 ------	UNKNOWN
179.5616  74.9184    2.4  48.0 -146.4   2.5340   4.8 ------	UNKNOWN
Pre-slew background subtracted image of 15-350 keV band
Time interval of the image:
-0.444000 36.468590

# RAcent  DECcent POSerr Theta    Phi  PeakCts   SNR AngSep     Name
#  [deg]    [deg]    ['] [deg]  [deg]                   [']
254.3079  35.2292    0.0  41.0  136.4   0.5892   2.5   10.0	Her X-1
299.6766  35.3340    3.3  18.2   70.9  -0.3213  -3.5    9.0	Cyg X-1
308.0717  41.0419    5.8  11.5   48.0  -0.1586  -2.0    5.6	Cyg X-3
325.9866  38.4012   21.5  19.0    0.5  -0.0427  -0.5    9.9	Cyg X-2
219.7454  60.3890    2.2  45.5 -174.3   0.7381   5.2 ------	UNKNOWN
250.1662  68.2247    0.4  30.8 -168.1   2.2372  26.0 ------	UNKNOWN
352.7754  26.7998    2.5  42.2  -20.7   0.5280   4.6 ------	UNKNOWN
Post-slew image of 15-350 keV band
Time interval of the image:
88.468600 238.460700
239.368000 450.568620

# RAcent  DECcent POSerr Theta    Phi  PeakCts   SNR AngSep     Name
#  [deg]    [deg]    ['] [deg]  [deg]                   [']
254.6122  35.3444    5.9  33.0   85.6   1.1820   1.9    7.6	Her X-1
299.6877  35.1268    6.6  43.0   26.5   0.9544   1.8    6.6	Cyg X-1
308.1110  40.9460    1.4  40.8   13.7   3.6155   8.2    0.4	Cyg X-3
326.0442  38.3572    7.4  49.7   -1.6   0.8394   1.6    6.4	Cyg X-2
176.4744  32.3259    4.5  54.2 -179.2   2.7179   2.6 ------	UNKNOWN
140.5822  50.7846    2.9  50.1 -138.5   4.8375   4.0 ------	UNKNOWN
 23.8928  62.8774    3.1  44.8  -59.8   4.9401   3.8 ------	UNKNOWN
 71.4606  70.9739    3.8  40.8  -88.3   4.2438   3.1 ------	UNKNOWN