Analysis Summary
Notes:
- 1) No attempt has been made to eliminate the non-significant decimal places.
- 2) This batgrbproduct analysis is done using the HEASARC data.
- 3) This batgrbproduct analysis is using the flight position for the mask-weighting calculation.
======================================================================
                  BAT GRB EVENT DATA PROCESSING REPORT
    Process Script Ver: batgrbproduct v2.46
    Process Start Time: Sun Jan 12 01:56:59 EST 2014
             Host Name: batevent1
   Current Working Dir: /local/data/batevent/batevent_reproc/trigger557771
======================================================================

  Trigger: 00557771      Segment: 000

  BAT Trigger Time: 392426072   [s; MET]
      Trigger Stop: 392426136   [s; MET]
               UTC: 2013-06-08T23:14:21.348120    [includes UTCF correction]
       Where From?: TDRSS position message

  BAT
    RA: 24.5798859527311   Dec: 41.4938034558663  [deg; J2000]

     Catalogged Source?: NO
     Point Source?:      YES
     GRB Indicated?:     YES    [ by BAT flight software ]
     Image S/N Ratio:    9.45
     Image Trigger?:     YES
     Rate S/N Ratio:     0  [ if not an image trigger ]
     Image S/N Ratio:    9.45

  Analysis Position:   [ source = BAT ]
    RA: 24.5798859527311   Dec: 41.4938034558663  [deg; J2000]

  Refined Position:   [ source = BAT pre-slew burst ]
    RA: 24.59737320483   Dec: 41.4913200292832  [deg; J2000]
        { 01h 38m 23.4s , +41d 29' 28.8" }
         +/- 2.54258014483757 [arcmin] (estimated 90% radius based on SNR)
         +/- 1.55481604375909 [arcmin] (formal 1-sigma fit error)
    SNR: 8.01963481432925

  Angular difference between the analysis and refined position is 0.799921 arcmin

  Partial Coding Fraction: 0.4570312    [ including projection effects ]

  Duration
     T90: 151.851999938488 +/- 10.611898224209
        Measured from: -132.15600001812
                   to: 19.6959999203682     [s; relative to TRIGTIME]
     T50: 79.8439999222755 +/- 59.5630116045272
        Measured from: -71.6480000019073
                   to: 8.19599992036819     [s; relative to TRIGTIME]


  Fluence
     Peak Flux  (peak 1 second)
        Measured from: 19.055999994278
                   to: 20.055999994278     [s; relative to TRIGTIME]
     Total Fluence
        Measured from: -135.195999979973
                   to: 21.727999985218     [s; relative to TRIGTIME]

             Band 1     Band 2     Band 3     Band 4
              15-25      25-50     50-100    100-350     keV
 Total     0.966609   0.542989   0.379777  -0.092155
           0.106471   0.110087   0.098584   0.092962 [error]
 Peak      0.034962   0.018632   0.012795   0.006233
           0.009659   0.009744   0.008544   0.008256 [error]

     [ fluence units of on-axis counts / fully illuminated detector ]

======================================================================


====== Table of the duration information =============================

        Value   tstart    tstop
T100  156.924 -135.196   21.728
T90   151.852 -132.156   19.696
T50    79.844  -71.648    8.196
Peak    1.000   19.056   20.056


====== Spectral Analysis Summary =====================================

Model      : spectral model: simple power-law (PL) and cutoff power-law (CPL)
Ph_index   : photon index: E^{Ph_index}
Ph_90err   : 90% error of the photon index
Epeak      : Epeak in keV
Epeak_90err: 90% error of Epeak
Norm       : normalization at 50 keV in both the PL model and CPL model
Nomr_90err : 90% error of the normalization
chi2       : Chi-Squared
dof        : degree of freedo

=== Time-averaged spectral analysis ===
(Best model with acceptable fit: PL)

Model Ph_index Ph_90err_low Ph_90err_hi  Epeak  Epeak_90err_low  Epeak_90err_hi  Norm       Nomr_90err_low    Norm_90err_hi    chi2    dof
PL      -2.624    -0.425      0.360       -           -               -         5.47e-04     -1.68e-04          1.70e-04      54.700   57
CPL     -1.934     N/A        N/A           3.401      N/A           N/A         1.50e-03        N/A               N/A         54.960   56


=== 1-s peak spectral analysis ===
(Best model with acceptable fit: N/A)

Model Ph_index Ph_90err_low Ph_90err_hi  Epeak  Epeak_90err_low  Epeak_90err_hi  Norm       Nomr_90err_low    Norm_90err_hi    chi2    dof
PL      -2.319     -1.108     0.795       -           -               -         3.40e-03     -2.21e-03          2.17e-03      69.760   57
CPL     -1.928      N/A       N/A           6.750      N/A           N/A         6.00e-03        N/A               N/A         69.700   56


=== Fluence/Peak Flux Summary ===

              Model    Band1     Band2     Band3     Band4     Band5     Total
                       15-25     25-50    50-100    100-350    15-150    15-350    keV
Fluence         PL   3.19e-07  2.98e-07  1.93e-07  1.94e-07  8.90e-07  1.00e-06   erg/cm2
      90%_error_low -5.93e-08 -6.16e-08 -7.52e-08 -1.12e-07 -1.84e-07 -2.47e-07   erg/cm2
      90%_error_hi   5.97e-08  5.85e-08  8.68e-08  1.91e-07  1.96e-07  3.08e-07   erg/cm2
Peak flux       PL   3.09e-01  1.93e-01  7.72e-02  4.18e-02  6.00e-01  6.21e-01   ph/cm2/s
      90%_error_low -1.60e-01 -9.27e-02 -5.70e-02 -4.18e-02 -2.55e-01 -2.67e-01   ph/cm2/s
      90%_error_hi   1.68e-01  8.67e-02  7.04e-02  1.03e-01  2.56e-01  2.70e-01   ph/cm2/s

Fluence        CPL   3.16e-07  3.10e-07  2.03e-07  1.95e-07  8.78e-07  1.01e-06   erg/cm2
      90%_error_low -7.70e-08 -1.03e-07 -8.53e-08 -8.67e-08 -1.11e-07 -2.46e-07   erg/cm2
      90%_error_hi   8.30e-08  4.51e-08  7.83e-08  9.94e-07  2.25e-07  3.63e-07   erg/cm2
Peak flux      CPL   3.05e-01  2.02e-01  7.41e-02  2.17e-02  5.96e-01  6.03e-01   ph/cm2/s
      90%_error_low     N/A       N/A   -7.41e-02 -2.17e-02 -2.53e-01     N/A     ph/cm2/s
      90%_error_hi      N/A       N/A    7.54e-02  1.00e-01  2.54e-01     N/A     ph/cm2/s

======================================================================
Image
Pre-slew 15.0-350.0 keV image (Event data)
#   RAcent    DECcent   POSerr    Theta     Phi              Peak Cts       SNR   Name
   24.5974    41.4913   0.0241    41.1765  -147.9737         1.4603147      8.020 TRIG_00557771

Foreground time interval of the image:
-75.299  21.728 (delta_t =  97.027 [sec])
Background time interval of the image:
Light Curves
Note: The mask-weighted lightcurves have units of either count/det or counts/sec/det, where a det is 0.4 x 0.4 = 0.16 sq cm.
Full-time range; 1 s binning
Other quick-look light curves:
- 64 ms binning (zoomed)
- 16 ms binning (zoomed)
- 8 ms binning (zoomed)
- 2 ms binning (zoomed)
- SN=5 or 10 s binning (full-time range)
- Raw light curve
Spectra
- 64 ms binning (zoomed)
- 16 ms binning (zoomed)
- 8 ms binning (zoomed)
- 2 ms binning (zoomed)
- SN=5 or 10 s binning (full-time range)
- Raw light curve
Spectra
Notes:
- 1) The fitting includes the systematic errors.
- 2) When the burst includes telescope slew time periods, the fitting uses an average response file made from multiple 5-s response files through out the slew time plus single time preiod for the non-slew times, and weighted by the total counts in the corresponding time period using addrmf. An average response file is needed becuase a spectral fit using the pre-slew DRM will introduce some errors in both a spectral shape and a normalization if the PHA file contains a lot of the slew/post-slew time interval.
- 3) For fits to more complicated models (e.g. a power-law over a cutoff power-law), the BAT team has decided to require a chi-square improvement of more than 6 for each extra dof.
Time averaged spectrum fit using the average DRM
Power-law model
Time interval is from -135.196 sec. to   21.728 sec.

Spectral model in power-law:
------------------------------------------------------------
Parameters  : value       lower 90%   higher 90%
Photon index: -2.62427     ( -0.424854   0.359798 )
Norm@50keV  : 5.46619E-04    ( -0.0001682   0.000169508 )
------------------------------------------------------------
#Fit statistic : Chi-Squared =          54.70 using 59 PHA bins.
# Reduced chi-squared =         0.9596 for     57 degrees of freedom
# Null hypothesis probability =   5.619548e-01

Photon flux (15-150 keV)    in 156.9 sec: 0.116124 ( -0.0183443  0.018364 ) ph/cm2/s
Energy fluence (15-150 keV)             : 8.8978e-07 ( -1.83881e-07  1.96302e-07 ) ergs/cm2
Cutoff power-law model
Time interval is from -135.196 sec. to   21.728 sec.
Spectral model in the cutoff power-law:
------------------------------------------------------------
Parameters  : value       lower 90%   higher 90%
Photon index: -1.93445     (       )
Epeak [keV] : 3.40084      (   )
Norm@50keV  : 1.49599E-03    (     )
------------------------------------------------------------
#Fit statistic : Chi-Squared =          54.96 using 59 PHA bins.
# Reduced chi-squared =         0.9814 for     56 degrees of freedom
# Null hypothesis probability =   5.143180e-01

Photon flux (15-150 keV)    in 156.9 sec: 0.114238 ( -0.0180655  0.018173 ) ph/cm2/s
Energy fluence (15-150 keV)             : 8.78017e-07 ( -1.1111e-07  2.25255e-07 ) ergs/cm2
1-s peak spectrum fit
Power-law model
Time interval is from   19.056 sec. to   20.056 sec.

Spectral model in power-law:
------------------------------------------------------------
Parameters  : value       lower 90%   higher 90%
Photon index: -2.319     ( -1.10838   0.794689 )
Norm@50keV  : 3.39942E-03    ( -0.00221256   0.00217299 )
------------------------------------------------------------
#Fit statistic : Chi-Squared =          69.76 using 59 PHA bins.
# Reduced chi-squared =          1.224 for     57 degrees of freedom
# Null hypothesis probability =   1.194955e-01

Photon flux (15-150 keV)    in 1 sec: 0.600491 ( -0.255364  0.255531 ) ph/cm2/s
Energy fluence (15-150 keV)             : 3.26084e-08 ( -1.65216e-08  1.86447e-08 ) ergs/cm2
Cutoff power-law model
Time interval is from   19.056 sec. to   20.056 sec.
Spectral model in the cutoff power-law:
------------------------------------------------------------
Parameters  : value       lower 90%   higher 90%
Photon index: -1.92829     (       )
Epeak [keV] : 6.74952      (   )
Norm@50keV  : 6.00403E-03    (     )
------------------------------------------------------------
#Fit statistic : Chi-Squared =          69.70 using 59 PHA bins.
# Reduced chi-squared =          1.245 for     56 degrees of freedom
# Null hypothesis probability =   1.032194e-01

Photon flux (15-150 keV)    in 1 sec: 0.596047 ( -0.252655  0.254355 ) ph/cm2/s
Energy fluence (15-150 keV)             : 0 ( 0  0 ) ergs/cm2
Time-resolved spectra
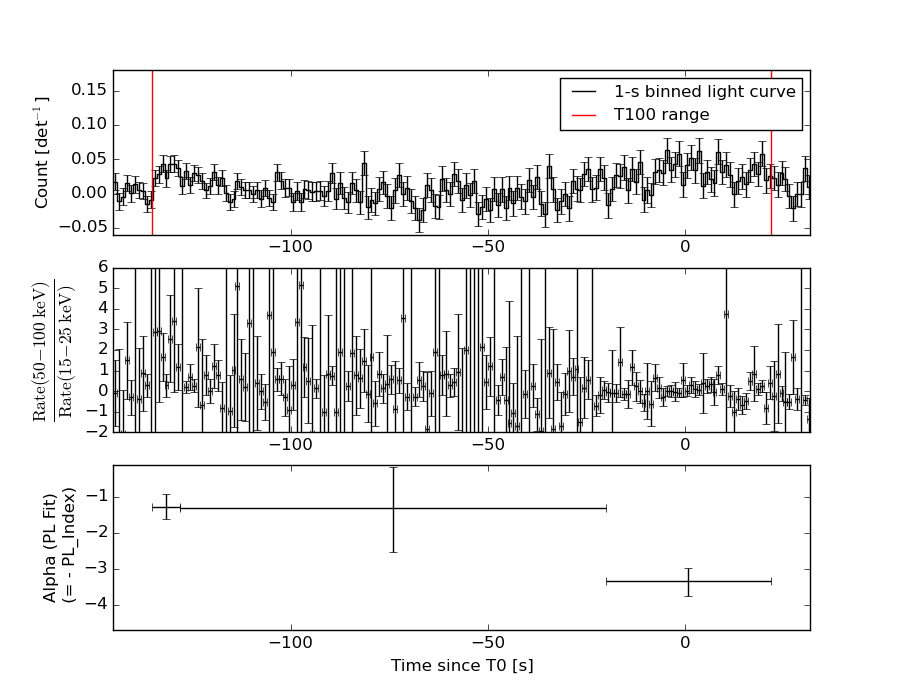
Distribution
T90 vs. Hardness ratio plot
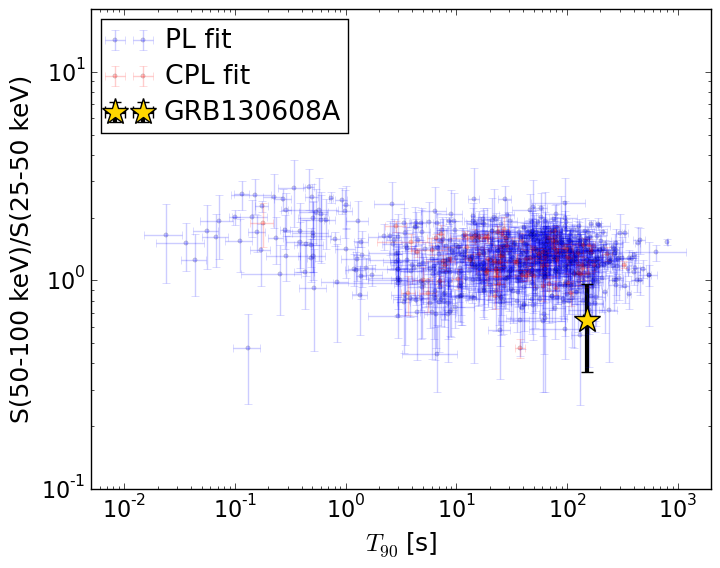
T90                                   = 151.852 sec.
Hardness ratio (energy fluence ratio) = 0.648783670313
S(15-50 keV) vs. S(50-150 keV) plot
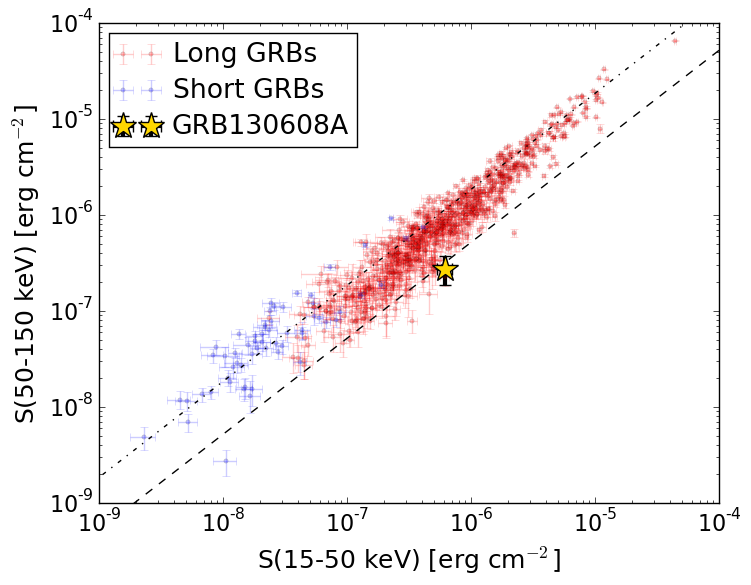
S(15-50 keV)  = 6.166341e-07
S(50-150 keV) = 2.7316048e-07
The dash-dotted line and the dashed line traces the fluences calculated from the Band function with Epeak = 15 and 150 keV, respectively. Both lines assume a canonical values of alpha = -1 and beta = -2.5.
Mask shadow pattern
IMX = -7.415839185258359E-01, IMY = 4.638660711682224E-01
Spacecraft aspect plot
Bright source in the pre-burst/pre-slew/post-slew images
Pre-burst image of 15-350 keV band
Time interval of the image:
Pre-slew background subtracted image of 15-350 keV band
Time interval of the image:
-75.299410 21.728000

# RAcent  DECcent POSerr Theta    Phi  PeakCts   SNR AngSep     Name
#  [deg]    [deg]    ['] [deg]  [deg]                   [']
  0.1490 -12.2984    2.3  33.6  105.7   1.2799   5.0 ------	UNKNOWN
 24.5974  41.4913    1.4  41.2 -148.0   1.4605   8.0 ------	UNKNOWN
Post-slew image of 15-350 keV band
Time interval of the image:
147.300600 963.134100
1225.000000 1425.172400

# RAcent  DECcent POSerr Theta    Phi  PeakCts   SNR AngSep     Name
#  [deg]    [deg]    ['] [deg]  [deg]                   [']
348.8138   6.8736    2.6  46.9   46.7  10.5199   4.4 ------	UNKNOWN
 13.5966  31.0044    2.8  13.7   37.6   2.5578   4.1 ------	UNKNOWN
 54.2219  58.2103    2.8  25.1 -147.8   2.3880   4.1 ------	UNKNOWN
 60.3834  40.6244    2.9  26.9 -106.1   2.9614   4.0 ------	UNKNOWN
 36.7594 -12.8338    3.5  55.5  -20.4   7.3078   3.3 ------	UNKNOWN
131.6018  66.3973    4.3  58.7 -159.3  14.0384   2.7 ------	UNKNOWN
 42.2260 -14.9408    3.0  58.7  -26.0  14.6813   3.9 ------	UNKNOWN
 53.4370  -1.8794    7.2  50.7  -44.5   5.8768   1.6 ------	UNKNOWN
101.1388  52.0976    3.8  51.0 -135.6  10.8557   3.1 ------	UNKNOWN
 74.8109  31.0607    5.1  41.3  -97.9   9.1616   2.3 ------	UNKNOWN