Analysis Summary
Notes:
- 1) No attempt has been made to eliminate the non-significant decimal places.
- 2) This batgrbproduct analysis is done using the HEASARC data.
- 3) This batgrbproduct analysis is using the flight position for the mask-weighting calculation.
======================================================================
BAT GRB EVENT DATA PROCESSING REPORT
Process Script Ver: batgrbproduct v2.46
Process Start Time: Sun Jan 12 01:43:01 EST 2014
Host Name: batevent1
Current Working Dir: /local/data/batevent/batevent_reproc/trigger557828
======================================================================
Trigger: 00557828 Segment: 000
BAT Trigger Time: 392506731.072 [s; MET]
Trigger Stop: 392506732.096 [s; MET]
UTC: 2013-06-09T21:38:40.416520 [includes UTCF correction]
Where From?: TDRSS position message
BAT
RA: 53.7539682175759 Dec: -40.1534346904126 [deg; J2000]
Catalogged Source?: NO
Point Source?: YES
GRB Indicated?: YES [ by BAT flight software ]
Image S/N Ratio: 11.03
Image Trigger?: NO
Rate S/N Ratio: 44.4747119158742 [ if not an image trigger ]
Image S/N Ratio: 11.03
Analysis Position: [ source = BAT ]
RA: 53.7539682175759 Dec: -40.1534346904126 [deg; J2000]
Refined Position: [ source = BAT pre-slew burst ]
RA: 53.7763308512089 Dec: -40.1700077063953 [deg; J2000]
{ 03h 35m 06.3s , -40d 10' 12.0" }
+/- 0.719130072931289 [arcmin] (estimated 90% radius based on SNR)
+/- 0.231024776243211 [arcmin] (formal 1-sigma fit error)
SNR: 48.7168461198664
Angular difference between the analysis and refined position is 1.428375 arcmin
Partial Coding Fraction: 0.4375 [ including projection effects ]
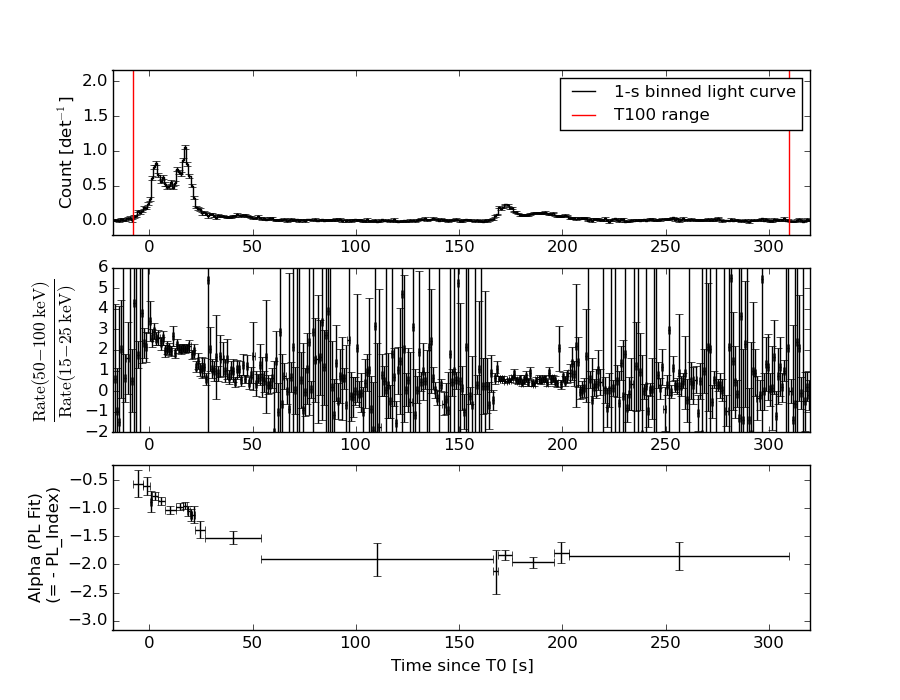
Duration
T90: 211.171999931335 +/- 17.0554920155477
Measured from: 0.191999971866608
to: 211.363999903202 [s; relative to TRIGTIME]
T50: 116.479999899864 +/- 41.0450455432533
Measured from: 7.97200000286102
to: 124.451999902725 [s; relative to TRIGTIME]
Fluence
Peak Flux (peak 1 second)
Measured from: 16.7799999713898
to: 17.7799999713898 [s; relative to TRIGTIME]
Total Fluence
Measured from: -7.83600002527237
to: 309.8599999547 [s; relative to TRIGTIME]
Band 1 Band 2 Band 3 Band 4
15-25 25-50 50-100 100-350 keV
Total 5.721047 8.164473 7.901362 2.648463
0.119386 0.129113 0.122205 0.108334 [error]
Peak 0.190165 0.342102 0.406581 0.156839
0.013369 0.016842 0.018138 0.014130 [error]
[ fluence units of on-axis counts / fully illuminated detector ]
======================================================================
====== Table of the duration information =============================
Value tstart tstop
T100 317.696 -7.836 309.860
T90 211.172 0.192 211.364
T50 116.480 7.972 124.452
Peak 1.000 16.780 17.780
====== Spectral Analysis Summary =====================================
Model : spectral model: simple power-law (PL) and cutoff power-law (CPL)
Ph_index : photon index: E^{Ph_index}
Ph_90err : 90% error of the photon index
Epeak : Epeak in keV
Epeak_90err: 90% error of Epeak
Norm : normalization at 50 keV in both the PL model and CPL model
Nomr_90err : 90% error of the normalization
chi2 : Chi-Squared
dof : degree of freedo
=== Time-averaged spectral analysis ===
(Best model with acceptable fit: PL)
Model Ph_index Ph_90err_low Ph_90err_hi Epeak Epeak_90err_low Epeak_90err_hi Norm Nomr_90err_low Norm_90err_hi chi2 dof
PL -1.222 -0.039 0.040 - - - 5.12e-03 -1.04e-04 1.04e-04 53.440 57
CPL -1.217 -0.040 0.040 9997.080 -9997.080 -9997.080 5.14e-03 -1.03e-04 5.26e-04 53.500 56
=== 1-s peak spectral analysis ===
(Best model with acceptable fit: N/A)
Model Ph_index Ph_90err_low Ph_90err_hi Epeak Epeak_90err_low Epeak_90err_hi Norm Nomr_90err_low Norm_90err_hi chi2 dof
PL -0.921 -0.085 0.086 - - - 7.44e-02 -3.68e-03 3.67e-03 53.180 57
CPL -0.772 -0.187 0.348 484.471 -484.471 -484.471 8.66e-02 -8.95e-03 3.52e-02 52.580 56
=== Fluence/Peak Flux Summary ===
Model Band1 Band2 Band3 Band4 Band5 Total
15-25 25-50 50-100 100-350 15-150 15-350 keV
Fluence PL 1.60e-06 3.49e-06 5.98e-06 2.37e-05 1.64e-05 3.48e-05 erg/cm2
90%_error_low -7.28e-08 -9.13e-08 -1.33e-07 -1.27e-06 -3.37e-07 -1.32e-06 erg/cm2
90%_error_hi 7.44e-08 9.11e-08 1.32e-07 1.33e-06 3.38e-07 1.36e-06 erg/cm2
Peak flux PL 6.81e-04 8.30e-03 1.08e-01 9.32e+00 4.89e-01 9.29e+00 ph/cm2/s
90%_error_low 5.06e-05 7.72e-04 -5.14e-03 -4.02e-01 -2.35e-02 -3.04e-01 ph/cm2/s
90%_error_hi 1.76e-04 2.16e-03 9.15e-03 6.78e-01 3.84e-02 9.20e-01 ph/cm2/s
Fluence CPL 1.60e-06 3.49e-06 5.99e-06 2.35e-05 1.64e-05 3.61e-05 erg/cm2
90%_error_low N/A -9.14e-08 N/A N/A N/A N/A erg/cm2
90%_error_hi N/A 9.12e-08 N/A N/A N/A N/A erg/cm2
Peak flux CPL 1.70e+00 2.53e+00 2.70e+00 4.44e+00 8.51e+00 1.14e+01 ph/cm2/s
90%_error_low -2.27e-01 -1.63e-01 -1.65e-01 -1.26e+00 -4.34e-01 -1.32e+00 ph/cm2/s
90%_error_hi 2.00e-01 1.64e-01 1.82e-01 9.07e-01 4.34e-01 1.11e+00 ph/cm2/s
======================================================================
Image
Pre-slew 15.0-350.0 keV image (Event data)
#   RAcent    DECcent   POSerr    Theta     Phi              Peak Cts       SNR   Name
   53.7763   -40.1700   0.0039    32.0512   -69.4882         8.3039179     48.717 TRIG_00557828

Foreground time interval of the image:
 -7.836  12.029 (delta_t =  19.865 [sec])
Background time interval of the image:
-647.871 -628.939 (delta_t =  18.933 [sec])
-239.072  -7.836 (delta_t = 231.236 [sec])
Light Curves
Note: The mask-weighted lightcurves have units of either count/det or counts/sec/det, where a det is 0.4 x 0.4 = 0.16 sq cm.
Full-time range; 1 s binning
Other quick-look light curves:
- 64 ms binning (zoomed)
- 16 ms binning (zoomed)
- 8 ms binning (zoomed)
- 2 ms binning (zoomed)
- SN=5 or 10 s binning (full-time range)
- Raw light curve
Spectra
- 64 ms binning (zoomed)
- 16 ms binning (zoomed)
- 8 ms binning (zoomed)
- 2 ms binning (zoomed)
- SN=5 or 10 s binning (full-time range)
- Raw light curve
Spectra
Notes:
- 1) The fitting includes the systematic errors.
- 2) When the burst includes telescope slew time periods, the fitting uses an average response file made from multiple 5-s response files through out the slew time plus single time preiod for the non-slew times, and weighted by the total counts in the corresponding time period using addrmf. An average response file is needed becuase a spectral fit using the pre-slew DRM will introduce some errors in both a spectral shape and a normalization if the PHA file contains a lot of the slew/post-slew time interval.
- 3) For fits to more complicated models (e.g. a power-law over a cutoff power-law), the BAT team has decided to require a chi-square improvement of more than 6 for each extra dof.
Time averaged spectrum fit using the average DRM
Power-law model
Time interval is from   -7.836 sec. to  309.860 sec.

Spectral model in power-law:
------------------------------------------------------------
Parameters  : value       lower 90%   higher 90%
Photon index: -1.22189     ( -0.0394164   0.0395254 )
Norm@50keV  : 5.11745E-03    ( -0.000103787   0.000103589 )
------------------------------------------------------------
#Fit statistic : Chi-Squared =          53.44 using 59 PHA bins.
# Reduced chi-squared =         0.9375 for     57 degrees of freedom
# Null hypothesis probability =   6.095733e-01

Photon flux (15-150 keV)    in 317.7 sec: 0.602604 ( -0.013482  0.013547 ) ph/cm2/s
Energy fluence (15-150 keV)             : 1.63963e-05 ( -3.37385e-07  3.37563e-07 ) ergs/cm2
Cutoff power-law model
Time interval is from   -7.836 sec. to  309.860 sec.
Spectral model in the cutoff power-law:
------------------------------------------------------------
Parameters  : value       lower 90%   higher 90%
Photon index: -1.21705     ( -0.0397983   0.0397191 )
Epeak [keV] : 9997.08      ( -9997.71 -9997.71 )
Norm@50keV  : 5.14146E-03    ( -0.000102562   0.00052672 )
------------------------------------------------------------
#Fit statistic : Chi-Squared =          53.50 using 59 PHA bins.
# Reduced chi-squared =         0.9554 for     56 degrees of freedom
# Null hypothesis probability =   5.699556e-01

Photon flux (15-150 keV)    in 317.7 sec: 0.605649 ( -0.017395  0.010281 ) ph/cm2/s
Energy fluence (15-150 keV)             : 1.63918e-05 ( 0  0 ) ergs/cm2
1-s peak spectrum fit
Power-law model
Time interval is from   16.780 sec. to   17.780 sec.

Spectral model in power-law:
------------------------------------------------------------
Parameters  : value       lower 90%   higher 90%
Photon index: -0.920735     ( -0.0854782   0.0863704 )
Norm@50keV  : 7.44435E-02    ( -0.00368211   0.00367192 )
------------------------------------------------------------
#Fit statistic : Chi-Squared =          53.18 using 59 PHA bins.
# Reduced chi-squared =         0.9330 for     57 degrees of freedom
# Null hypothesis probability =   6.190578e-01

Photon flux (15-150 keV)    in 1 sec: 0.489058 0.423526 0.366498 0.317967 0.277153 0.243181 0.215140 0.192135 0.173331 6.68283E-02 (    ) ph/cm2/s
Energy fluence (15-150 keV)             : 8.28896e-07 ( -4.48347e-08  4.49804e-08 ) ergs/cm2
Cutoff power-law model
Time interval is from   16.780 sec. to   17.780 sec.
Spectral model in the cutoff power-law:
------------------------------------------------------------
Parameters  : value       lower 90%   higher 90%
Photon index: -0.771852     ( -0.187383   0.348036 )
Epeak [keV] : 484.471      ( -484.472 -484.472 )
Norm@50keV  : 8.65690E-02    ( -0.00895356   0.0352362 )
------------------------------------------------------------
#Fit statistic : Chi-Squared =          52.58 using 59 PHA bins.
# Reduced chi-squared =         0.9390 for     56 degrees of freedom
# Null hypothesis probability =   6.050551e-01

Photon flux (15-150 keV)    in 1 sec: 8.50545 ( -0.43356  0.43355 ) ph/cm2/s
Energy fluence (15-150 keV)             : 8.24366e-07 ( -4.64369e-08  4.61966e-08 ) ergs/cm2
Time-resolved spectra
Distribution
T90 vs. Hardness ratio plot
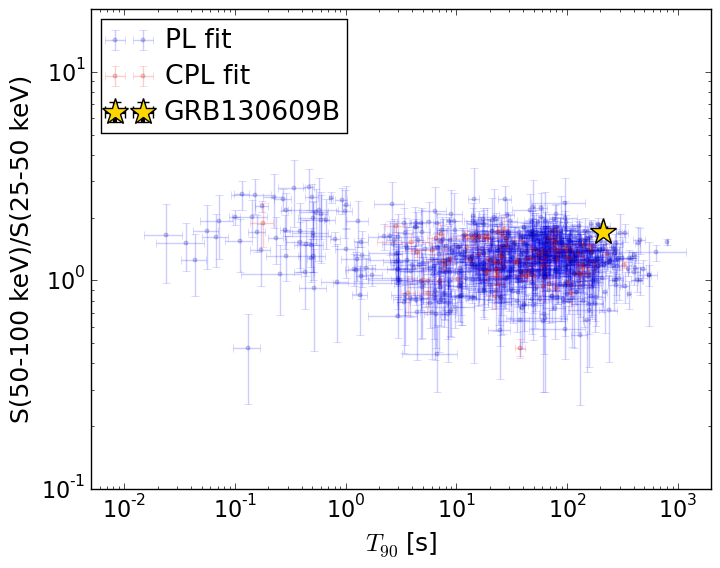
T90                                   = 211.172 sec.
Hardness ratio (energy fluence ratio) = 1.71490393573
S(15-50 keV) vs. S(50-150 keV) plot
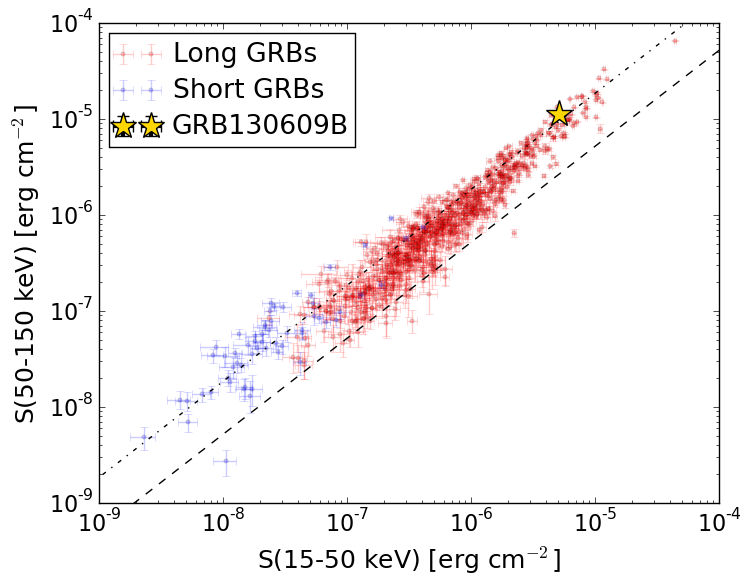
S(15-50 keV)  = 5.089574e-06
S(50-150 keV) = 1.1306597e-05
The dash-dotted line and the dashed line traces the fluences calculated from the Band function with Epeak = 15 and 150 keV, respectively. Both lines assume a canonical values of alpha = -1 and beta = -2.5.
Mask shadow pattern
IMX = 2.193899666965913E-01, IMY = 5.864165027239688E-01
Spacecraft aspect plot
Bright source in the pre-burst/pre-slew/post-slew images
Pre-burst image of 15-350 keV band
Time interval of the image:
-647.871410 -628.938800
-239.072000 -7.836000

# RAcent  DECcent POSerr Theta    Phi  PeakCts   SNR AngSep     Name
#  [deg]    [deg]    ['] [deg]  [deg]                   [']
337.9302 -36.9175    3.3  26.8  133.5   0.9267   3.5 ------	UNKNOWN
 37.1991 -29.4998    2.9  29.8 -103.1   1.1134   4.0 ------	UNKNOWN
  7.6798   7.3111    3.2  58.7 -159.1   4.7728   3.7 ------	UNKNOWN
  7.6969   7.4596    3.7  58.8 -159.1   4.9528   3.7 ------	UNKNOWN
 25.9761  -2.2279    2.3  50.9 -135.7   5.6624   5.0 ------	UNKNOWN
Pre-slew background subtracted image of 15-350 keV band
Time interval of the image:
-7.836000 12.028600

# RAcent  DECcent POSerr Theta    Phi  PeakCts   SNR AngSep     Name
#  [deg]    [deg]    ['] [deg]  [deg]                   [']
 75.7103 -83.8891    3.4  36.5   14.0   0.4515   3.4 ------	UNKNOWN
 53.7763 -40.1700    0.2  32.1  -69.5   8.3033  48.7 ------	UNKNOWN
Post-slew image of 15-350 keV band
Time interval of the image:
65.228590 840.618000
840.928000 963.026400

# RAcent  DECcent POSerr Theta    Phi  PeakCts   SNR AngSep     Name
#  [deg]    [deg]    ['] [deg]  [deg]                   [']
 98.1186 -69.1553    2.6  37.1   41.4   4.4600   4.4 ------	UNKNOWN
 15.9963 -23.8674    2.4  35.6  171.4   3.4982   4.8 ------	UNKNOWN
 53.7907 -40.1812    0.7   0.0   -2.9   7.9700  16.0 ------	UNKNOWN
 39.3250 -18.2641    3.8  25.2 -148.1   1.4900   3.0 ------	UNKNOWN
 49.8760  -9.8075    2.7  30.6 -121.8   3.3417   4.3 ------	UNKNOWN
 16.2410   7.3257    4.7  58.7 -159.2  11.2054   2.5 ------	UNKNOWN