Analysis Summary
Notes:
- 1) No attempt has been made to eliminate the non-significant decimal places.
- 2) This batgrbproduct analysis is done using the HEASARC data.
- 3) This batgrbproduct analysis is using the flight position for the mask-weighting calculation.
======================================================================
BAT GRB EVENT DATA PROCESSING REPORT
Process Script Ver: batgrbproduct v2.46
Process Start Time: Wed Jun 10 16:47:33 EDT 2015
Host Name: bat1
Current Working Dir: /local/data/bat1/alien/Swift_3rdBATcatalog/event/batevent_reproc/trigger557976
======================================================================
Trigger: 00557976 Segment: 000
BAT Trigger Time: 392700152.832 [s; MET]
Trigger Stop: 392700153.856 [s; MET]
UTC: 2013-06-12T03:22:22.167880 [includes UTCF correction]
Where From?: TDRSS position message
BAT
RA: 259.804329470416 Dec: 16.7058164669719 [deg; J2000]
Catalogged Source?: NO
Point Source?: YES
GRB Indicated?: YES [ by BAT flight software ]
Image S/N Ratio: 7.62
Image Trigger?: NO
Rate S/N Ratio: 14.6287388383278 [ if not an image trigger ]
Image S/N Ratio: 7.62
Analysis Position: [ source = BAT ]
RA: 259.804329470416 Dec: 16.7058164669719 [deg; J2000]
Refined Position: [ source = BAT pre-slew burst ]
RA: 259.772856817059 Dec: 16.7248262826293 [deg; J2000]
{ 17h 19m 05.5s , +16d 43' 29.4" }
+/- 1.94332020300138 [arcmin] (estimated 90% radius based on SNR)
+/- 1.19225329512967 [arcmin] (formal 1-sigma fit error)
SNR: 11.7736777086418
Angular difference between the analysis and refined position is 2.138191 arcmin
Partial Coding Fraction: 0.3476562 [ including projection effects ]
Duration
T90: 4 +/- 1.4142135623731
Measured from: -0.832000017166138
to: 3.16799998283386 [s; relative to TRIGTIME]
T50: 1 +/- 1.4142135623731
Measured from: 0.167999982833862
to: 1.16799998283386 [s; relative to TRIGTIME]
Fluence
Peak Flux (peak 1 second)
Measured from: 0.167999982833862
to: 1.16799998283386 [s; relative to TRIGTIME]
Total Fluence
Measured from: -0.832000017166138
to: 3.16799998283386 [s; relative to TRIGTIME]
Band 1 Band 2 Band 3 Band 4
15-25 25-50 50-100 100-350 keV
Total 0.175679 0.237130 0.084053 0.037119
0.024674 0.026236 0.023292 0.021570 [error]
Peak 0.065750 0.095589 0.029215 0.010769
0.013085 0.013613 0.011942 0.010596 [error]
[ fluence units of on-axis counts / fully illuminated detector ]
======================================================================
====== Table of the duration information =============================
Value tstart tstop
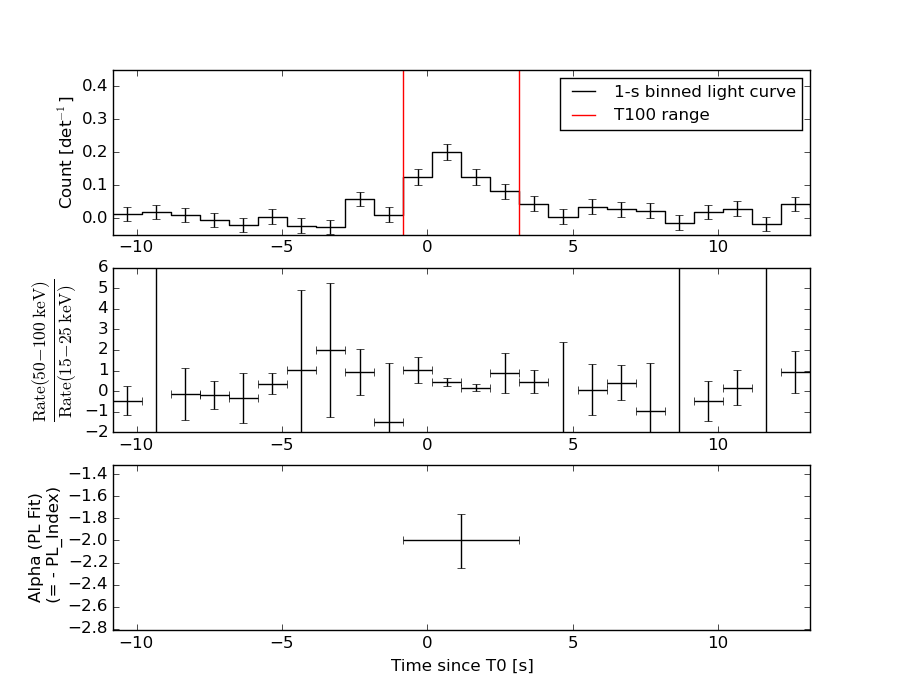
T100 4.000 -0.832 3.168
T90 4.000 -0.832 3.168
T50 1.000 0.168 1.168
Peak 1.000 0.168 1.168
====== Spectral Analysis Summary =====================================
Model : spectral model: simple power-law (PL) and cutoff power-law (CPL)
Ph_index : photon index: E^{Ph_index}
Ph_90err : 90% error of the photon index
Epeak : Epeak in keV
Epeak_90err: 90% error of Epeak
Norm : normalization at 50 keV in both the PL model and CPL model
Nomr_90err : 90% error of the normalization
chi2 : Chi-Squared
dof : degree of freedo
=== Time-averaged spectral analysis ===
(Best model with acceptable fit: N/A)
Model Ph_index Ph_90err_low Ph_90err_hi Epeak Epeak_90err_low Epeak_90err_hi Norm Nomr_90err_low Norm_90err_hi chi2 dof
PL -1.995 -0.254 0.236 - - - 7.62e-03 -1.41e-03 1.39e-03 71.920 57
CPL 0.836 -1.502 2.217 37.262 -5.255 6.789 4.19e-01 -4.19e-01 1.04e+01 59.320 56
=== 1-s peak spectral analysis ===
(Best model with acceptable fit: N/A)
Model Ph_index Ph_90err_low Ph_90err_hi Epeak Epeak_90err_low Epeak_90err_hi Norm Nomr_90err_low Norm_90err_hi chi2 dof
PL -2.077 -0.353 0.326 - - - 1.04e-02 -2.79e-03 2.79e-03 76.910 57
CPL 2.917 -2.714 -2.917 32.355 -4.511 5.923 2.08e+01 -2.08e+01 1.65e+06 64.300 56
=== Fluence/Peak Flux Summary ===
Model Band1 Band2 Band3 Band4 Band5 Total
15-25 25-50 50-100 100-350 15-150 15-350 keV
Fluence PL 6.20e-08 8.44e-08 8.47e-08 1.54e-07 2.81e-07 3.85e-07 erg/cm2
90%_error_low -1.14e-08 -1.25e-08 -2.02e-08 -6.03e-08 -4.87e-08 -8.86e-08 erg/cm2
90%_error_hi 1.16e-08 1.24e-08 2.11e-08 8.16e-08 5.02e-08 1.05e-07 erg/cm2
Peak flux PL 7.48e-01 5.37e-01 2.55e-01 1.71e-01 1.62e+00 1.71e+00 ph/cm2/s
90%_error_low -1.91e-01 -1.14e-01 -8.35e-02 -8.41e-02 -3.38e-01 -3.61e-01 ph/cm2/s
90%_error_hi 1.97e-01 1.14e-01 8.89e-02 1.23e-01 3.38e-01 3.63e-01 ph/cm2/s
Fluence CPL 5.40e-08 1.14e-07 5.81e-08 3.71e-09 2.30e-07 2.30e-07 erg/cm2
90%_error_low -1.32e-08 -1.91e-08 -2.73e-08 -3.43e-09 -3.97e-08 -3.99e-08 erg/cm2
90%_error_hi 1.32e-08 1.96e-08 2.99e-08 1.88e-08 4.55e-08 4.73e-08 erg/cm2
Peak flux CPL 6.55e-01 8.24e-01 8.17e-02 1.05e-04 1.56e+00 1.56e+00 ph/cm2/s
90%_error_low -2.20e-01 -1.80e-01 -8.17e-02 -1.05e-04 -3.20e-01 -3.20e-01 ph/cm2/s
90%_error_hi 2.26e-01 1.82e-01 1.43e-01 9.83e-03 3.23e-01 3.23e-01 ph/cm2/s
======================================================================
Image
Pre-slew 15.0-350.0 keV image (Event data)
#   RAcent    DECcent   POSerr    Theta     Phi              Peak Cts       SNR   Name
  259.7729    16.7248   0.0164    34.4953    40.9573         0.5544059     11.774 TRIG_00557976

Foreground time interval of the image:
 -0.832   3.168 (delta_t =   4.000 [sec])
Background time interval of the image:
-179.832  -0.832 (delta_t = 179.000 [sec])
Light Curves
Note: The mask-weighted lightcurves have units of either count/det or counts/sec/det, where a det is 0.4 x 0.4 = 0.16 sq cm.
Full-time range; 1 s binning
Other quick-look light curves:
- 64 ms binning (zoomed)
- 16 ms binning (zoomed)
- 8 ms binning (zoomed)
- 2 ms binning (zoomed)
- SN=5 or 10 s binning (full-time range)
- Raw light curve
Spectra
- 64 ms binning (zoomed)
- 16 ms binning (zoomed)
- 8 ms binning (zoomed)
- 2 ms binning (zoomed)
- SN=5 or 10 s binning (full-time range)
- Raw light curve
Spectra
Notes:
- 1) The fitting includes the systematic errors.
- 2) When the burst includes telescope slew time periods, the fitting uses an average response file made from multiple 5-s response files through out the slew time plus single time preiod for the non-slew times, and weighted by the total counts in the corresponding time period using addrmf. An average response file is needed becuase a spectral fit using the pre-slew DRM will introduce some errors in both a spectral shape and a normalization if the PHA file contains a lot of the slew/post-slew time interval.
- 3) For fits to more complicated models (e.g. a power-law over a cutoff power-law), the BAT team has decided to require a chi-square improvement of more than 6 for each extra dof.
Time averaged spectrum fit using the average DRM
Power-law model
Time interval is from   -0.832 sec. to    3.168 sec.

Spectral model in power-law:
------------------------------------------------------------
Parameters  : value       lower 90%   higher 90%
Photon index: -1.99473     ( -0.253273   0.236965 )
Norm@50keV  : 7.61559E-03    ( -0.00140924   0.00138772 )
------------------------------------------------------------
#Fit statistic : Chi-Squared =          71.92 using 59 PHA bins.
# Reduced chi-squared =          1.262 for     57 degrees of freedom
# Null hypothesis probability =   8.805556e-02

Photon flux (15-150 keV)    in 4 sec: 1.13966 ( -0.164678  0.16467 ) ph/cm2/s
Energy fluence (15-150 keV)             : 2.80834e-07 ( -4.86728e-08  5.02284e-08 ) ergs/cm2
Cutoff power-law model
Time interval is from   -0.832 sec. to    3.168 sec.
Spectral model in the cutoff power-law:
------------------------------------------------------------
Parameters  : value       lower 90%   higher 90%
Photon index: 0.83623     ( -1.54271   2.17585 )
Epeak [keV] : 37.2620      ( -5.17842 6.86578 )
Norm@50keV  : 0.419434    ( -0.465653   10.3808 )
------------------------------------------------------------
#Fit statistic : Chi-Squared =          59.32 using 59 PHA bins.
# Reduced chi-squared =          1.059 for     56 degrees of freedom
# Null hypothesis probability =   3.554148e-01

Photon flux (15-150 keV)    in 4 sec: 1.08514 ( -0.160208  0.16161 ) ph/cm2/s
Energy fluence (15-150 keV)             : 2.29557e-07 ( -3.9742e-08  4.54668e-08 ) ergs/cm2
1-s peak spectrum fit
Power-law model
Time interval is from    0.168 sec. to    1.168 sec.

Spectral model in power-law:
------------------------------------------------------------
Parameters  : value       lower 90%   higher 90%
Photon index: -2.07696     ( -0.356096   0.322966 )
Norm@50keV  : 1.04214E-02    ( -0.00279591   0.00277846 )
------------------------------------------------------------
#Fit statistic : Chi-Squared =          76.91 using 59 PHA bins.
# Reduced chi-squared =          1.349 for     57 degrees of freedom
# Null hypothesis probability =   4.058079e-02

Photon flux (15-150 keV)    in 1 sec: 1.62135 ( -0.33765  0.33771 ) ph/cm2/s
Energy fluence (15-150 keV)             : 9.67186e-08 ( -2.36367e-08  2.47517e-08 ) ergs/cm2
Cutoff power-law model
Time interval is from    0.168 sec. to    1.168 sec.
Spectral model in the cutoff power-law:
------------------------------------------------------------
Parameters  : value       lower 90%   higher 90%
Photon index: 3.75511     ( -2.74786   -2.95115 )
Epeak [keV] : 31.8437      ( -4.46753 5.96667 )
Norm@50keV  : 78.9599    ( -78.8351   1.64615e+06 )
------------------------------------------------------------
#Fit statistic : Chi-Squared =          64.20 using 59 PHA bins.
# Reduced chi-squared =          1.146 for     56 degrees of freedom
# Null hypothesis probability =   2.112340e-01

Photon flux (15-150 keV)    in 1 sec: 1.56104 ( -0.32008  0.32347 ) ph/cm2/s
Energy fluence (15-150 keV)             : 7.3399e-08 ( -1.6749e-08  1.94848e-08 ) ergs/cm2
Time-resolved spectra
Distribution
T90 vs. Hardness ratio plot
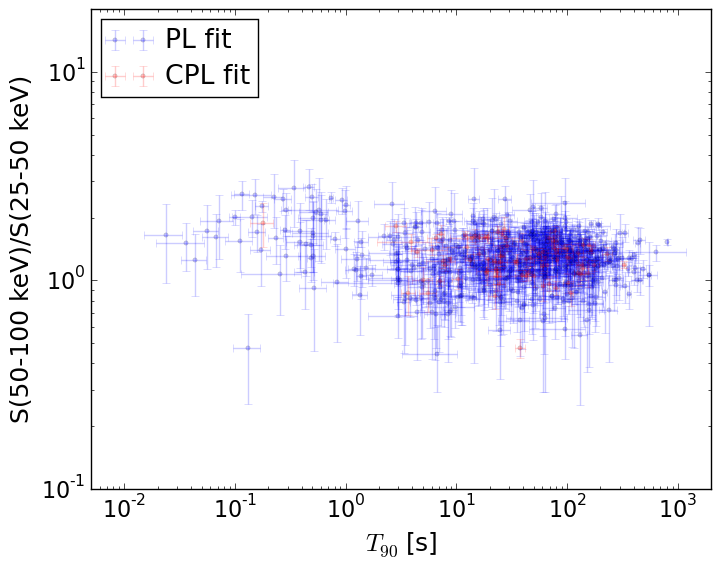
T90                                   = N/A sec.
Hardness ratio (energy fluence ratio) = N/A
S(15-50 keV) vs. S(50-150 keV) plot
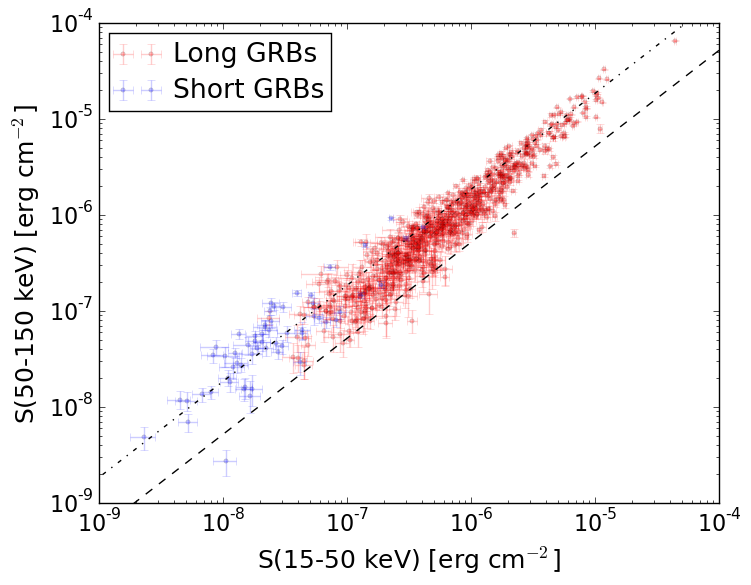
S(15-50 keV)  = N/A
S(50-150 keV) = N/A
The dash-dotted line and the dashed line traces the fluences calculated from the Band function with Epeak = 15 and 150 keV, respectively. Both lines assume a canonical values of alpha = -1 and beta = -2.5.
Mask shadow pattern
IMX = 5.189412508516038E-01, IMY = -4.504306793227182E-01
Spacecraft aspect plot
Bright source in the pre-burst/pre-slew/post-slew images
Pre-burst image of 15-350 keV band
Time interval of the image:
-179.832000 -0.832000

# RAcent  DECcent POSerr Theta    Phi  PeakCts   SNR AngSep     Name
#  [deg]    [deg]    ['] [deg]  [deg]                   [']
254.4720  35.2940    8.5  26.4    6.0  -0.2821  -1.4    3.0	Her X-1
218.3437  -2.1840    3.1  30.9  131.0   1.0638   3.7 ------	UNKNOWN
180.0453  -0.6174    2.7  51.3 -177.2   2.1313   4.3 ------	UNKNOWN
169.3428  36.1579    2.4  46.7 -126.3   4.0612   4.8 ------	UNKNOWN
Pre-slew background subtracted image of 15-350 keV band
Time interval of the image:
-0.832000 3.168000

# RAcent  DECcent POSerr Theta    Phi  PeakCts   SNR AngSep     Name
#  [deg]    [deg]    ['] [deg]  [deg]                   [']
254.5480  35.4024    3.0  26.5    5.8   0.1172   3.9    5.7	Her X-1
259.7729  16.7247    1.0  34.5   41.0   0.5548  11.7 ------	UNKNOWN
248.3897  23.2731    2.2  22.1   36.6   0.1603   5.3 ------	UNKNOWN
288.2433  35.3646    2.0  53.8    4.3   0.6206   5.8 ------	UNKNOWN
Post-slew image of 15-350 keV band
Time interval of the image:
73.468590 662.268000
840.168000 902.318400

# RAcent  DECcent POSerr Theta    Phi  PeakCts   SNR AngSep     Name
#  [deg]    [deg]    ['] [deg]  [deg]                   [']
244.9039 -15.6125    3.7  35.5  116.5   0.7780   3.2    4.7	Sco X-1
254.3262  35.4844   23.1  19.4 -102.3   0.0548   0.5   10.7	Her X-1
268.4811  -1.5134    4.3  20.1   65.3   0.3182   2.7    7.7	SW J1753.5-0127
273.9976 -14.0914    5.4  33.8   66.0   0.4781   2.1    3.3	GX 17+2
288.7487  10.9449    4.6  28.7    9.1   0.2800   2.5    2.9	GRS 1915+105
299.6669  35.3128    4.4  40.0  -34.3   0.4073   2.6    7.7	Cyg X-1
308.2251  40.7416    0.0  48.0  -39.0  -0.4817  -1.7   13.7	Cyg X-3
316.2997  10.2797    2.3  55.1    0.3   2.1394   5.1 ------	UNKNOWN
248.6613  19.6394    2.3  11.0 -161.6   0.4501   5.0 ------	UNKNOWN
197.0547  25.0508    3.9  58.7 -159.2   1.8643   3.0 ------	UNKNOWN
271.1049  47.8037    3.0  32.4  -74.5   0.6352   3.8 ------	UNKNOWN
306.9921  47.5149    2.1  49.3  -47.9   2.7193   5.5 ------	UNKNOWN