Analysis Summary
Notes:
- 1) No attempt has been made to eliminate the non-significant decimal places.
- 2) This batgrbproduct analysis is done using the HEASARC data.
- 3) This batgrbproduct analysis is using the flight position for the mask-weighting calculation.
======================================================================
                  BAT GRB EVENT DATA PROCESSING REPORT
    Process Script Ver: batgrbproduct v2.46
    Process Start Time: Sun Jan 12 01:15:03 EST 2014
             Host Name: batevent1
   Current Working Dir: /local/data/batevent/batevent_reproc/trigger558982
======================================================================

  Trigger: 00558982      Segment: 000

  BAT Trigger Time: 393836450.24   [s; MET]
      Trigger Stop: 393836452.288   [s; MET]
               UTC: 2013-06-25T07:00:39.525160    [includes UTCF correction]
       Where From?: TDRSS position message

  BAT
    RA: 343.267990954325   Dec: 82.1783740417677  [deg; J2000]

     Catalogged Source?: NO
     Point Source?:      YES
     GRB Indicated?:     YES    [ by BAT flight software ]
     Image S/N Ratio:    8.47
     Image Trigger?:     NO
     Rate S/N Ratio:     10.5356537528527  [ if not an image trigger ]
     Image S/N Ratio:    8.47

  Analysis Position:   [ source = BAT ]
    RA: 343.267990954325   Dec: 82.1783740417677  [deg; J2000]

  Refined Position:   [ source = BAT pre-slew burst ]
    RA: 343.36096008508   Dec: 82.1718553087129  [deg; J2000]
        { 22h 53m 26.6s , +82d 10' 18.7" }
         +/- 1.19309195280371 [arcmin] (estimated 90% radius based on SNR)
         +/- 0.40070528157163 [arcmin] (formal 1-sigma fit error)
    SNR: 23.6365568874696

  Angular difference between the analysis and refined position is 0.854242 arcmin

  Partial Coding Fraction: 0.75    [ including projection effects ]

  Duration
     T90: 41.2719999551773 +/- 9.48464778105191
        Measured from: -23.5960000157356
                   to: 17.6759999394417     [s; relative to TRIGTIME]
     T50: 16.5199999809265 +/- 2.56273914839542
        Measured from: -9.77600002288818
                   to: 6.74399995803833     [s; relative to TRIGTIME]


  Fluence
     Peak Flux  (peak 1 second)
        Measured from: 2.54399996995926
                   to: 3.54399996995926     [s; relative to TRIGTIME]
     Total Fluence
        Measured from: -29.3680000305176
                   to: 28.3880000114441     [s; relative to TRIGTIME]

             Band 1     Band 2     Band 3     Band 4
              15-25      25-50     50-100    100-350     keV
 Total     0.732244   1.068338   0.878743   0.192024
           0.052913   0.055621   0.048563   0.039999 [error]
 Peak      0.032784   0.064000   0.038538   0.010908
           0.007249   0.007960   0.006734   0.005282 [error]

     [ fluence units of on-axis counts / fully illuminated detector ]

======================================================================


====== Table of the duration information =============================

        Value   tstart    tstop
T100   57.756  -29.368   28.388
T90    41.272  -23.596   17.676
T50    16.520   -9.776    6.744
Peak    1.000    2.544    3.544


====== Spectral Analysis Summary =====================================

Model      : spectral model: simple power-law (PL) and cutoff power-law (CPL)
Ph_index   : photon index: E^{Ph_index}
Ph_90err   : 90% error of the photon index
Epeak      : Epeak in keV
Epeak_90err: 90% error of Epeak
Norm       : normalization at 50 keV in both the PL model and CPL model
Nomr_90err : 90% error of the normalization
chi2       : Chi-Squared
dof        : degree of freedo

=== Time-averaged spectral analysis ===
(Best model with acceptable fit: PL)

Model Ph_index Ph_90err_low Ph_90err_hi  Epeak  Epeak_90err_low  Epeak_90err_hi  Norm       Nomr_90err_low    Norm_90err_hi    chi2    dof
PL      -1.426    -0.101      0.101       -           -               -         3.35e-03     -1.91e-04          1.91e-04      47.740   57
CPL     -1.126    -0.342      0.430      151.897     -60.836      -151.897      4.69e-03     -1.45e-03          2.80e-03      46.060   56


=== 1-s peak spectral analysis ===
(Best model with acceptable fit: PL)

Model Ph_index Ph_90err_low Ph_90err_hi  Epeak  Epeak_90err_low  Epeak_90err_hi  Norm       Nomr_90err_low    Norm_90err_hi    chi2    dof
PL      -1.533     -0.259     0.255       -           -               -         9.46e-03     -1.51e-03          1.50e-03      53.240   57
CPL     -0.895     -0.853     1.874       79.578     -30.781       -79.578      2.11e-02     -1.29e-02          2.01e-01      52.590   56


=== Fluence/Peak Flux Summary ===

              Model    Band1     Band2     Band3     Band4     Band5     Total
                       15-25     25-50    50-100    100-350    15-150    15-350    keV
Fluence         PL   2.31e-07  4.43e-07  6.60e-07  2.12e-06  1.86e-06  3.45e-06   erg/cm2
      90%_error_low -2.35e-08 -2.75e-08 -4.73e-08 -3.15e-07 -1.16e-07 -3.51e-07   erg/cm2
      90%_error_hi   2.43e-08  2.74e-08  4.72e-08  3.52e-07  1.16e-07  3.80e-07   erg/cm2
Peak flux       PL   4.02e-01  3.97e-01  2.74e-01  2.99e-01  1.19e+00  1.37e+00   ph/cm2/s
      90%_error_low -9.71e-02 -6.34e-02 -5.48e-02 -1.04e-01 -1.83e-01 -2.12e-01   ph/cm2/s
      90%_error_hi   1.02e-01  6.28e-02  5.43e-02  1.33e-01  1.83e-01  2.14e-01   ph/cm2/s

Fluence        CPL   2.18e-07  4.56e-07  6.75e-07  1.37e-06  1.82e-06  2.72e-06   erg/cm2
      90%_error_low -2.88e-08 -3.19e-08 -5.19e-08 -5.63e-07 -1.27e-07 -5.71e-07   erg/cm2
      90%_error_hi   2.93e-08  3.26e-08  5.27e-08  8.44e-07  1.27e-07  1.30e-06   erg/cm2
Peak flux      CPL   3.71e-01  4.28e-01  2.83e-01  1.38e-01  1.17e+00  1.22e+00   ph/cm2/s
      90%_error_low -1.22e-01 -8.11e-02 -6.10e-02 -1.38e-01 -1.95e-01 -2.36e-01   ph/cm2/s
      90%_error_hi   1.20e-01  9.85e-02  6.16e-02  1.95e-01  1.91e-01  2.84e-01   ph/cm2/s

======================================================================
Image
Pre-slew 15.0-350.0 keV image (Event data)
#   RAcent    DECcent   POSerr    Theta     Phi              Peak Cts       SNR   Name
  343.3610    82.1719   0.0081    28.5851    13.9131         2.8991420     23.637 TRIG_00558982

Foreground time interval of the image:
-29.368  26.061 (delta_t =  55.429 [sec])
Background time interval of the image:
-239.240 -29.368 (delta_t = 209.872 [sec])
Light Curves
Note: The mask-weighted lightcurves have units of either count/det or counts/sec/det, where a det is 0.4 x 0.4 = 0.16 sq cm.
Full-time range; 1 s binning
Other quick-look light curves:
- 64 ms binning (zoomed)
- 16 ms binning (zoomed)
- 8 ms binning (zoomed)
- 2 ms binning (zoomed)
- SN=5 or 10 s binning (full-time range)
- Raw light curve
Spectra
- 64 ms binning (zoomed)
- 16 ms binning (zoomed)
- 8 ms binning (zoomed)
- 2 ms binning (zoomed)
- SN=5 or 10 s binning (full-time range)
- Raw light curve
Spectra
Notes:
- 1) The fitting includes the systematic errors.
- 2) When the burst includes telescope slew time periods, the fitting uses an average response file made from multiple 5-s response files through out the slew time plus single time preiod for the non-slew times, and weighted by the total counts in the corresponding time period using addrmf. An average response file is needed becuase a spectral fit using the pre-slew DRM will introduce some errors in both a spectral shape and a normalization if the PHA file contains a lot of the slew/post-slew time interval.
- 3) For fits to more complicated models (e.g. a power-law over a cutoff power-law), the BAT team has decided to require a chi-square improvement of more than 6 for each extra dof.
Time averaged spectrum fit using the average DRM
Power-law model
Time interval is from  -29.368 sec. to   28.388 sec.

Spectral model in power-law:
------------------------------------------------------------
Parameters  : value       lower 90%   higher 90%
Photon index: -1.42589     ( -0.100565   0.10056 )
Norm@50keV  : 3.35114E-03    ( -0.000190854   0.00019057 )
------------------------------------------------------------
#Fit statistic : Chi-Squared =          47.74 using 59 PHA bins.
# Reduced chi-squared =         0.8375 for     57 degrees of freedom
# Null hypothesis probability =   8.040505e-01

Photon flux (15-150 keV)    in 57.76 sec: 0.410577 ( -0.024175  0.024218 ) ph/cm2/s
Energy fluence (15-150 keV)             : 1.86092e-06 ( -1.1567e-07  1.16267e-07 ) ergs/cm2
Cutoff power-law model
Time interval is from  -29.368 sec. to   28.388 sec.
Spectral model in the cutoff power-law:
------------------------------------------------------------
Parameters  : value       lower 90%   higher 90%
Photon index: -1.12637     ( -0.342405   0.42954 )
Epeak [keV] : 151.897      ( -60.8381 -151.899 )
Norm@50keV  : 4.69136E-03    ( -0.00144537   0.00280369 )
------------------------------------------------------------
#Fit statistic : Chi-Squared =          46.06 using 59 PHA bins.
# Reduced chi-squared =         0.8225 for     56 degrees of freedom
# Null hypothesis probability =   8.256750e-01

Photon flux (15-150 keV)    in 57.76 sec: 0.404464 ( -0.025486  0.025464 ) ph/cm2/s
Energy fluence (15-150 keV)             : 1.82237e-06 ( -1.27384e-07  1.26829e-07 ) ergs/cm2
1-s peak spectrum fit
Power-law model
Time interval is from    2.544 sec. to    3.544 sec.

Spectral model in power-law:
------------------------------------------------------------
Parameters  : value       lower 90%   higher 90%
Photon index: -1.53342     ( -0.25904   0.255078 )
Norm@50keV  : 9.45906E-03    ( -0.00151253   0.00149507 )
------------------------------------------------------------
#Fit statistic : Chi-Squared =          53.24 using 59 PHA bins.
# Reduced chi-squared =         0.9340 for     57 degrees of freedom
# Null hypothesis probability =   6.169765e-01

Photon flux (15-150 keV)    in 1 sec: 1.19183 ( -0.18332  0.18349 ) ph/cm2/s
Energy fluence (15-150 keV)             : 8.92771e-08 ( -1.53847e-08  1.56023e-08 ) ergs/cm2
Cutoff power-law model
Time interval is from    2.544 sec. to    3.544 sec.
Spectral model in the cutoff power-law:
------------------------------------------------------------
Parameters  : value       lower 90%   higher 90%
Photon index: -0.894708     ( -0.85408   1.87278 )
Epeak [keV] : 79.5776      ( -30.6387 -79.4356 )
Norm@50keV  : 2.10764E-02    ( -0.0129948   0.200589 )
------------------------------------------------------------
#Fit statistic : Chi-Squared =          52.59 using 59 PHA bins.
# Reduced chi-squared =         0.9392 for     56 degrees of freedom
# Null hypothesis probability =   6.045913e-01

Photon flux (15-150 keV)    in 1 sec: 1.16792 ( -0.195208  0.1911 ) ph/cm2/s
Energy fluence (15-150 keV)             : 8.41027e-08 ( -1.88933e-08  1.87865e-08 ) ergs/cm2
Time-resolved spectra
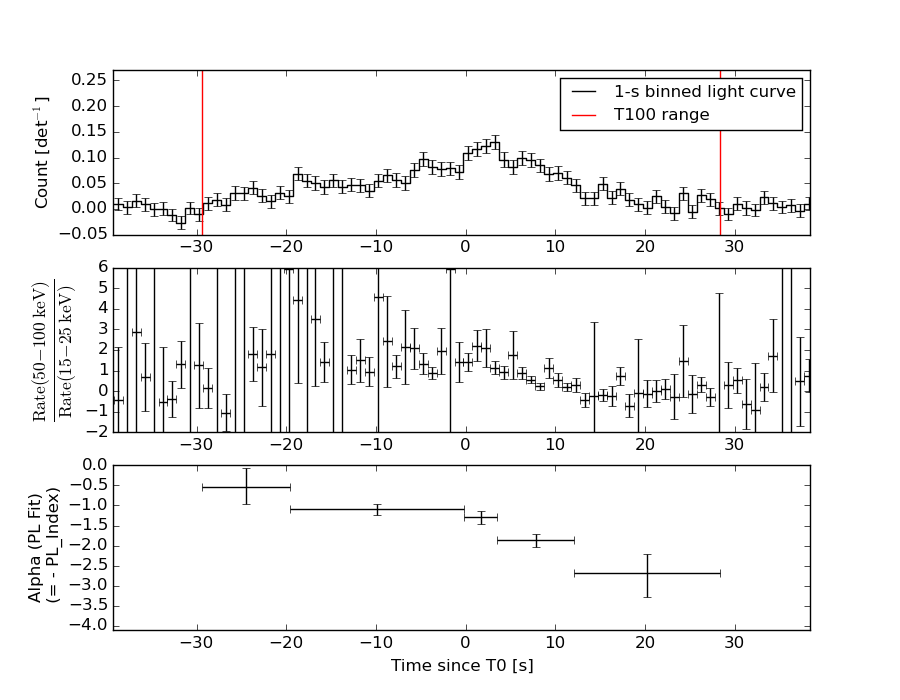
Distribution
T90 vs. Hardness ratio plot
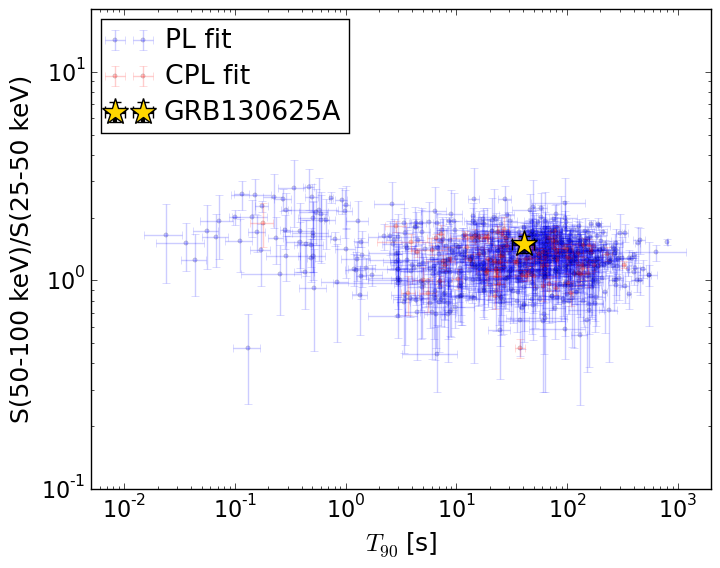
T90                                   = 41.272 sec.
Hardness ratio (energy fluence ratio) = 1.48877851722
S(15-50 keV) vs. S(50-150 keV) plot

S(15-50 keV)  = 6.739281e-07
S(50-150 keV) = 1.1870101e-06
The dash-dotted line and the dashed line traces the fluences calculated from the Band function with Epeak = 15 and 150 keV, respectively. Both lines assume a canonical values of alpha = -1 and beta = -2.5.
Mask shadow pattern
IMX = 5.288944595982462E-01, IMY = -1.310165041504657E-01
Spacecraft aspect plot

Bright source in the pre-burst/pre-slew/post-slew images
Pre-burst image of 15-350 keV band
Time interval of the image:
-239.240000 -29.368000

# RAcent  DECcent POSerr Theta    Phi  PeakCts   SNR AngSep     Name
#  [deg]    [deg]    ['] [deg]  [deg]                   [']
 43.8391  54.0900    2.7  45.5  -34.5   1.6763   4.3 ------	UNKNOWN
 50.4408  46.1530    3.3  50.6  -44.5   3.6807   3.4 ------	UNKNOWN
Pre-slew background subtracted image of 15-350 keV band
Time interval of the image:
-29.368000 26.060590

# RAcent  DECcent POSerr Theta    Phi  PeakCts   SNR AngSep     Name
#  [deg]    [deg]    ['] [deg]  [deg]                   [']
190.1073  83.8323    2.6  16.7   31.9   0.4351   4.4 ------	UNKNOWN
343.3602  82.1719    0.5  28.6   13.9   2.9036  23.7 ------	UNKNOWN
Post-slew image of 15-350 keV band
Time interval of the image:
80.660600 962.832100

# RAcent  DECcent POSerr Theta    Phi  PeakCts   SNR AngSep     Name
#  [deg]    [deg]    ['] [deg]  [deg]                   [']
326.1141  38.1904    6.0  44.4   43.4   3.3511   1.9    8.3	Cyg X-2
332.4821  37.3046    3.0  45.0   36.2   6.2032   3.8 ------	UNKNOWN
335.4767  41.4141    3.0  40.8   33.0   4.5489   3.9 ------	UNKNOWN
356.2407  42.7089    3.3  39.7    9.1   3.1586   3.5 ------	UNKNOWN
353.0786  59.6582    3.6  22.7   11.2   1.7956   3.2 ------	UNKNOWN
187.2648  45.9384    2.4  51.3 -177.2   8.2067   4.9 ------	UNKNOWN
166.8424  39.0542    4.9  58.8 -159.2  10.7539   2.3 ------	UNKNOWN
163.6483  38.4241    3.2  59.4 -156.3  18.6498   3.6 ------	UNKNOWN