Analysis Summary
Notes:
- 1) No attempt has been made to eliminate the non-significant decimal places.
- 2) This batgrbproduct analysis is done using the HEASARC data.
- 3) This batgrbproduct analysis is using the flight position for the mask-weighting calculation.
======================================================================
                  BAT GRB EVENT DATA PROCESSING REPORT
    Process Script Ver: batgrbproduct v2.46
    Process Start Time: Sun Jan 12 00:52:23 EST 2014
             Host Name: batevent1
   Current Working Dir: /local/data/batevent/batevent_reproc/trigger559139
======================================================================

  Trigger: 00559139      Segment: 000

  BAT Trigger Time: 394027261.376   [s; MET]
      Trigger Stop: 394027263.424   [s; MET]
               UTC: 2013-06-27T12:00:50.652640    [includes UTCF correction]
       Where From?: TDRSS position message

  BAT
    RA: 181.932229853194   Dec: -55.7299343575035  [deg; J2000]

     Catalogged Source?: NO
     Point Source?:      YES
     GRB Indicated?:     YES    [ by BAT flight software ]
     Image S/N Ratio:    9.71
     Image Trigger?:     NO
     Rate S/N Ratio:     9.8488578017961  [ if not an image trigger ]
     Image S/N Ratio:    9.71

  Analysis Position:   [ source = BAT ]
    RA: 181.932229853194   Dec: -55.7299343575035  [deg; J2000]

  Refined Position:   [ source = BAT pre-slew burst ]
    RA: 181.941429405079   Dec: -55.711410911521  [deg; J2000]
        { 12h 07m 45.9s , -55d 42' 41.1" }
         +/- 1.77330293293361 [arcmin] (estimated 90% radius based on SNR)
         +/- 0.669317702120276 [arcmin] (formal 1-sigma fit error)
    SNR: 13.4188157850946

  Angular difference between the analysis and refined position is 1.154069 arcmin

  Partial Coding Fraction: 0.953125    [ including projection effects ]

  Duration
     T90: 48 +/- 35.7770876399966
        Measured from: -15.3759999871254
                   to: 32.6240000128746     [s; relative to TRIGTIME]
     T50: 32 +/- 16
        Measured from: -15.3759999871254
                   to: 16.6240000128746     [s; relative to TRIGTIME]


  Fluence
     Peak Flux  (peak 1 second)
        Measured from: 8.1240000128746
                   to: 9.1240000128746     [s; relative to TRIGTIME]
     Total Fluence
        Measured from: -15.3759999871254
                   to: 48.6240000128746     [s; relative to TRIGTIME]

             Band 1     Band 2     Band 3     Band 4
              15-25      25-50     50-100    100-350     keV
 Total     0.453614   0.587924   0.361326   0.062114
           0.048637   0.050751   0.045570   0.042871 [error]
 Peak      0.018251   0.017612   0.006752   0.010097
           0.006398   0.006456   0.005674   0.005330 [error]

     [ fluence units of on-axis counts / fully illuminated detector ]

======================================================================


====== Table of the duration information =============================

        Value   tstart    tstop
T100   64.000  -15.376   48.624
T90    48.000  -15.376   32.624
T50    32.000  -15.376   16.624
Peak    1.000    8.124    9.124


====== Spectral Analysis Summary =====================================

Model      : spectral model: simple power-law (PL) and cutoff power-law (CPL)
Ph_index   : photon index: E^{Ph_index}
Ph_90err   : 90% error of the photon index
Epeak      : Epeak in keV
Epeak_90err: 90% error of Epeak
Norm       : normalization at 50 keV in both the PL model and CPL model
Nomr_90err : 90% error of the normalization
chi2       : Chi-Squared
dof        : degree of freedo

=== Time-averaged spectral analysis ===
(Best model with acceptable fit: PL)

Model Ph_index Ph_90err_low Ph_90err_hi  Epeak  Epeak_90err_low  Epeak_90err_hi  Norm       Nomr_90err_low    Norm_90err_hi    chi2    dof
PL      -1.751    -0.188      0.181       -           -               -         1.40e-03     -1.66e-04          1.63e-04      55.700   57
CPL     -0.901    -0.779      0.954       56.940     -12.777       111.748      4.13e-03     -2.57e-03          9.79e-03      52.190   56


=== 1-s peak spectral analysis ===
(Best model with acceptable fit: N/A)

Model Ph_index Ph_90err_low Ph_90err_hi  Epeak  Epeak_90err_low  Epeak_90err_hi  Norm       Nomr_90err_low    Norm_90err_hi    chi2    dof
PL      -2.163     -1.351     0.946       -           -               -         2.14e-03     -2.14e-03          1.43e-03      75.830   57
CPL     -2.153     -1.114     5.677       63.044      N/A           N/A         1.80e-03        N/A               N/A         75.650   56


=== Fluence/Peak Flux Summary ===

              Model    Band1     Band2     Band3     Band4     Band5     Total
                       15-25     25-50    50-100    100-350    15-150    15-350    keV
Fluence         PL   1.45e-07  2.28e-07  2.71e-07  6.25e-07  8.25e-07  1.27e-06   erg/cm2
      90%_error_low -2.14e-08 -2.30e-08 -4.34e-08 -1.82e-07 -1.01e-07 -2.29e-07   erg/cm2
      90%_error_hi   2.21e-08  2.30e-08  4.39e-08  2.26e-07  1.03e-07  2.65e-07   erg/cm2
Peak flux       PL   1.67e-01  1.14e-01  5.09e-02  3.15e-02  3.47e-01  3.63e-01   ph/cm2/s
      90%_error_low -1.67e-01 -6.01e-02 -4.09e-02 -3.15e-02 -1.49e-01 -1.61e-01   ph/cm2/s
      90%_error_hi   9.42e-02  5.15e-02  5.14e-02  1.01e-01  1.49e-01  1.67e-01   ph/cm2/s

Fluence        CPL   1.32e-07  2.51e-07  2.68e-07  1.76e-07  7.58e-07  8.26e-07   erg/cm2
      90%_error_low -2.51e-08 -3.10e-08 -5.10e-08 -1.16e-07 -1.10e-07 -1.63e-07   erg/cm2
      90%_error_hi   2.52e-08  3.22e-08  4.91e-08  3.73e-07  1.17e-07  3.82e-07   erg/cm2
Peak flux      CPL     N/A      N/A      N/A      N/A      N/A      N/A     ph/cm2/s
      90%_error_low -1.67e-01 -6.01e-02 -4.09e-02 -3.15e-02 -1.49e-01 -1.61e-01   ph/cm2/s
      90%_error_hi   9.42e-02  5.15e-02  5.14e-02  1.01e-01  1.49e-01  1.67e-01   ph/cm2/s

======================================================================
Image
Pre-slew 15.0-350.0 keV image (Event data)
#   RAcent    DECcent   POSerr    Theta     Phi              Peak Cts       SNR   Name
  181.9414   -55.7114   0.0144    18.7160   164.4849         1.4880837     13.419 TRIG_00559139

Foreground time interval of the image:
-15.376  48.624 (delta_t =  64.000 [sec])
Background time interval of the image:
-239.376 -15.376 (delta_t = 224.000 [sec])
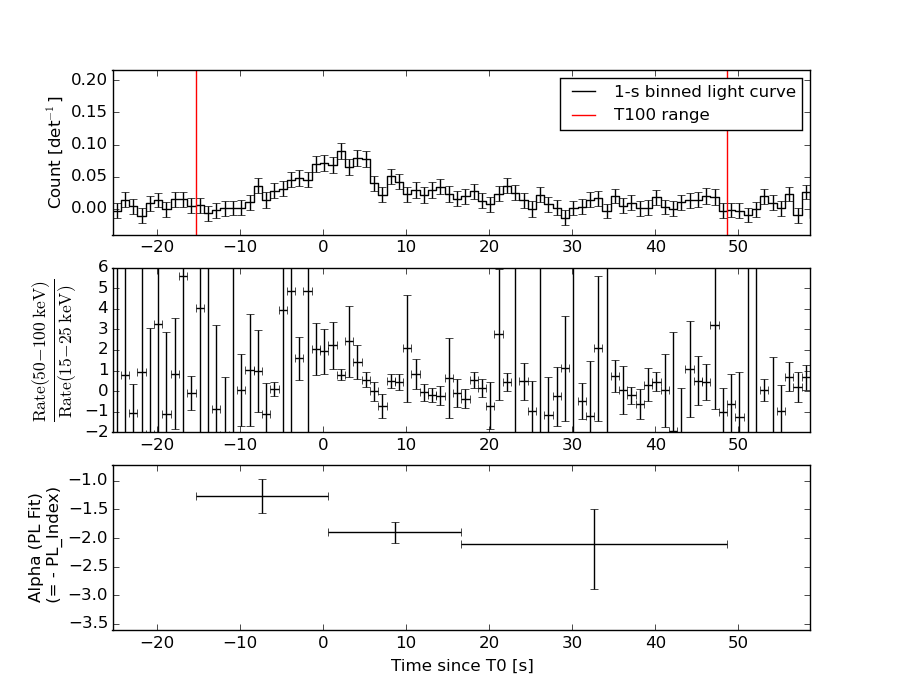
Light Curves
Note: The mask-weighted lightcurves have units of either count/det or counts/sec/det, where a det is 0.4 x 0.4 = 0.16 sq cm.
Full-time range; 1 s binning
Other quick-look light curves:
- 64 ms binning (zoomed)
- 16 ms binning (zoomed)
- 8 ms binning (zoomed)
- 2 ms binning (zoomed)
- SN=5 or 10 s binning (full-time range)
- Raw light curve
Spectra
- 64 ms binning (zoomed)
- 16 ms binning (zoomed)
- 8 ms binning (zoomed)
- 2 ms binning (zoomed)
- SN=5 or 10 s binning (full-time range)
- Raw light curve
Spectra
Notes:
- 1) The fitting includes the systematic errors.
- 2) When the burst includes telescope slew time periods, the fitting uses an average response file made from multiple 5-s response files through out the slew time plus single time preiod for the non-slew times, and weighted by the total counts in the corresponding time period using addrmf. An average response file is needed becuase a spectral fit using the pre-slew DRM will introduce some errors in both a spectral shape and a normalization if the PHA file contains a lot of the slew/post-slew time interval.
- 3) For fits to more complicated models (e.g. a power-law over a cutoff power-law), the BAT team has decided to require a chi-square improvement of more than 6 for each extra dof.
Time averaged spectrum fit using the average DRM
Power-law model
Time interval is from  -15.376 sec. to   48.624 sec.

Spectral model in power-law:
------------------------------------------------------------
Parameters  : value       lower 90%   higher 90%
Photon index: -1.75135     ( -0.187857   0.180513 )
Norm@50keV  : 1.39662E-03    ( -0.000166032   0.000163022 )
------------------------------------------------------------
#Fit statistic : Chi-Squared =          55.70 using 59 PHA bins.
# Reduced chi-squared =         0.9773 for     57 degrees of freedom
# Null hypothesis probability =   5.238171e-01

Photon flux (15-150 keV)    in 64 sec: 0.188950 ( -0.019066  0.019069 ) ph/cm2/s
Energy fluence (15-150 keV)             : 8.24838e-07 ( -1.00653e-07  1.0276e-07 ) ergs/cm2
Cutoff power-law model
Time interval is from  -15.376 sec. to   48.624 sec.
Spectral model in the cutoff power-law:
------------------------------------------------------------
Parameters  : value       lower 90%   higher 90%
Photon index: -0.901135     ( -0.779047   0.953638 )
Epeak [keV] : 56.9403      ( -12.777 111.748 )
Norm@50keV  : 4.13200E-03    ( -0.00256649   0.00979242 )
------------------------------------------------------------
#Fit statistic : Chi-Squared =          52.19 using 59 PHA bins.
# Reduced chi-squared =         0.9320 for     56 degrees of freedom
# Null hypothesis probability =   6.197353e-01

Photon flux (15-150 keV)    in 64 sec: 0.182195 ( -0.019974  0.019993 ) ph/cm2/s
Energy fluence (15-150 keV)             : 7.57581e-07 ( -1.10438e-07  1.17484e-07 ) ergs/cm2
1-s peak spectrum fit
Power-law model
Time interval is from    8.124 sec. to    9.124 sec.

Spectral model in power-law:
------------------------------------------------------------
Parameters  : value       lower 90%   higher 90%
Photon index: -2.16263     ( -1.35068   0.946296 )
Norm@50keV  : 2.13889E-03    ( -0.00213834   0.00143057 )
------------------------------------------------------------
#Fit statistic : Chi-Squared =          75.83 using 59 PHA bins.
# Reduced chi-squared =          1.330 for     57 degrees of freedom
# Null hypothesis probability =   4.840610e-02

Photon flux (15-150 keV)    in 1 sec: 0.347311 ( -0.149143  0.149037 ) ph/cm2/s
Energy fluence (15-150 keV)             : 2.00106e-08 ( -1.11946e-08  1.32776e-08 ) ergs/cm2
Cutoff power-law model
Time interval is from    8.124 sec. to    9.124 sec.
Spectral model in the cutoff power-law:
------------------------------------------------------------
Parameters  : value       lower 90%   higher 90%
Photon index: -2.15301     ( -1.11309   5.67721 )
Epeak [keV] : 63.0439      (   )
Norm@50keV  : 1.80127E-03    (     )
------------------------------------------------------------
#Fit statistic : Chi-Squared =          75.65 using 59 PHA bins.
# Reduced chi-squared =          1.351 for     56 degrees of freedom
# Null hypothesis probability =   4.124090e-02

Photon flux (15-150 keV)    in 1 sec:  (    ) ph/cm2/s
Energy fluence (15-150 keV)             : 1.27192e-08 ( -8.91862e-09  1.78934e-08 ) ergs/cm2
Time-resolved spectra
Distribution
T90 vs. Hardness ratio plot
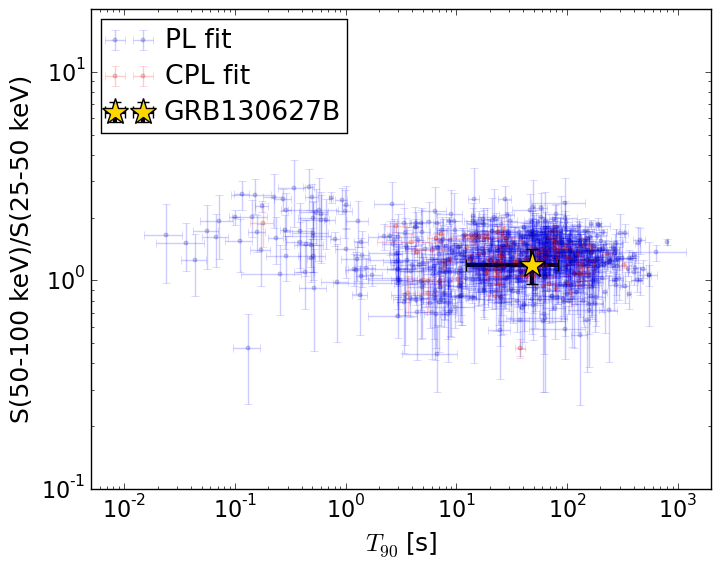
T90                                   = 48.0 sec.
Hardness ratio (energy fluence ratio) = 1.18811926793
S(15-50 keV) vs. S(50-150 keV) plot
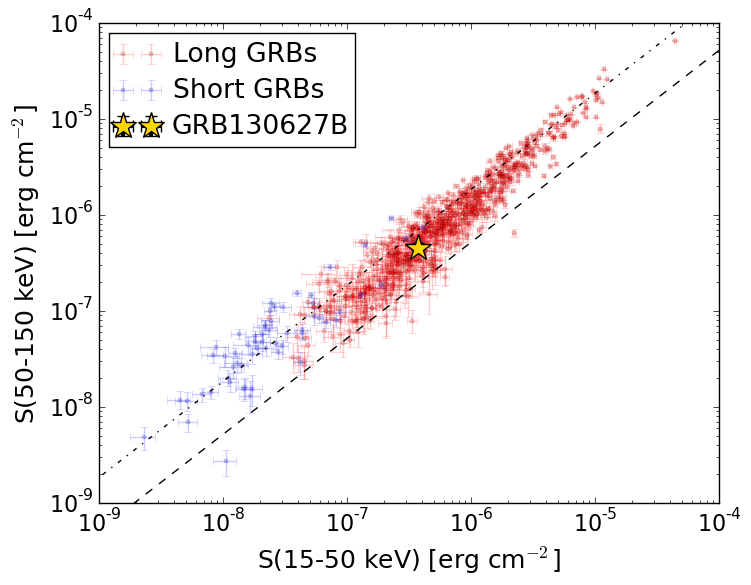
S(15-50 keV)  = 3.725347e-07
S(50-150 keV) = 4.523125e-07
The dash-dotted line and the dashed line traces the fluences calculated from the Band function with Epeak = 15 and 150 keV, respectively. Both lines assume a canonical values of alpha = -1 and beta = -2.5.
Mask shadow pattern
IMX = -3.264463825353017E-01, IMY = -9.062415982562974E-02
Spacecraft aspect plot
Bright source in the pre-burst/pre-slew/post-slew images
Pre-burst image of 15-350 keV band
Time interval of the image:
-239.376000 -15.376000

# RAcent  DECcent POSerr Theta    Phi  PeakCts   SNR AngSep     Name
#  [deg]    [deg]    ['] [deg]  [deg]                   [']
135.7538 -40.5787    0.0  37.6 -130.7  -0.6115  -1.7   10.4	Vela X-1
170.3957 -60.4721    5.6  25.0  176.5   0.4343   2.0    9.4	Cen X-3
186.5098 -62.8092    6.6  25.8  157.9   0.4260   1.8    4.7	GX 301-2
162.0372 -63.2984    1.9  29.5 -179.6   1.4262   6.1 ------	UNKNOWN
 96.7173 -56.1445    4.1  58.8 -159.3   4.6544   2.8 ------	UNKNOWN
175.7229  19.0834    3.9  56.8  -29.7   3.6408   2.9 ------	UNKNOWN
145.6715 -14.8987    3.7  40.9  -87.5   3.3848   3.1 ------	UNKNOWN
Pre-slew background subtracted image of 15-350 keV band
Time interval of the image:
-15.376000 48.624000

# RAcent  DECcent POSerr Theta    Phi  PeakCts   SNR AngSep     Name
#  [deg]    [deg]    ['] [deg]  [deg]                   [']
135.5132 -40.4741   11.3  37.8 -130.6   0.1839   1.0    4.9	Vela X-1
170.2910 -60.5632   27.7  25.1  176.5   0.0502   0.4    3.7	Cen X-3
186.4326 -62.8698    5.5  25.8  158.0   0.2617   2.1    8.6	GX 301-2
231.1228 -82.8988    2.1  48.3  153.2   2.1955   5.4 ------	UNKNOWN
181.9414 -55.7114    0.9  18.7  164.5   1.4880  13.4 ------	UNKNOWN
186.2524  -8.6393    2.1  28.5  -16.1   0.6337   5.4 ------	UNKNOWN
183.1271  12.6562    2.4  49.7  -21.5   1.2029   4.8 ------	UNKNOWN
Post-slew image of 15-350 keV band
Time interval of the image:
215.124600 898.524610

# RAcent  DECcent POSerr Theta    Phi  PeakCts   SNR AngSep     Name
#  [deg]    [deg]    ['] [deg]  [deg]                   [']
254.2636  35.2942    7.3  46.7 -167.5   1.5522   1.6    9.9	Her X-1
263.0188 -24.7546   26.4  34.9   92.5  -0.5372  -0.4    0.8	GX 1+4
268.4654  -1.4994    3.7  19.4  134.8   1.7147   3.1    6.5	SW J1753.5-0127
270.2281 -25.0934   10.9  30.8   83.1   1.0445   1.1    3.2	GX 5-1
270.3666 -25.8289    4.4  31.3   82.1   2.7328   2.6    6.2	GRS 1758-258
274.0831 -14.0185    2.8  19.9   93.3   2.3067   4.2    4.6	GX 17+2
275.9638 -30.4729   49.9  33.0   69.7   0.2395   0.2    6.7	H1820-303
285.0444 -24.7544   12.2  25.4   56.6   0.5656   0.9   10.0	HT1900.1-2455
288.8075  10.9443    0.8  10.5 -123.8   7.2051  15.0    0.5	GRS 1915+105
299.5558  35.2025    3.1  36.4 -112.9   4.2846   3.7    1.7	Cyg X-1
272.5821  16.6705    2.5  22.0 -171.3   2.3668   4.6 ------	UNKNOWN
244.7311  31.8429    2.3  51.3 -177.2   7.1759   5.0 ------	UNKNOWN
241.3451  41.6600    2.9  58.6 -168.6  11.9842   4.0 ------	UNKNOWN
289.2932  38.8182    3.2  38.3 -127.3   3.0937   3.6 ------	UNKNOWN
345.7728 -11.0288    4.2  58.8  -26.0  10.4132   2.8 ------	UNKNOWN