Analysis Summary
Notes:
- 1) No attempt has been made to eliminate the non-significant decimal places.
- 2) This batgrbproduct analysis is done using the HEASARC data.
- 3) This batgrbproduct analysis is using the flight position for the mask-weighting calculation.
======================================================================
                  BAT GRB EVENT DATA PROCESSING REPORT
    Process Script Ver: batgrbproduct v2.46
    Process Start Time: Wed Sep 10 17:19:51 EDT 2014
             Host Name: batevent1
   Current Working Dir: /local/data/batevent/batevent_reproc/trigger559482
======================================================================

  Trigger: 00559482      Segment: 000

  BAT Trigger Time: 394345074.368   [s; MET]
      Trigger Stop: 394345075.392   [s; MET]
               UTC: 2013-07-01T04:17:43.630460    [includes UTCF correction]
       Where From?: TDRSS position message

  BAT
    RA: 357.215620241738   Dec: 36.099431990312  [deg; J2000]

     Catalogged Source?: NO
     Point Source?:      YES
     GRB Indicated?:     YES    [ by BAT flight software ]
     Image S/N Ratio:    22.22
     Image Trigger?:     NO
     Rate S/N Ratio:     135.14806694881  [ if not an image trigger ]
     Image S/N Ratio:    22.22

  Analysis Position:   [ source = BAT ]
    RA: 357.215620241738   Dec: 36.099431990312  [deg; J2000]

  Refined Position:   [ source = BAT pre-slew burst ]
    RA: 357.223735416883   Dec: 36.099591237941  [deg; J2000]
        { 23h 48m 53.7s , +36d 05' 58.5" }
         +/- 0.758440690399934 [arcmin] (estimated 90% radius based on SNR)
         +/- 0.20031326778811 [arcmin] (formal 1-sigma fit error)
    SNR: 45.1501207219042

  Angular difference between the analysis and refined position is 0.393537 arcmin

  Partial Coding Fraction: 0.28125    [ including projection effects ]

  Duration
     T90: 4.37999993562698 +/- 0.252634126101044
        Measured from: -0.39599996805191
                   to: 3.98399996757507     [s; relative to TRIGTIME]
     T50: 2.32400000095367 +/- 0.130598592485389
        Measured from: 0.412000000476837
                   to: 2.73600000143051     [s; relative to TRIGTIME]


  Fluence
     Peak Flux  (peak 1 second)
        Measured from: 0.0600000023841858
                   to: 1.06000000238419     [s; relative to TRIGTIME]
     Total Fluence
        Measured from: -1.13999998569489
                   to: 5.3520000576973     [s; relative to TRIGTIME]

             Band 1     Band 2     Band 3     Band 4
              15-25      25-50     50-100    100-350     keV
 Total     1.590754   2.607478   2.030967   0.437232
           0.046383   0.055394   0.049608   0.030825 [error]
 Peak      0.375108   0.725822   0.700676   0.184274
           0.021307   0.027512   0.027125   0.016700 [error]

     [ fluence units of on-axis counts / fully illuminated detector ]

======================================================================


====== Table of the duration information =============================

        Value   tstart    tstop
T100    6.492   -1.140    5.352
T90     4.380   -0.396    3.984
T50     2.324    0.412    2.736
Peak    1.000    0.060    1.060


====== Spectral Analysis Summary =====================================

Model      : spectral model: simple power-law (PL) and cutoff power-law (CPL)
Ph_index   : photon index: E^{Ph_index}
Ph_90err   : 90% error of the photon index
Epeak      : Epeak in keV
Epeak_90err: 90% error of Epeak
Norm       : normalization at 50 keV in both the PL model and CPL model
Nomr_90err : 90% error of the normalization
chi2       : Chi-Squared
dof        : degree of freedo

=== Time-averaged spectral analysis ===
(Best model with acceptable fit: CPL)

Model Ph_index Ph_90err_low Ph_90err_hi  Epeak  Epeak_90err_low  Epeak_90err_hi  Norm       Nomr_90err_low    Norm_90err_hi    chi2    dof
PL      -1.579    -0.045      0.045       -           -               -         7.40e-02     -1.98e-03          1.98e-03      76.370   57
CPL     -0.903    -0.201      0.210       89.162      -9.351        15.363      1.52e-01     -2.87e-02          3.72e-02      40.050   56


=== 1-s peak spectral analysis ===
(Best model with acceptable fit: N/A)

Model Ph_index Ph_90err_low Ph_90err_hi  Epeak  Epeak_90err_low  Epeak_90err_hi  Norm       Nomr_90err_low    Norm_90err_hi    chi2    dof
PL      -1.268     -0.067     0.067       -           -               -         1.44e-01     -5.98e-03          5.99e-03      72.190   57
CPL     -0.656     -0.282     0.301      122.632     -23.318        55.874      2.77e-01     -7.04e-02          1.01e-01      57.450   56


=== Fluence/Peak Flux Summary ===

              Model    Band1     Band2     Band3     Band4     Band5     Total
                       15-25     25-50    50-100    100-350    15-150    15-350    keV
Fluence         PL   6.60e-07  1.16e-06  1.55e-06  4.25e-06  4.51e-06  7.62e-06   erg/cm2
      90%_error_low -3.24e-08 -3.49e-08 -4.95e-08 -2.86e-07 -1.24e-07 -3.20e-07   erg/cm2
      90%_error_hi   3.29e-08  3.48e-08  4.94e-08  2.99e-07  1.24e-07  3.29e-07   erg/cm2
Peak flux       PL   4.75e+00  5.49e+00  4.56e+00  6.37e+00  1.71e+01  2.12e+01   ph/cm2/s
      90%_error_low -3.60e-01 -2.65e-01 -2.15e-01 -5.90e-01 -7.39e-01 -9.01e-01   ph/cm2/s
      90%_error_hi   3.69e-01  2.64e-01  2.14e-01  6.23e-01  7.39e-01  9.04e-01   ph/cm2/s

Fluence        CPL   5.66e-07  1.21e-06  1.65e-06  2.01e-06  4.38e-06  5.44e-06   erg/cm2
      90%_error_low -4.02e-08 -3.98e-08 -5.93e-08 -3.59e-07 -1.32e-07 -3.74e-07   erg/cm2
      90%_error_hi   4.11e-08  4.01e-08  5.97e-08  4.53e-07  1.31e-07  4.58e-07   erg/cm2
Peak flux      CPL   2.83e+00  1.96e+00  9.36e-01  7.66e-01  6.05e+00  6.47e+00   ph/cm2/s
      90%_error_low -5.65e-01 -3.82e-01 -1.74e-01 -8.51e-02 -1.29e+00 -1.41e+00   ph/cm2/s
      90%_error_hi   5.79e-01  4.05e-01  2.05e-01  2.09e-01  1.28e+00  1.33e+00   ph/cm2/s

======================================================================
Image
Pre-slew 15.0-350.0 keV image (Event data)
#   RAcent    DECcent   POSerr    Theta     Phi              Peak Cts       SNR   Name
  357.2237    36.0996   0.0042    41.1652  -130.2012         7.0458895     45.150 TRIG_00559482

Foreground time interval of the image:
 -1.140   5.352 (delta_t =   6.492 [sec])
Background time interval of the image:
-239.368  -1.140 (delta_t = 238.228 [sec])
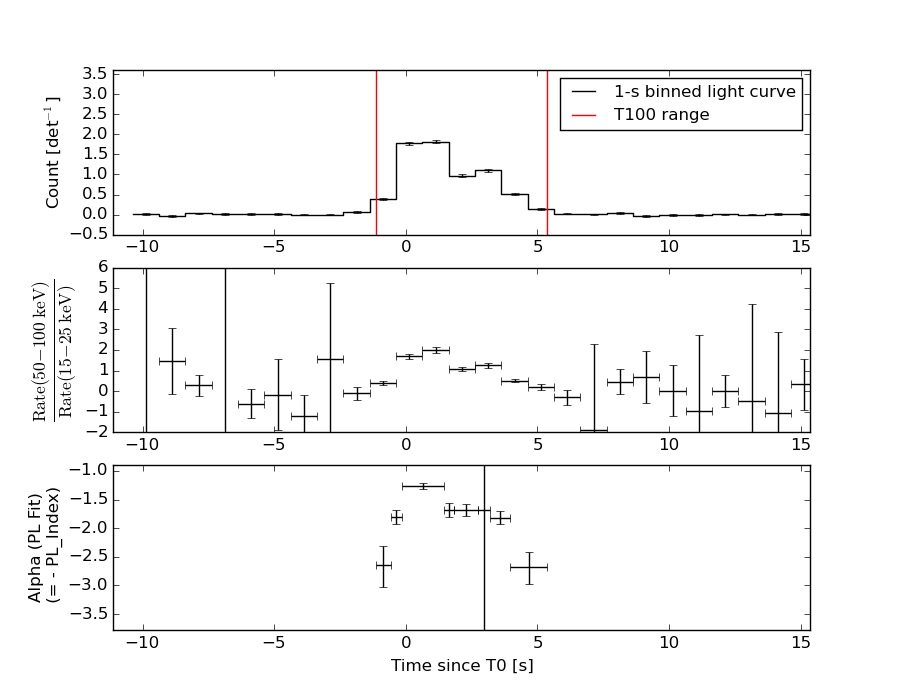
Light Curves
Note: The mask-weighted lightcurves have units of either count/det or counts/sec/det, where a det is 0.4 x 0.4 = 0.16 sq cm.
Full-time range; 1 s binning
Other quick-look light curves:
- 64 ms binning (zoomed)
- 16 ms binning (zoomed)
- 8 ms binning (zoomed)
- 2 ms binning (zoomed)
- SN=5 or 10 s binning (full-time range)
- Raw light curve
Spectra
- 64 ms binning (zoomed)
- 16 ms binning (zoomed)
- 8 ms binning (zoomed)
- 2 ms binning (zoomed)
- SN=5 or 10 s binning (full-time range)
- Raw light curve
Spectra
Notes:
- 1) The fitting includes the systematic errors.
- 2) When the burst includes telescope slew time periods, the fitting uses an average response file made from multiple 5-s response files through out the slew time plus single time preiod for the non-slew times, and weighted by the total counts in the corresponding time period using addrmf. An average response file is needed becuase a spectral fit using the pre-slew DRM will introduce some errors in both a spectral shape and a normalization if the PHA file contains a lot of the slew/post-slew time interval.
- 3) For fits to more complicated models (e.g. a power-law over a cutoff power-law), the BAT team has decided to require a chi-square improvement of more than 6 for each extra dof.
Time averaged spectrum fit using the average DRM
Power-law model
Time interval is from   -1.140 sec. to    5.352 sec.

Spectral model in power-law:
------------------------------------------------------------
Parameters  : value       lower 90%   higher 90%
Photon index: -1.5787     ( -0.0454658   0.0453813 )
Norm@50keV  : 7.39963E-02    ( -0.00197593   0.00197582 )
------------------------------------------------------------
#Fit statistic : Chi-Squared =          76.37 using 59 PHA bins.
# Reduced chi-squared =          1.340 for     57 degrees of freedom
# Null hypothesis probability =   4.432090e-02

Photon flux (15-150 keV)    in 6.492 sec: 9.44752 ( -0.27869  0.27931 ) ph/cm2/s
Energy fluence (15-150 keV)             : 4.50535e-06 ( -1.24197e-07  1.24197e-07 ) ergs/cm2
Cutoff power-law model
Time interval is from   -1.140 sec. to    5.352 sec.
Spectral model in the cutoff power-law:
------------------------------------------------------------
Parameters  : value       lower 90%   higher 90%
Photon index: -0.902599     ( -0.200912   0.210102 )
Epeak [keV] : 89.1621      ( -9.35093 15.3628 )
Norm@50keV  : 0.152299    ( -0.0287345   0.0372382 )
------------------------------------------------------------
#Fit statistic : Chi-Squared =          40.05 using 59 PHA bins.
# Reduced chi-squared =         0.7152 for     56 degrees of freedom
# Null hypothesis probability =   9.468694e-01

Photon flux (15-150 keV)    in 6.492 sec: 9.09207 ( -0.29291  0.29402 ) ph/cm2/s
Energy fluence (15-150 keV)             : 4.37621e-06 ( -1.31595e-07  1.31213e-07 ) ergs/cm2
1-s peak spectrum fit
Power-law model
Time interval is from    0.060 sec. to    1.060 sec.

Spectral model in power-law:
------------------------------------------------------------
Parameters  : value       lower 90%   higher 90%
Photon index: -1.26808     ( -0.0671409   0.0672229 )
Norm@50keV  : 0.144177    ( -0.0059853   0.00598526 )
------------------------------------------------------------
#Fit statistic : Chi-Squared =          72.19 using 59 PHA bins.
# Reduced chi-squared =          1.267 for     57 degrees of freedom
# Null hypothesis probability =   8.465227e-02

Photon flux (15-150 keV)    in 1 sec: 17.1038 ( -0.7386  0.7393 ) ph/cm2/s
Energy fluence (15-150 keV)             : 1.43632e-06 ( -6.4175e-08  6.42975e-08 ) ergs/cm2
Cutoff power-law model
Time interval is from    0.060 sec. to    1.060 sec.
Spectral model in the cutoff power-law:
------------------------------------------------------------
Parameters  : value       lower 90%   higher 90%
Photon index: -0.655967     ( -0.281713   0.300529 )
Epeak [keV] : 122.632      ( -23.3173 55.8743 )
Norm@50keV  : 0.277369    ( -0.0704392   0.101206 )
------------------------------------------------------------
#Fit statistic : Chi-Squared =          57.45 using 59 PHA bins.
# Reduced chi-squared =          1.026 for     56 degrees of freedom
# Null hypothesis probability =   4.213166e-01

Photon flux (15-150 keV)    in 1 sec: 6.05113 ( -1.28509  1.28412 ) ph/cm2/s
Energy fluence (15-150 keV)             : 1.40984e-06 ( -6.68586e-08  6.66823e-08 ) ergs/cm2
Time-resolved spectra
Distribution
T90 vs. Hardness ratio plot
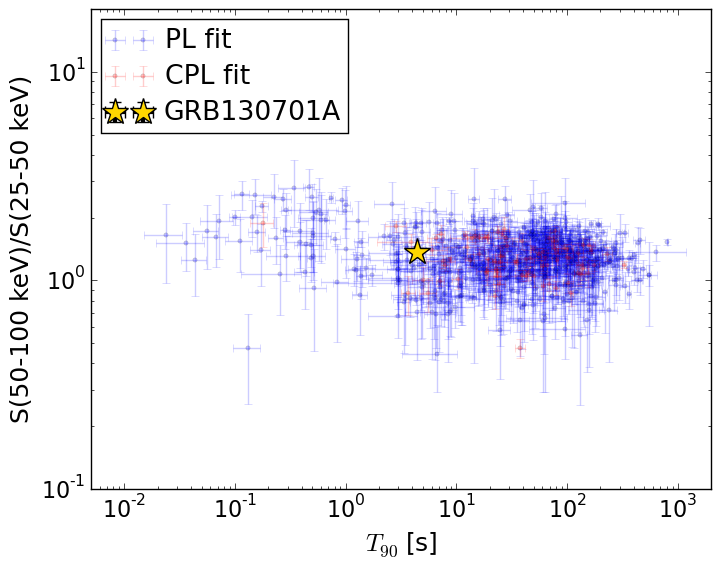
T90                                   = 4.38 sec.
Hardness ratio (energy fluence ratio) = 1.3623543616
S(15-50 keV) vs. S(50-150 keV) plot
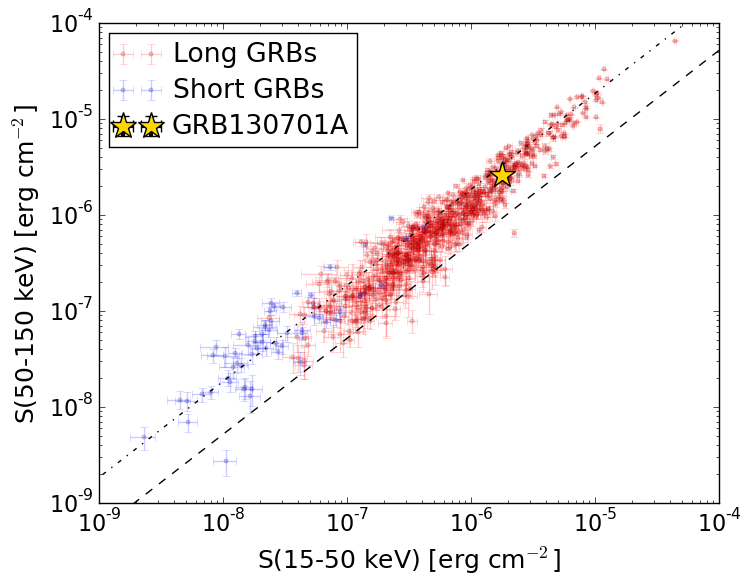
S(15-50 keV)  = 1.7801215e-06
S(50-150 keV) = 2.5960666e-06
The dash-dotted line and the dashed line traces the fluences calculated from the Band function with Epeak = 15 and 150 keV, respectively. Both lines assume a canonical values of alpha = -1 and beta = -2.5.
Mask shadow pattern
IMX = -5.643777236738406E-01, IMY = 6.678219948756898E-01
Spacecraft aspect plot
Bright source in the pre-burst/pre-slew/post-slew images
Pre-burst image of 15-350 keV band
Time interval of the image:
-239.368000 -1.140000

# RAcent  DECcent POSerr Theta    Phi  PeakCts   SNR AngSep     Name
#  [deg]    [deg]    ['] [deg]  [deg]                   [']
299.7182  35.2290   11.9  48.0  162.7   0.6311   1.0    6.5	Cyg X-1
307.9691  40.9329    5.0  47.4  174.4   1.1179   2.3    6.5	Cyg X-3
326.1664  38.3472    6.9  38.8 -168.9   0.4665   1.7    1.6	Cyg X-2
293.5343   6.7438    2.1  42.0  122.0   4.7854   5.6 ------	UNKNOWN
324.4688 -49.8433    4.3  51.1   31.2   3.0710   2.7 ------	UNKNOWN
339.6856 -21.8095    2.8  22.6   11.3   0.8404   4.1 ------	UNKNOWN
 19.3854 -41.2326    3.1  57.7  -16.0   3.7922   3.7 ------	UNKNOWN
  9.2759 -15.3222    2.5  37.2  -41.2   1.3562   4.5 ------	UNKNOWN
 23.2843 -17.4297    3.8  50.6  -44.5   3.6390   3.0 ------	UNKNOWN
  0.2045  46.3895    2.7  51.0 -135.6   4.8233   4.2 ------	UNKNOWN
Pre-slew background subtracted image of 15-350 keV band
Time interval of the image:
-1.140000 5.352000

# RAcent  DECcent POSerr Theta    Phi  PeakCts   SNR AngSep     Name
#  [deg]    [deg]    ['] [deg]  [deg]                   [']
299.6031  35.1971   13.9  48.0  162.6   0.1176   0.8    0.7	Cyg X-1
308.1539  40.7937    5.7  47.2  174.4   0.2269   2.0    9.7	Cyg X-3
326.1232  38.1434    0.0  38.6 -169.1  -0.0132  -0.2   10.9	Cyg X-2
357.2237  36.0996    0.3  41.2 -130.2   7.0462  45.2 ------	UNKNOWN
Post-slew image of 15-350 keV band
Time interval of the image:
74.332600 962.694400

# RAcent  DECcent POSerr Theta    Phi  PeakCts   SNR AngSep     Name
#  [deg]    [deg]    ['] [deg]  [deg]                   [']
299.4395  35.2120    5.2  46.2  133.2  -1.5205  -2.2    7.4	Cyg X-1
308.1175  40.9567   18.5  38.2  139.1   0.2034   0.6    0.4	Cyg X-3
326.1761  38.3155  129.5  24.7  130.9   0.0157   0.1    0.4	Cyg X-2
311.6410  23.9793    2.5  40.9  112.1   2.6542   4.6 ------	UNKNOWN
301.7816  76.1833    2.2  47.0 -169.2   1.3482   5.3 ------	UNKNOWN
200.2582  84.0522    3.3  59.4 -156.3   3.2461   3.5 ------	UNKNOWN
109.6091  85.3252    2.5  55.8 -148.4   4.0181   4.5 ------	UNKNOWN
 49.4744  38.7159    3.2  41.0  -83.6   2.3148   3.6 ------	UNKNOWN