Analysis Summary
Notes:
- 1) No attempt has been made to eliminate the non-significant decimal places.
- 2) This batgrbproduct analysis is done using the HEASARC data.
- 3) This batgrbproduct analysis is using the flight position for the mask-weighting calculation.
==========================================================================
           BAT GROUND-DETECTED GRB DATA PROCESSING REPORT
    Process Script Ver: batgrbproduct v2.46
    Process Start Time: Mon Apr 13 01:27:17 EDT 2015
             Host Name: bat1
   Current Working Dir: /local/data/bat1/alien/Swift_3rdBATcatalog/event/ground_detect_bursts/scripts
======================================================================

  Trigger: 00560515      Segment: 000

  BAT Trigger Time: 394976593.6
               UTC: 2013-07-08T11:43:02.834   [includes UTCF correction]
       Where From?: Ground analysis (best_duration.txt)
  NOTE: BAT trigger time for ground-detected burst is the T100 start time.

  Analysis Position:   [ source = BAT ]
    RA: 17.474   Dec: 0.003  [deg; J2000]

  Refined Position:   [ source = BAT pre-slew burst ]
    RA: 17.4801287559481   Dec: -0.00695842523161065  [deg; J2000]
        { 01h 09m 55.2s , -00d 00' 25.1" }
         +/- 2.23140657830108 [arcmin] (estimated 90% radius based on SNR)
         +/- 1.39204435978928 [arcmin] (formal 1-sigma fit error)
    SNR: 9.66381918776299

  Angular difference between the analysis and refined position is 0.701594 arcmin

  Partial Coding Fraction: 0.06542969    [ including projection effects ]

  Duration
     T90: 11.1999999880791 +/- 1.6
        Measured from: 0
                   to: 11.2     [s; relative to TRIGTIME]
     T50: 6.40000003576279 +/- 1.6
        Measured from: 1.6
                   to: 8     [s; relative to TRIGTIME]


====== Table of the duration information =============================

        Value   tstart    tstop
T100   11.200    0.000   11.200
T90    11.200    0.000   11.200
T50     6.400    1.600    8.000
Peak    1.000    1.900    2.900


====== Spectral Analysis Summary =====================================

Model      : spectral model: simple power-law (PL) and cutoff power-law (CPL)
Ph_index   : photon index: E^{Ph_index}
Ph_90err   : 90% error of the photon index
Epeak      : Epeak in keV
Epeak_90err: 90% error of Epeak
Norm       : normalization at 50 keV in both the PL model and CPL model
Nomr_90err : 90% error of the normalization
chi2       : Chi-Squared
dof        : degree of freedo

=== Time-averaged spectral analysis ===
(Best model with acceptable fit: PL)

Model Ph_index Ph_90err_low Ph_90err_hi  Epeak  Epeak_90err_low  Epeak_90err_hi  Norm       Nomr_90err_low    Norm_90err_hi    chi2    dof
PL      -1.135    -0.258      0.269       -           -               -         1.31e-02     -2.09e-03          2.09e-03      49.650   57
CPL      0.229    -1.251      1.764       85.544     -24.000       293.748      5.93e-02     -5.93e-02          3.47e-01      46.130   56


=== 1-s peak spectral analysis ===
(Best model with acceptable fit: N/A)

Model Ph_index Ph_90err_low Ph_90err_hi  Epeak  Epeak_90err_low  Epeak_90err_hi  Norm       Nomr_90err_low    Norm_90err_hi    chi2    dof
PL      -0.374     -1.009     0.374       -           -               -         7.51e-03     -7.51e-03          5.83e-03      66.070   57
CPL     -0.269     -3.868     5.112      989.450    -989.450      -989.450      8.37e-03     -8.37e-03          -8.37e-03      66.110   56


=== Fluence/Peak Flux Summary ===

              Model    Band1     Band2     Band3     Band4     Band5     Total
                       15-25     25-50    50-100    100-350    15-150    15-350    keV
Fluence         PL   1.00e-07  2.31e-07  4.20e-07  1.82e-06  1.14e-06  2.57e-06   erg/cm2
      90%_error_low -2.90e-08 -4.35e-08 -7.53e-08 -6.19e-07 -1.94e-07 -6.78e-07   erg/cm2
      90%_error_hi   3.18e-08  4.27e-08  7.46e-08  8.17e-07  1.95e-07  8.44e-07   erg/cm2
Peak flux       PL   1.06e-01  2.11e-01  3.26e-01  1.10e+00  9.11e-01  1.75e+00   ph/cm2/s
      90%_error_low -1.06e-01 -2.11e-01 -3.26e-01 -1.10e+00 -9.11e-01 -8.25e-01   ph/cm2/s
      90%_error_hi   2.93e-01  2.62e-01  1.63e-01  4.04e+00  6.24e-01  3.57e+00   ph/cm2/s

Fluence        CPL   7.66e-08  2.59e-07  4.61e-07  3.99e-07  1.04e-06  1.20e-06   erg/cm2
      90%_error_low -3.31e-08 -5.35e-08 -9.01e-08 -2.89e-07 -2.21e-07 -3.54e-07   erg/cm2
      90%_error_hi   3.76e-08  5.68e-08  9.18e-08  1.14e-06  2.22e-07  1.12e-06   erg/cm2
Peak flux      CPL   1.07e-01  2.35e-01  3.27e-01  1.11e+00  9.33e-01  1.73e+00   ph/cm2/s
      90%_error_low     N/A   -2.35e-01 -3.27e-01     N/A   -9.33e-01     N/A     ph/cm2/s
      90%_error_hi      N/A    2.38e-01  2.80e-01     N/A    6.38e-01     N/A     ph/cm2/s

======================================================================
Image
15.0-350.0 keV image (Event data)
#RAcent DECcent POSerr Theta  Phi  Peak_Cts  SNR Name
17.480 -0.007 0.020 41.164 120.279 1.434 9.664 TRIG_00560515

Image time interval: 0.866 to 8.470 [sec]
Light Curves
Note: The mask-weighted lightcurves have units of either count/det or counts/sec/det, where a det is 0.4 x 0.4 = 0.16 sq cm.
Best duration plot
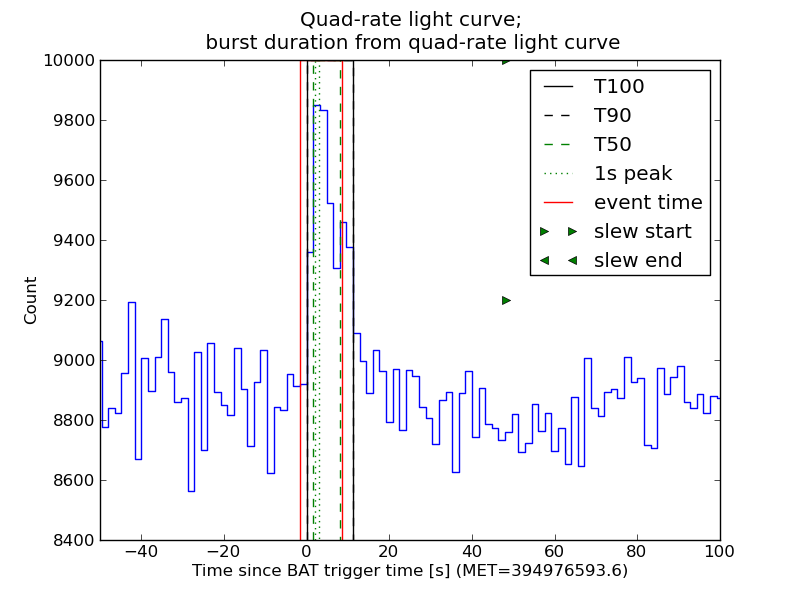
Full-time range; 1 s binning
Other quick-look light curves:
- 64 ms binning (zoomed)
- 16 ms binning (zoomed)
- 8 ms binning (zoomed)
- 2 ms binning (zoomed)
- SN=5 or 10 s binning (full-time range)
- Raw light curve
Spectra
- 64 ms binning (zoomed)
- 16 ms binning (zoomed)
- 8 ms binning (zoomed)
- 2 ms binning (zoomed)
- SN=5 or 10 s binning (full-time range)
- Raw light curve
Spectra
Notes:
- 1) The fitting includes the systematic errors.
- 2) When the burst includes telescope slew time periods, the fitting uses an average response file made from multiple 5-s response files through out the slew time plus single time preiod for the non-slew times, and weighted by the total counts in the corresponding time period using addrmf. An average response file is needed becuase a spectral fit using the pre-slew DRM will introduce some errors in both a spectral shape and a normalization if the PHA file contains a lot of the slew/post-slew time interval.
- 3) For fits to more complicated models (e.g. a power-law over a cutoff power-law), the BAT team has decided to require a chi-square improvement of more than 6 for each extra dof.
Time averaged spectrum fit using the average DRM
Power-law model

Time interval is from    0.000 sec. to    8.448 sec.

Spectral model in power-law:
------------------------------------------------------------
Parameters  : value       lower 90%   higher 90%
Photon index: -1.13507     ( -0.258214   0.268767 )
Norm@50keV  : 1.30680E-02    ( -0.00208904   0.00208555 )
------------------------------------------------------------
#Fit statistic : Chi-Squared =          49.65 using 59 PHA bins.
# Reduced chi-squared =         0.8710 for     57 degrees of freedom
# Null hypothesis probability =   7.446270e-01

Photon flux (15-150 keV)    in 8.448 sec: 1.52140 ( -0.25098  0.25228 ) ph/cm2/s
Energy fluence (15-150 keV)             : 1.14173e-06 ( -1.93762e-07  1.95462e-07 ) ergs/cm2
Cutoff power-law model

Time interval is from    0.000 sec. to    8.448 sec.
Spectral model in the cutoff power-law:
------------------------------------------------------------
Parameters  : value       lower 90%   higher 90%
Photon index: 0.22931     ( -1.25062   1.76431 )
Epeak [keV] : 85.5440      ( -23.9997 293.748 )
Norm@50keV  : 5.92742E-02    ( -0.0592742   0.347382 )
------------------------------------------------------------
#Fit statistic : Chi-Squared =          46.13 using 59 PHA bins.
# Reduced chi-squared =         0.8238 for     56 degrees of freedom
# Null hypothesis probability =   8.237384e-01

Photon flux (15-150 keV)    in 8.448 sec: 1.44315 ( -0.26079  0.2627 ) ph/cm2/s
Energy fluence (15-150 keV)             : 1.03924e-06 ( -2.20522e-07  2.21612e-07 ) ergs/cm2
1-s peak spectrum fit
Power-law model
Time interval is from    1.900 sec. to    2.900 sec.

Spectral model in power-law:
------------------------------------------------------------
Parameters  : value       lower 90%   higher 90%
Photon index: -0.373942     ( -1.00871   0.373858 )
Norm@50keV  : 7.50778E-03    ( -0.00750715   0.00582873 )
------------------------------------------------------------
#Fit statistic : Chi-Squared =          66.07 using 59 PHA bins.
# Reduced chi-squared =          1.159 for     57 degrees of freedom
# Null hypothesis probability =   1.921641e-01

Photon flux (15-150 keV)    in 1 sec: 0.910578 ( -0.910578  0.623732 ) ph/cm2/s
Energy fluence (15-150 keV)             : 1.07758e-07 ( -1.02328e-07  4.86756e-08 ) ergs/cm2
Cutoff power-law model
Time interval is from    1.900 sec. to    2.900 sec.
Spectral model in the cutoff power-law:
------------------------------------------------------------
Parameters  : value       lower 90%   higher 90%
Photon index: -0.361199     ( -3.86792   5.1115 )
Epeak [keV] : 1.00000E+04      ( -10000 -10000 )
Norm@50keV  : 7.57073E-03    ( -0.00757176   -0.00757176 )
------------------------------------------------------------
#Fit statistic : Chi-Squared =          66.07 using 59 PHA bins.
# Reduced chi-squared =          1.180 for     56 degrees of freedom
# Null hypothesis probability =   1.679451e-01

Photon flux (15-150 keV)    in 1 sec: 0.933137 ( -0.933137  0.637533 ) ph/cm2/s
Energy fluence (15-150 keV)             : 1.08208e-07 ( -5.29812e-08  5.2087e-08 ) ergs/cm2
Time-resolved spectra

Distribution
T90 vs. Hardness ratio plot
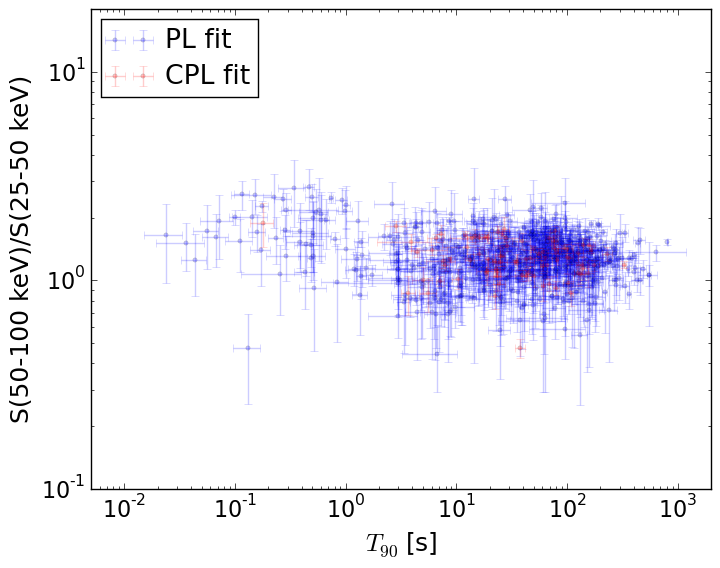
T90                                   = N/A sec.
Hardness ratio (energy fluence ratio) = N/A
S(15-50 keV) vs. S(50-150 keV) plot
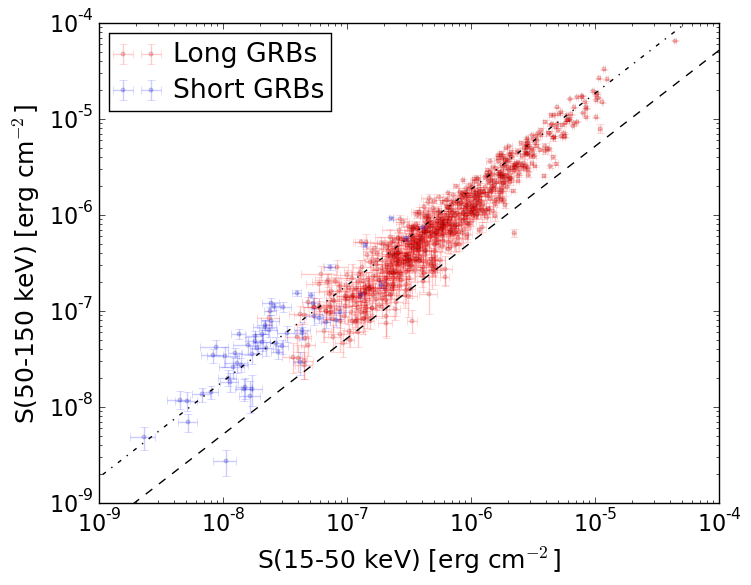
S(15-50 keV)  = N/A
S(50-150 keV) = N/A
The dash-dotted line and the dashed line traces the fluences calculated from the Band function with Epeak = 15 and 150 keV, respectively. Both lines assume a canonical values of alpha = -1 and beta = -2.5.
Mask shadow pattern
IMX = -0.440844663506, IMY = -0.755043976376
Spacecraft aspect plot
Bright source in the event data image
Event data image of 15-350 keV band
Time interval of the image:
0.866000 8.470000

# RAcent  DECcent POSerr Theta    Phi  PeakCts   SNR AngSep     Name
#  [deg]    [deg]    ['] [deg]  [deg]                   [']
 83.5937  21.9005    2.4  30.9  -96.7   0.2711   4.8    7.2	Crab
 24.1724 -16.2373    2.7  39.0   93.1   0.6467   4.2 ------	UNKNOWN
 17.4801  -0.0069    1.3  41.2  120.3   1.4336   8.7 ------	UNKNOWN
 55.8098 -34.8368    2.4  37.7   37.2   0.3588   4.9 ------	UNKNOWN
Webpage updated on:
Sun Jun 21 01:06:09 EDT 2015