Analysis Summary
Notes:
- 1) No attempt has been made to eliminate the non-significant decimal places.
- 2) This batgrbproduct analysis is done using the HEASARC data.
- 3) This batgrbproduct analysis is using the flight position for the mask-weighting calculation.
======================================================================
BAT GRB EVENT DATA PROCESSING REPORT
Process Script Ver: batgrbproduct v2.46
Process Start Time: Sun Jan 12 00:44:31 EST 2014
Host Name: batevent1
Current Working Dir: /local/data/batevent/batevent_reproc/trigger561974
======================================================================
Trigger: 00561974 Segment: 000
BAT Trigger Time: 395663824.256 [s; MET]
Trigger Stop: 395663824.768 [s; MET]
UTC: 2013-07-16T10:36:53.459220 [includes UTCF correction]
Where From?: TDRSS position message
BAT
RA: 179.547406394627 Dec: 63.0656816836336 [deg; J2000]
Catalogged Source?: NO
Point Source?: YES
GRB Indicated?: YES [ by BAT flight software ]
Image S/N Ratio: 7.64
Image Trigger?: NO
Rate S/N Ratio: 27.8747197295327 [ if not an image trigger ]
Image S/N Ratio: 7.64
Analysis Position: [ source = BAT ]
RA: 179.547406394627 Dec: 63.0656816836336 [deg; J2000]
Refined Position: [ source = BAT pre-slew burst ]
RA: 179.547 Dec: 63.0657 [deg; J2000]
{ 11h 58m 11.3s , +63d 03' 56.5" }
+/- 2.62718612864 [arcmin] (estimated 90% radius based on SNR)
SNR: 7.65424863938
Angular difference between the analysis and refined position is 0.011100 arcmin
Partial Coding Fraction: 0.6328125 [ including projection effects ]
Duration
T90: 87.6719999909401 +/- 19.9059138688552
Measured from: 0.11599999666214
to: 87.7879999876022 [s; relative to TRIGTIME]
T50: 63.0159999728203 +/- 37.071669430004
Measured from: 2.37999999523163
to: 65.3959999680519 [s; relative to TRIGTIME]
Fluence
Peak Flux (peak 1 second)
Measured from: -0.0259999632835388
to: 0.974000036716461 [s; relative to TRIGTIME]
Total Fluence
Measured from: 0.0200000405311584
to: 106.756000041962 [s; relative to TRIGTIME]
Band 1 Band 2 Band 3 Band 4
15-25 25-50 50-100 100-350 keV
Total 0.028692 0.200758 0.184737 0.037264
0.061939 0.063724 0.056044 0.048882 [error]
Peak 0.029849 0.030058 0.049178 0.025473
0.007794 0.008299 0.007794 0.007134 [error]
[ fluence units of on-axis counts / fully illuminated detector ]
======================================================================
====== Table of the duration information =============================
Value tstart tstop
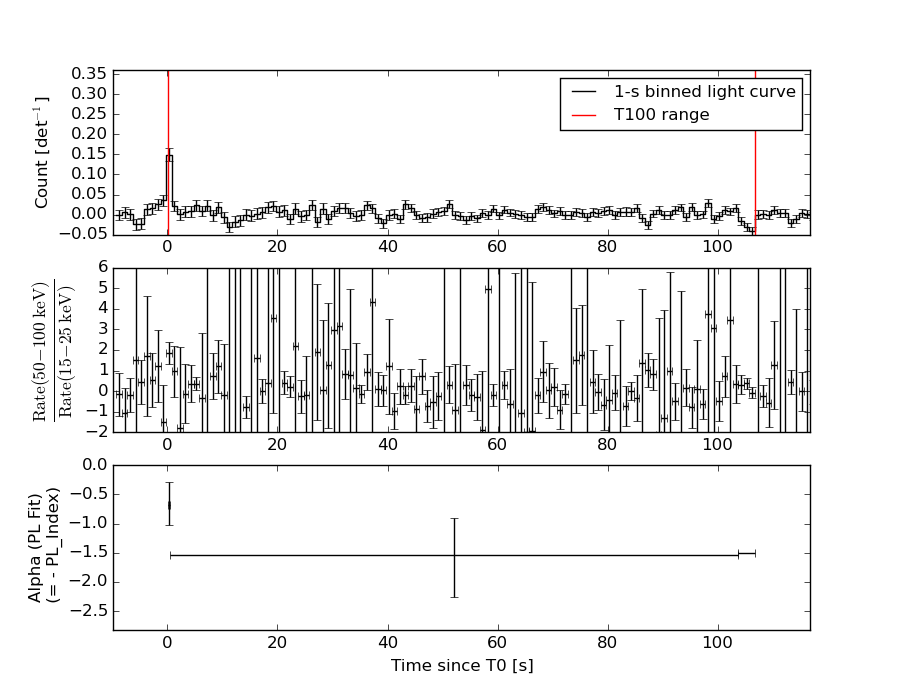
T100 106.736 0.020 106.756
T90 87.672 0.116 87.788
T50 63.016 2.380 65.396
Peak 1.000 -0.026 0.974
====== Spectral Analysis Summary =====================================
Model : spectral model: simple power-law (PL) and cutoff power-law (CPL)
Ph_index : photon index: E^{Ph_index}
Ph_90err : 90% error of the photon index
Epeak : Epeak in keV
Epeak_90err: 90% error of Epeak
Norm : normalization at 50 keV in both the PL model and CPL model
Nomr_90err : 90% error of the normalization
chi2 : Chi-Squared
dof : degree of freedo
=== Time-averaged spectral analysis ===
(Best model with acceptable fit: PL)
Model Ph_index Ph_90err_low Ph_90err_hi Epeak Epeak_90err_low Epeak_90err_hi Norm Nomr_90err_low Norm_90err_hi chi2 dof
PL -1.317 -0.643 0.634 - - - 3.13e-04 -1.14e-04 1.13e-04 41.920 57
CPL 0.303 -2.123 8.136 82.064 -63.880 -82.064 1.59e-03 -1.59e-03 7.20e-01 41.010 56
=== 1-s peak spectral analysis ===
(Best model with acceptable fit: PL)
Model Ph_index Ph_90err_low Ph_90err_hi Epeak Epeak_90err_low Epeak_90err_hi Norm Nomr_90err_low Norm_90err_hi chi2 dof
PL -0.903 -0.358 0.385 - - - 8.56e-03 -1.76e-03 1.71e-03 62.570 57
CPL -0.900 -0.357 0.398 9999.360 -9999.360 -9999.360 8.62e-03 -1.64e-03 3.24e-02 62.570 56
=== Fluence/Peak Flux Summary ===
Model Band1 Band2 Band3 Band4 Band5 Total
15-25 25-50 50-100 100-350 15-150 15-350 keV
Fluence PL 3.59e-08 7.38e-08 1.19e-07 4.25e-07 3.29e-07 6.54e-07 erg/cm2
90%_error_low -2.04e-08 -2.99e-08 -5.28e-08 -2.93e-07 -1.29e-07 -3.51e-07 erg/cm2
90%_error_hi 2.49e-08 2.90e-08 5.15e-08 5.51e-07 1.32e-07 5.64e-07 erg/cm2
Peak flux PL 1.99e-01 2.87e-01 3.07e-01 6.10e-01 9.82e-01 1.40e+00 ph/cm2/s
90%_error_low -8.21e-02 -7.88e-02 -6.09e-02 -2.38e-01 -1.98e-01 -2.85e-01 ph/cm2/s
90%_error_hi 9.88e-02 7.67e-02 6.00e-02 3.28e-01 2.00e-01 3.09e-01 ph/cm2/s
Fluence CPL 2.32e-08 7.96e-08 1.39e-07 1.08e-07 3.10e-07 3.49e-07 erg/cm2
90%_error_low -2.26e-08 -4.77e-08 -6.45e-08 -9.79e-08 -1.27e-07 -1.63e-07 erg/cm2
90%_error_hi 3.26e-08 3.64e-08 7.39e-08 6.11e-07 1.37e-07 8.73e-07 erg/cm2
Peak flux CPL 2.00e-01 2.88e-01 3.07e-01 6.14e-01 9.83e-01 1.40e+00 ph/cm2/s
90%_error_low -2.00e-01 -8.16e-02 -6.08e-02 N/A -2.11e-01 -5.27e-01 ph/cm2/s
90%_error_hi 9.76e-02 7.63e-02 8.32e-02 N/A 1.98e-01 2.77e-01 ph/cm2/s
======================================================================
Image
Pre-slew 50.0-350.0 keV image (Event data)
#RAcent DECcent POSerr Theta  Phi  Peak_Cts  SNR Name
179.547 63.066 0.000 35.583 -2.803 0.067 7.654 TRIG_00561974

Image time interval: 0.000 to 0.512 [sec]
Light Curves
Note: The mask-weighted lightcurves have units of either count/det or counts/sec/det, where a det is 0.4 x 0.4 = 0.16 sq cm.
Full-time range; 1 s binning
Other quick-look light curves:
- 64 ms binning (zoomed)
- 16 ms binning (zoomed)
- 8 ms binning (zoomed)
- 2 ms binning (zoomed)
- SN=5 or 10 s binning (full-time range)
- Raw light curve
Spectra
- 64 ms binning (zoomed)
- 16 ms binning (zoomed)
- 8 ms binning (zoomed)
- 2 ms binning (zoomed)
- SN=5 or 10 s binning (full-time range)
- Raw light curve
Spectra
Notes:
- 1) The fitting includes the systematic errors.
- 2) When the burst includes telescope slew time periods, the fitting uses an average response file made from multiple 5-s response files through out the slew time plus single time preiod for the non-slew times, and weighted by the total counts in the corresponding time period using addrmf. An average response file is needed becuase a spectral fit using the pre-slew DRM will introduce some errors in both a spectral shape and a normalization if the PHA file contains a lot of the slew/post-slew time interval.
- 3) For fits to more complicated models (e.g. a power-law over a cutoff power-law), the BAT team has decided to require a chi-square improvement of more than 6 for each extra dof.
Time averaged spectrum fit using the average DRM
Power-law model
Time interval is from    0.020 sec. to  106.756 sec.

Spectral model in power-law:
------------------------------------------------------------
Parameters  : value       lower 90%   higher 90%
Photon index: -1.31688     ( -0.643359   0.633924 )
Norm@50keV  : 3.12851E-04    ( -0.000113804   0.000113475 )
------------------------------------------------------------
#Fit statistic : Chi-Squared =          41.92 using 59 PHA bins.
# Reduced chi-squared =         0.7354 for     57 degrees of freedom
# Null hypothesis probability =   9.328232e-01

Photon flux (15-150 keV)    in 106.7 sec: 3.74425E-02 ( -0.0138701  0.0139847 ) ph/cm2/s
Energy fluence (15-150 keV)             : 3.28575e-07 ( -1.29125e-07  1.32493e-07 ) ergs/cm2
Cutoff power-law model
Time interval is from    0.020 sec. to  106.756 sec.
Spectral model in the cutoff power-law:
------------------------------------------------------------
Parameters  : value       lower 90%   higher 90%
Photon index: 0.302803     ( -2.13093   8.1274 )
Epeak [keV] : 82.0643      ( -63.8362 -82.0209 )
Norm@50keV  : 1.58901E-03    ( -0.00160606   0.719823 )
------------------------------------------------------------
#Fit statistic : Chi-Squared =          41.01 using 59 PHA bins.
# Reduced chi-squared =         0.7323 for     56 degrees of freedom
# Null hypothesis probability =   9.335166e-01

Photon flux (15-150 keV)    in 106.7 sec: 3.44888E-02 ( -0.0155142  0.0150745 ) ph/cm2/s
Energy fluence (15-150 keV)             : 3.10195e-07 ( -1.26771e-07  1.36575e-07 ) ergs/cm2
1-s peak spectrum fit
Power-law model

Time interval is from   -0.026 sec. to    0.974 sec.

Spectral model in power-law:
------------------------------------------------------------
Parameters  : value       lower 90%   higher 90%
Photon index: -0.902895     ( -0.357761   0.385233 )
Norm@50keV  : 8.55758E-03    ( -0.00175572   0.00170538 )
------------------------------------------------------------
#Fit statistic : Chi-Squared =          62.57 using 59 PHA bins.
# Reduced chi-squared =          1.098 for     57 degrees of freedom
# Null hypothesis probability =   2.853009e-01

Photon flux (15-150 keV)    in 1 sec: 0.982235 ( -0.19792  0.199815 ) ph/cm2/s
Energy fluence (15-150 keV)             : 9.59423e-08 ( -1.92168e-08  1.93075e-08 ) ergs/cm2
Cutoff power-law model
Time interval is from   -0.026 sec. to    0.974 sec.
Spectral model in the cutoff power-law:
------------------------------------------------------------
Parameters  : value       lower 90%   higher 90%
Photon index: -0.899939     ( -0.358095   0.396643 )
Epeak [keV] : 9999.36      ( -9999.36 -9999.36 )
Norm@50keV  : 8.61831E-03    ( -0.00163962   0.0323688 )
------------------------------------------------------------
#Fit statistic : Chi-Squared =          62.57 using 59 PHA bins.
# Reduced chi-squared =          1.117 for     56 degrees of freedom
# Null hypothesis probability =   2.545671e-01

Photon flux (15-150 keV)    in 1 sec: 0.983113 ( -0.210584  0.197597 ) ph/cm2/s
Energy fluence (15-150 keV)             : 9.39053e-09 ( 0  0 ) ergs/cm2
Time-resolved spectra
Distribution
T90 vs. Hardness ratio plot

T90                                   = 87.672 sec.
Hardness ratio (energy fluence ratio) = 1.60575762694
S(15-50 keV) vs. S(50-150 keV) plot
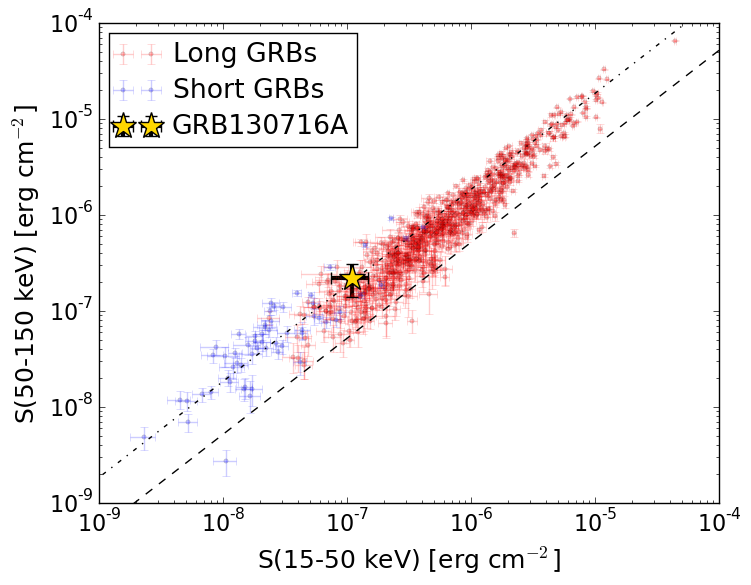
S(15-50 keV)  = 1.0973422e-07
S(50-150 keV) = 2.188434e-07
The dash-dotted line and the dashed line traces the fluences calculated from the Band function with Epeak = 15 and 150 keV, respectively. Both lines assume a canonical values of alpha = -1 and beta = -2.5.
Mask shadow pattern
IMX = 0.714634977033, IMY = 0.0349904088144
Spacecraft aspect plot
Bright source in the pre-burst/pre-slew/post-slew images
Pre-burst image of 15-350 keV band
Time interval of the image:
-239.256000 0.020000

# RAcent  DECcent POSerr Theta    Phi  PeakCts   SNR AngSep     Name
#  [deg]    [deg]    ['] [deg]  [deg]                   [']
194.7763  39.1445    2.2  21.3   44.2   1.1374   5.1 ------	UNKNOWN
168.6503 -26.2046    3.0  54.1  177.2   2.8145   3.8 ------	UNKNOWN
149.4635 -27.1149    3.2  59.4 -163.2   5.6183   3.6 ------	UNKNOWN
137.5524 -15.5205    3.9  55.3 -144.8   3.1779   3.0 ------	UNKNOWN
Pre-slew background subtracted image of 15-350 keV band
Time interval of the image:
0.020000 16.444600

# RAcent  DECcent POSerr Theta    Phi  PeakCts   SNR AngSep     Name
#  [deg]    [deg]    ['] [deg]  [deg]                   [']
213.4204  25.7493    2.4  35.9   75.9   0.6504   4.9 ------	UNKNOWN
151.2703 -14.5902    2.3  47.3 -158.4   0.3762   5.0 ------	UNKNOWN
135.7791 -11.2758    2.3  53.2 -139.8   1.1310   5.0 ------	UNKNOWN
Post-slew image of 15-350 keV band
Time interval of the image:
78.844600 962.854000

# RAcent  DECcent POSerr Theta    Phi  PeakCts   SNR AngSep     Name
#  [deg]    [deg]    ['] [deg]  [deg]                   [']
216.5169  55.1146    2.8  20.3  109.9   2.2198   4.1 ------	UNKNOWN
182.2987  41.0889    3.2  22.1 -171.6   1.6345   3.6 ------	UNKNOWN
 73.7052  71.5630    2.1  36.2  -17.0   3.1958   5.5 ------	UNKNOWN
162.0100   9.2159   10.9  55.3 -144.8   2.9866   1.1 ------	UNKNOWN