Analysis Summary
Notes:
- 1) No attempt has been made to eliminate the non-significant decimal places.
- 2) This batgrbproduct analysis is done using the HEASARC data.
- 3) This batgrbproduct analysis is using the flight position for the mask-weighting calculation.
======================================================================
BAT GRB EVENT DATA PROCESSING REPORT
Process Script Ver: batgrbproduct v2.46
Process Start Time: Sun Jan 12 00:40:06 EST 2014
Host Name: batevent1
Current Working Dir: /local/data/batevent/batevent_reproc/trigger562625
======================================================================
Trigger: 00562625 Segment: 000
BAT Trigger Time: 395905680 [s; MET]
Trigger Stop: 395905760 [s; MET]
UTC: 2013-07-19T05:47:49.192320 [includes UTCF correction]
Where From?: TDRSS position message
BAT
RA: 89.0393291132065 Dec: -11.5845014417971 [deg; J2000]
Catalogged Source?: NO
Point Source?: YES
GRB Indicated?: YES [ by BAT flight software ]
Image S/N Ratio: 11.3
Image Trigger?: YES
Rate S/N Ratio: 0 [ if not an image trigger ]
Image S/N Ratio: 11.3
Analysis Position: [ source = BAT ]
RA: 89.0393291132065 Dec: -11.5845014417971 [deg; J2000]
Refined Position: [ source = BAT pre-slew burst ]
RA: 89.0484478048458 Dec: -11.5803923143976 [deg; J2000]
{ 05h 56m 11.6s , -11d 34' 49.4" }
+/- 1.87048881574854 [arcmin] (estimated 90% radius based on SNR)
+/- 0.661775227819935 [arcmin] (formal 1-sigma fit error)
SNR: 12.4340059760507
Angular difference between the analysis and refined position is 0.589967 arcmin
Partial Coding Fraction: 0.5078125 [ including projection effects ]
Duration
T90: 146.96799993515 +/- 22.6545271268104
Measured from: 7.29199999570847
to: 154.259999930859 [s; relative to TRIGTIME]
T50: 74.4959999322891 +/- 15.0009793337166
Measured from: 35.1999999880791
to: 109.695999920368 [s; relative to TRIGTIME]
Fluence
Peak Flux (peak 1 second)
Measured from: 82.6800000071526
to: 83.6800000071526 [s; relative to TRIGTIME]
Total Fluence
Measured from: -5.40399998426437
to: 158.944000005722 [s; relative to TRIGTIME]
Band 1 Band 2 Band 3 Band 4
15-25 25-50 50-100 100-350 keV
Total 1.049395 1.107523 0.918858 0.208723
0.102315 0.103486 0.089959 0.081670 [error]
Peak 0.016330 0.030185 0.022476 0.009308
0.007966 0.007956 0.007035 0.006328 [error]
[ fluence units of on-axis counts / fully illuminated detector ]
======================================================================
====== Table of the duration information =============================
Value tstart tstop
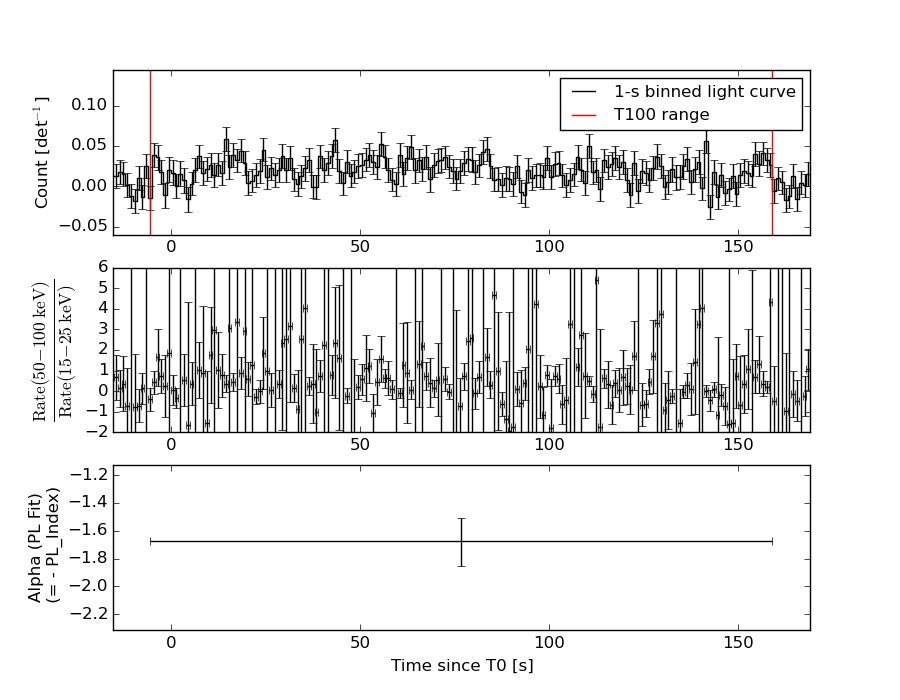
T100 164.348 -5.404 158.944
T90 146.968 7.292 154.260
T50 74.496 35.200 109.696
Peak 1.000 82.680 83.680
====== Spectral Analysis Summary =====================================
Model : spectral model: simple power-law (PL) and cutoff power-law (CPL)
Ph_index : photon index: E^{Ph_index}
Ph_90err : 90% error of the photon index
Epeak : Epeak in keV
Epeak_90err: 90% error of Epeak
Norm : normalization at 50 keV in both the PL model and CPL model
Nomr_90err : 90% error of the normalization
chi2 : Chi-Squared
dof : degree of freedo
=== Time-averaged spectral analysis ===
(Best model with acceptable fit: N/A)
Model Ph_index Ph_90err_low Ph_90err_hi Epeak Epeak_90err_low Epeak_90err_hi Norm Nomr_90err_low Norm_90err_hi chi2 dof
PL -1.676 -0.174 0.171 - - - 1.38e-03 -1.34e-04 1.33e-04 86.530 57
CPL -1.673 -0.176 0.170 9999.310 -9999.300 -9999.310 1.38e-03 -4.78e-04 1.14e-03 86.530 56
=== 1-s peak spectral analysis ===
(Best model with acceptable fit: PL)
Model Ph_index Ph_90err_low Ph_90err_hi Epeak Epeak_90err_low Epeak_90err_hi Norm Nomr_90err_low Norm_90err_hi chi2 dof
PL -1.348 -0.528 0.550 - - - 5.02e-03 -1.60e-03 1.60e-03 70.200 57
CPL -0.052 -2.212 3.869 79.107 N/A N/A 2.10e-02 N/A N/A 69.200 56
=== Fluence/Peak Flux Summary ===
Model Band1 Band2 Band3 Band4 Band5 Total
15-25 25-50 50-100 100-350 15-150 15-350 keV
Fluence PL 3.41e-07 5.62e-07 7.03e-07 1.75e-06 2.10e-06 3.36e-06 erg/cm2
90%_error_low -5.29e-08 -5.37e-08 -9.24e-08 -4.47e-07 -2.15e-07 -5.29e-07 erg/cm2
90%_error_hi 5.51e-08 5.33e-08 9.18e-08 5.41e-07 2.17e-07 6.02e-07 erg/cm2
Peak flux PL 1.79e-01 1.97e-01 1.55e-01 2.00e-01 6.05e-01 7.31e-01 ph/cm2/s
90%_error_low -9.35e-02 -7.36e-02 -5.64e-02 -1.16e-01 -2.01e-01 -2.33e-01 ph/cm2/s
90%_error_hi 1.13e-01 7.18e-02 5.55e-02 1.86e-01 2.04e-01 2.36e-01 ph/cm2/s
Fluence CPL 3.43e-07 5.59e-07 7.01e-07 1.82e-06 2.10e-06 3.30e-06 erg/cm2
90%_error_low -6.28e-08 -5.30e-08 -9.63e-08 -1.05e-06 -2.42e-07 -9.39e-07 erg/cm2
90%_error_hi 5.62e-08 6.73e-08 1.01e-07 2.18e-07 2.26e-07 6.29e-07 erg/cm2
Peak flux CPL 1.35e-01 2.15e-01 1.73e-01 6.88e-02 5.73e-01 5.93e-01 ph/cm2/s
90%_error_low -1.03e-01 -8.65e-02 -6.73e-02 -6.88e-02 -2.07e-01 -2.23e-01 ph/cm2/s
90%_error_hi 1.33e-01 9.10e-02 7.13e-02 1.90e-01 2.11e-01 2.88e-01 ph/cm2/s
======================================================================
Image
Pre-slew 15.0-350.0 keV image (Event data)
#   RAcent    DECcent   POSerr    Theta     Phi              Peak Cts       SNR   Name
   89.0484   -11.5804   0.0156    39.8236  -145.3169         3.1641407     12.434 TRIG_00562625

Foreground time interval of the image:
 -5.404 158.944 (delta_t = 164.348 [sec])
Background time interval of the image:
-239.000  -5.404 (delta_t = 233.596 [sec])
Light Curves
Note: The mask-weighted lightcurves have units of either count/det or counts/sec/det, where a det is 0.4 x 0.4 = 0.16 sq cm.
Full-time range; 1 s binning
Other quick-look light curves:
- 64 ms binning (zoomed)
- 16 ms binning (zoomed)
- 8 ms binning (zoomed)
- 2 ms binning (zoomed)
- SN=5 or 10 s binning (full-time range)
- Raw light curve
Spectra
- 64 ms binning (zoomed)
- 16 ms binning (zoomed)
- 8 ms binning (zoomed)
- 2 ms binning (zoomed)
- SN=5 or 10 s binning (full-time range)
- Raw light curve
Spectra
Notes:
- 1) The fitting includes the systematic errors.
- 2) When the burst includes telescope slew time periods, the fitting uses an average response file made from multiple 5-s response files through out the slew time plus single time preiod for the non-slew times, and weighted by the total counts in the corresponding time period using addrmf. An average response file is needed becuase a spectral fit using the pre-slew DRM will introduce some errors in both a spectral shape and a normalization if the PHA file contains a lot of the slew/post-slew time interval.
- 3) For fits to more complicated models (e.g. a power-law over a cutoff power-law), the BAT team has decided to require a chi-square improvement of more than 6 for each extra dof.
Time averaged spectrum fit using the average DRM
Power-law model

Time interval is from   -5.404 sec. to  158.944 sec.

Spectral model in power-law:
------------------------------------------------------------
Parameters  : value       lower 90%   higher 90%
Photon index: -1.67634     ( -0.173791   0.170767 )
Norm@50keV  : 1.37546E-03    ( -0.000134434   0.000133002 )
------------------------------------------------------------
#Fit statistic : Chi-Squared =          86.53 using 59 PHA bins.
# Reduced chi-squared =          1.518 for     57 degrees of freedom
# Null hypothesis probability =   7.045526e-03

Photon flux (15-150 keV)    in 164.3 sec: 0.181200 ( -0.017275  0.01733 ) ph/cm2/s
Energy fluence (15-150 keV)             : 2.09694e-06 ( -2.15083e-07  2.17024e-07 ) ergs/cm2
Cutoff power-law model
Time interval is from   -5.404 sec. to  158.944 sec.
Spectral model in the cutoff power-law:
------------------------------------------------------------
Parameters  : value       lower 90%   higher 90%
Photon index: -1.67316     ( -0.175044   0.171076 )
Epeak [keV] : 9999.31      ( -9999.35 -9999.36 )
Norm@50keV  : 1.37788E-03    ( -0.000478427   0.00114361 )
------------------------------------------------------------
#Fit statistic : Chi-Squared =          86.53 using 59 PHA bins.
# Reduced chi-squared =          1.545 for     56 degrees of freedom
# Null hypothesis probability =   5.494539e-03

Photon flux (15-150 keV)    in 164.3 sec: 0.181809 ( -0.019387  0.017988 ) ph/cm2/s
Energy fluence (15-150 keV)             : 2.10449e-06 ( -2.41766e-07  2.25577e-07 ) ergs/cm2
1-s peak spectrum fit
Power-law model
Time interval is from   82.680 sec. to   83.680 sec.

Spectral model in power-law:
------------------------------------------------------------
Parameters  : value       lower 90%   higher 90%
Photon index: -1.34828     ( -0.528306   0.55013 )
Norm@50keV  : 5.02284E-03    ( -0.0016004   0.00160039 )
------------------------------------------------------------
#Fit statistic : Chi-Squared =          70.20 using 59 PHA bins.
# Reduced chi-squared =          1.232 for     57 degrees of freedom
# Null hypothesis probability =   1.125036e-01

Photon flux (15-150 keV)    in 1 sec: 0.604911 ( -0.201245  0.204071 ) ph/cm2/s
Energy fluence (15-150 keV)             : 4.90806e-08 ( -1.64722e-08  1.67503e-08 ) ergs/cm2
Cutoff power-law model
Time interval is from   82.680 sec. to   83.680 sec.
Spectral model in the cutoff power-law:
------------------------------------------------------------
Parameters  : value       lower 90%   higher 90%
Photon index: -0.0521886     ( -2.21152   3.86852 )
Epeak [keV] : 79.1068      (   )
Norm@50keV  : 2.09816E-02    (     )
------------------------------------------------------------
#Fit statistic : Chi-Squared =          69.20 using 59 PHA bins.
# Reduced chi-squared =          1.236 for     56 degrees of freedom
# Null hypothesis probability =   1.107717e-01

Photon flux (15-150 keV)    in 1 sec: 0.572856 ( -0.20674  0.211352 ) ph/cm2/s
Energy fluence (15-150 keV)             : 4.5589e-08 ( -1.71948e-08  1.78988e-08 ) ergs/cm2
Time-resolved spectra
Distribution
T90 vs. Hardness ratio plot
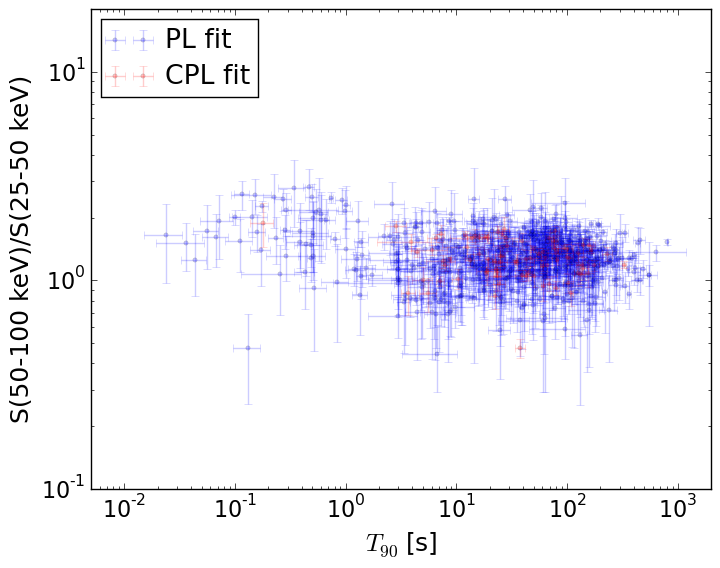
T90                                   = N/A sec.
Hardness ratio (energy fluence ratio) = N/A
S(15-50 keV) vs. S(50-150 keV) plot
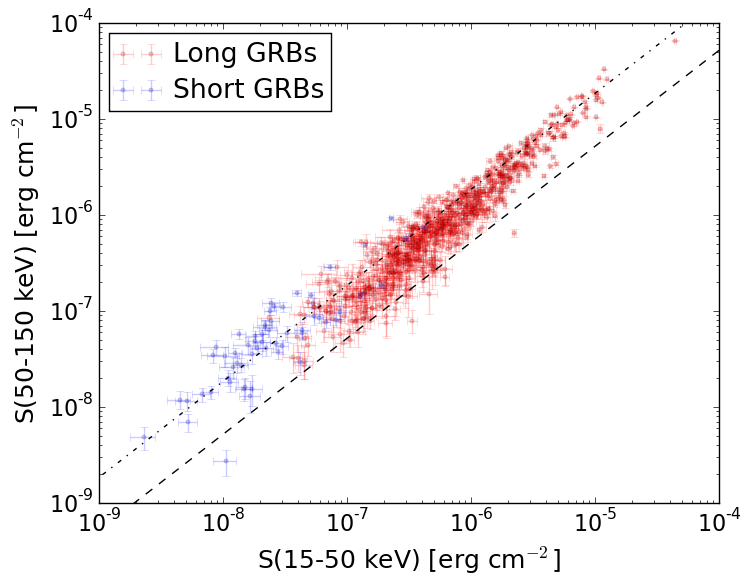
S(15-50 keV)  = N/A
S(50-150 keV) = N/A
The dash-dotted line and the dashed line traces the fluences calculated from the Band function with Epeak = 15 and 150 keV, respectively. Both lines assume a canonical values of alpha = -1 and beta = -2.5.
Mask shadow pattern
IMX = -6.856984283138230E-01, IMY = 4.745011769304377E-01
Spacecraft aspect plot
Bright source in the pre-burst/pre-slew/post-slew images
Pre-burst image of 15-350 keV band
Time interval of the image:
-239.000000 -5.404000

# RAcent  DECcent POSerr Theta    Phi  PeakCts   SNR AngSep     Name
#  [deg]    [deg]    ['] [deg]  [deg]                   [']
135.5465 -40.5512    0.3  14.2   84.6   8.0081  39.7    0.8	Vela X-1
181.7327  -7.9914    2.2  54.4    8.0   5.4168   5.2 ------	UNKNOWN
 76.8963 -36.5484    2.4  43.6  173.6   1.7391   4.8 ------	UNKNOWN
112.4135 -13.5958    3.1  20.3 -120.2   0.7558   3.7 ------	UNKNOWN
116.3365 -12.4579    3.0  18.8 -109.1   0.7503   3.9 ------	UNKNOWN
147.1101   5.8182    2.5  38.3  -39.6   1.3350   4.7 ------	UNKNOWN
Pre-slew background subtracted image of 15-350 keV band
Time interval of the image:
-5.404000 158.944000

# RAcent  DECcent POSerr Theta    Phi  PeakCts   SNR AngSep     Name
#  [deg]    [deg]    ['] [deg]  [deg]                   [']
135.5360 -40.7153   10.8  14.4   84.9   0.1977   1.1    9.6	Vela X-1
 89.0485 -11.5804    0.9  39.8 -145.3   3.1641  12.4 ------	UNKNOWN
Post-slew image of 15-350 keV band
Time interval of the image:
849.100590 963.120600

# RAcent  DECcent POSerr Theta    Phi  PeakCts   SNR AngSep     Name
#  [deg]    [deg]    ['] [deg]  [deg]                   [']
254.4798  35.3942    6.4  22.3  118.2   0.2564   1.8    3.3	Her X-1
299.5747  35.2083    0.7  39.0   49.0   5.9219  16.7    0.9	Cyg X-1
308.1395  40.9241    6.1  39.3   34.9  -0.5576  -1.9    2.2	Cyg X-3
325.9138  38.2673    9.7  50.7   23.5  -0.7756  -1.2   12.6	Cyg X-2
 23.3167  65.2233    2.4  52.0  -31.5   1.7543   4.8 ------	UNKNOWN
 28.5720  63.6625    3.7  54.5  -33.1   1.7170   3.1 ------	UNKNOWN