Analysis Summary
Notes:
- 1) No attempt has been made to eliminate the non-significant decimal places.
- 2) This batgrbproduct analysis is done using the HEASARC data.
- 3) This batgrbproduct analysis is using the flight position for the mask-weighting calculation.
======================================================================
BAT GRB EVENT DATA PROCESSING REPORT
Process Script Ver: batgrbproduct v2.46
Process Start Time: Sun Jan 12 00:33:57 EST 2014
Host Name: batevent1
Current Working Dir: /local/data/batevent/batevent_reproc/trigger563213
======================================================================
Trigger: 00563213 Segment: 000
BAT Trigger Time: 396173970.048 [s; MET]
Trigger Stop: 396173972.096 [s; MET]
UTC: 2013-07-22T08:19:19.228240 [includes UTCF correction]
Where From?: TDRSS position message
BAT
RA: 260.669809204394 Dec: -2.97920903466256 [deg; J2000]
Catalogged Source?: NO
Point Source?: YES
GRB Indicated?: YES [ by BAT flight software ]
Image S/N Ratio: 7.67
Image Trigger?: NO
Rate S/N Ratio: 6.2449979983984 [ if not an image trigger ]
Image S/N Ratio: 7.67
Analysis Position: [ source = BAT ]
RA: 260.669809204394 Dec: -2.97920903466256 [deg; J2000]
Refined Position: [ source = BAT pre-slew burst ]
RA: 260.667897290875 Dec: -2.9593509221391 [deg; J2000]
{ 17h 22m 40.3s , -02d 57' 33.7" }
+/- 1.34962528207725 [arcmin] (estimated 90% radius based on SNR)
+/- 0.549523143945634 [arcmin] (formal 1-sigma fit error)
SNR: 19.8198113063247
Angular difference between the analysis and refined position is 1.196982 arcmin
Partial Coding Fraction: 0.4882812 [ including projection effects ]
Duration
T90: 98.3679999709129 +/- 12.8608866226288
Measured from: 7.03600001335144
to: 105.403999984264 [s; relative to TRIGTIME]
T50: 35.3559999465942 +/- 0.860920413318704
Measured from: 42.6040000319481
to: 77.9599999785423 [s; relative to TRIGTIME]
Fluence
Peak Flux (peak 1 second)
Measured from: 70.2840000391006
to: 71.2840000391006 [s; relative to TRIGTIME]
Total Fluence
Measured from: -3.96399998664856
to: 252.992000043392 [s; relative to TRIGTIME]
Band 1 Band 2 Band 3 Band 4
15-25 25-50 50-100 100-350 keV
Total 5.345409 7.535004 5.971124 1.656237
0.109983 0.104641 0.090107 0.073261 [error]
Peak 0.159782 0.277832 0.237014 0.061274
0.007955 0.008739 0.008041 0.005604 [error]
[ fluence units of on-axis counts / fully illuminated detector ]
======================================================================
====== Table of the duration information =============================
Value tstart tstop
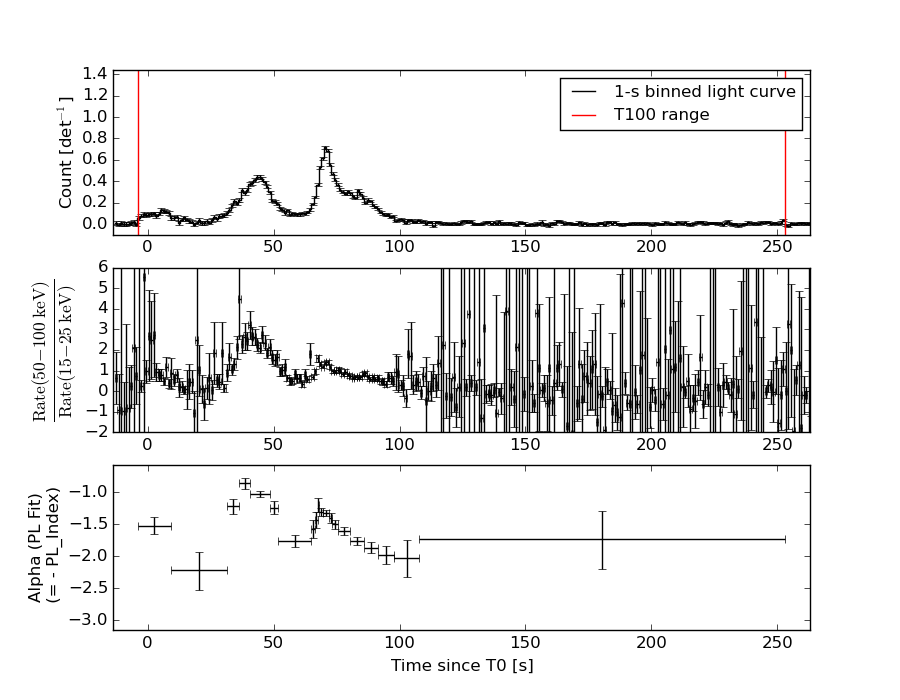
T100 256.956 -3.964 252.992
T90 98.368 7.036 105.404
T50 35.356 42.604 77.960
Peak 1.000 70.284 71.284
====== Spectral Analysis Summary =====================================
Model : spectral model: simple power-law (PL) and cutoff power-law (CPL)
Ph_index : photon index: E^{Ph_index}
Ph_90err : 90% error of the photon index
Epeak : Epeak in keV
Epeak_90err: 90% error of Epeak
Norm : normalization at 50 keV in both the PL model and CPL model
Nomr_90err : 90% error of the normalization
chi2 : Chi-Squared
dof : degree of freedo
=== Time-averaged spectral analysis ===
(Best model with acceptable fit: PL)
Model Ph_index Ph_90err_low Ph_90err_hi Epeak Epeak_90err_low Epeak_90err_hi Norm Nomr_90err_low Norm_90err_hi chi2 dof
PL -1.455 -0.037 0.038 - - - 5.29e-03 -1.01e-04 1.01e-04 37.070 57
CPL -1.420 -0.070 0.117 981.144 -981.144 -981.144 5.48e-03 -2.68e-04 6.16e-04 37.230 56
=== 1-s peak spectral analysis ===
(Best model with acceptable fit: PL)
Model Ph_index Ph_90err_low Ph_90err_hi Epeak Epeak_90err_low Epeak_90err_hi Norm Nomr_90err_low Norm_90err_hi chi2 dof
PL -1.279 -0.065 0.065 - - - 4.89e-02 -1.77e-03 1.77e-03 59.080 57
CPL -0.924 -0.256 0.271 165.394 -48.983 257.163 7.15e-02 -1.67e-02 2.34e-02 53.340 56
=== Fluence/Peak Flux Summary ===
Model Band1 Band2 Band3 Band4 Band5 Total
15-25 25-50 50-100 100-350 15-150 15-350 keV
Fluence PL 1.66e-06 3.14e-06 4.59e-06 1.43e-05 1.30e-05 2.37e-05 erg/cm2
90%_error_low -7.03e-08 -7.66e-08 -9.95e-08 -7.34e-07 -2.50e-07 -7.65e-07 erg/cm2
90%_error_hi 7.17e-08 7.64e-08 9.92e-08 7.62e-07 2.50e-07 7.87e-07 erg/cm2
Peak flux PL 1.63e+00 1.87e+00 1.54e+00 2.13e+00 5.81e+00 7.17e+00 ph/cm2/s
90%_error_low -1.15e-01 -7.99e-02 -6.58e-02 -1.89e-01 -2.19e-01 -2.69e-01 ph/cm2/s
90%_error_hi 1.18e-01 7.96e-02 6.55e-02 2.01e-01 2.19e-01 2.70e-01 ph/cm2/s
Fluence CPL 1.66e-06 3.14e-06 4.59e-06 1.42e-05 1.30e-05 2.36e-05 erg/cm2
90%_error_low -8.53e-08 -5.83e-08 -9.78e-08 -2.36e-06 -2.53e-07 -2.40e-06 erg/cm2
90%_error_hi 6.97e-08 7.05e-08 5.88e-08 4.40e-07 2.47e-07 4.14e-07 erg/cm2
Peak flux CPL 1.50e+00 1.91e+00 1.60e+00 1.48e+00 5.70e+00 6.48e+00 ph/cm2/s
90%_error_low -1.44e-01 -8.68e-02 -7.72e-02 -3.30e-01 -2.32e-01 -4.16e-01 ph/cm2/s
90%_error_hi 1.47e-01 8.75e-02 7.80e-02 4.45e-01 2.32e-01 5.02e-01 ph/cm2/s
======================================================================
Image
Pre-slew 15.0-350.0 keV image (Event data)
#   RAcent    DECcent   POSerr    Theta     Phi              Peak Cts       SNR   Name
  260.6679    -2.9594   0.0098    40.9677    -5.5978         1.8692644     19.820 TRIG_00563213

Foreground time interval of the image:
 -3.964  25.053 (delta_t =  29.017 [sec])
Background time interval of the image:
-239.048  -3.964 (delta_t = 235.084 [sec])
Light Curves
Note: The mask-weighted lightcurves have units of either count/det or counts/sec/det, where a det is 0.4 x 0.4 = 0.16 sq cm.
Full-time range; 1 s binning
Other quick-look light curves:
- 64 ms binning (zoomed)
- 16 ms binning (zoomed)
- 8 ms binning (zoomed)
- 2 ms binning (zoomed)
- SN=5 or 10 s binning (full-time range)
- Raw light curve
Spectra
- 64 ms binning (zoomed)
- 16 ms binning (zoomed)
- 8 ms binning (zoomed)
- 2 ms binning (zoomed)
- SN=5 or 10 s binning (full-time range)
- Raw light curve
Spectra
Notes:
- 1) The fitting includes the systematic errors.
- 2) When the burst includes telescope slew time periods, the fitting uses an average response file made from multiple 5-s response files through out the slew time plus single time preiod for the non-slew times, and weighted by the total counts in the corresponding time period using addrmf. An average response file is needed becuase a spectral fit using the pre-slew DRM will introduce some errors in both a spectral shape and a normalization if the PHA file contains a lot of the slew/post-slew time interval.
- 3) For fits to more complicated models (e.g. a power-law over a cutoff power-law), the BAT team has decided to require a chi-square improvement of more than 6 for each extra dof.
Time averaged spectrum fit using the average DRM
Power-law model

Time interval is from   -3.964 sec. to  252.992 sec.

Spectral model in power-law:
------------------------------------------------------------
Parameters  : value       lower 90%   higher 90%
Photon index: -1.45494     ( -0.03739   0.0375241 )
Norm@50keV  : 5.29043E-03    ( -0.000101425   0.000101333 )
------------------------------------------------------------
#Fit statistic : Chi-Squared =          37.07 using 59 PHA bins.
# Reduced chi-squared =         0.6504 for     57 degrees of freedom
# Null hypothesis probability =   9.811693e-01

Photon flux (15-150 keV)    in 257 sec: 0.652789 ( -0.014775  0.014838 ) ph/cm2/s
Energy fluence (15-150 keV)             : 1.30006e-05 ( -2.49929e-07  2.50229e-07 ) ergs/cm2
Cutoff power-law model
Time interval is from   -3.964 sec. to  252.992 sec.
Spectral model in the cutoff power-law:
------------------------------------------------------------
Parameters  : value       lower 90%   higher 90%
Photon index: -1.42022     ( -0.0379885   0.148731 )
Epeak [keV] : 981.144      ( -9998.79 -9998.79 )
Norm@50keV  : 5.47505E-03    ( -0.000100331   0.000784002 )
------------------------------------------------------------
#Fit statistic : Chi-Squared =          37.23 using 59 PHA bins.
# Reduced chi-squared =         0.6647 for     56 degrees of freedom
# Null hypothesis probability =   9.748962e-01

Photon flux (15-150 keV)    in 257 sec: 0.652679 ( -0.008527  0.014645 ) ph/cm2/s
Energy fluence (15-150 keV)             : 1.29991e-05 ( -2.53403e-07  2.47475e-07 ) ergs/cm2
1-s peak spectrum fit
Power-law model
Time interval is from   70.284 sec. to   71.284 sec.

Spectral model in power-law:
------------------------------------------------------------
Parameters  : value       lower 90%   higher 90%
Photon index: -1.27881     ( -0.0650816   0.0651605 )
Norm@50keV  : 4.88687E-02    ( -0.00176993   0.00176991 )
------------------------------------------------------------
#Fit statistic : Chi-Squared =          59.08 using 59 PHA bins.
# Reduced chi-squared =          1.037 for     57 degrees of freedom
# Null hypothesis probability =   3.993596e-01

Photon flux (15-150 keV)    in 1 sec: 5.80808 ( -0.21919  0.21947 ) ph/cm2/s
Energy fluence (15-150 keV)             : 4.85512e-07 ( -1.9411e-08  1.94631e-08 ) ergs/cm2
Cutoff power-law model
Time interval is from   70.284 sec. to   71.284 sec.
Spectral model in the cutoff power-law:
------------------------------------------------------------
Parameters  : value       lower 90%   higher 90%
Photon index: -0.923964     ( -0.255676   0.27143 )
Epeak [keV] : 165.394      ( -48.9833 257.163 )
Norm@50keV  : 7.15007E-02    ( -0.016732   0.0233867 )
------------------------------------------------------------
#Fit statistic : Chi-Squared =          53.34 using 59 PHA bins.
# Reduced chi-squared =         0.9525 for     56 degrees of freedom
# Null hypothesis probability =   5.762663e-01

Photon flux (15-150 keV)    in 1 sec: 5.69971 ( -0.2316  0.23183 ) ph/cm2/s
Energy fluence (15-150 keV)             : 4.74701e-07 ( -2.11668e-08  2.10687e-08 ) ergs/cm2
Time-resolved spectra
Distribution
T90 vs. Hardness ratio plot
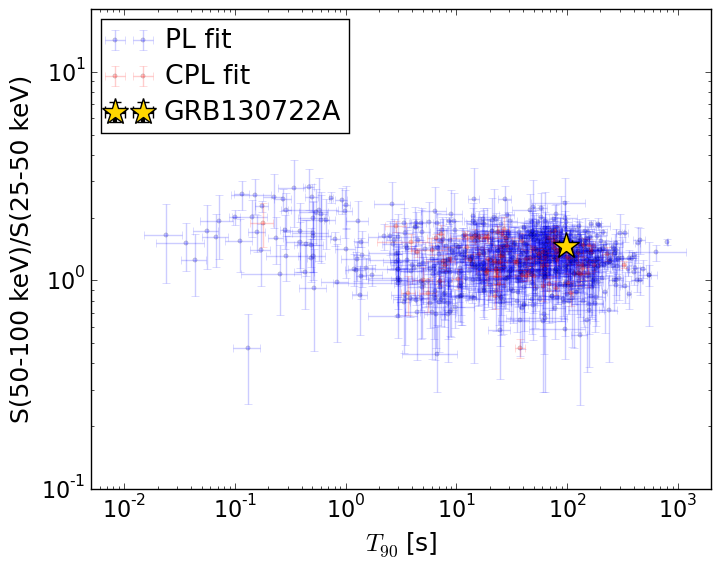
T90                                   = 98.368 sec.
Hardness ratio (energy fluence ratio) = 1.45911714615
S(15-50 keV) vs. S(50-150 keV) plot
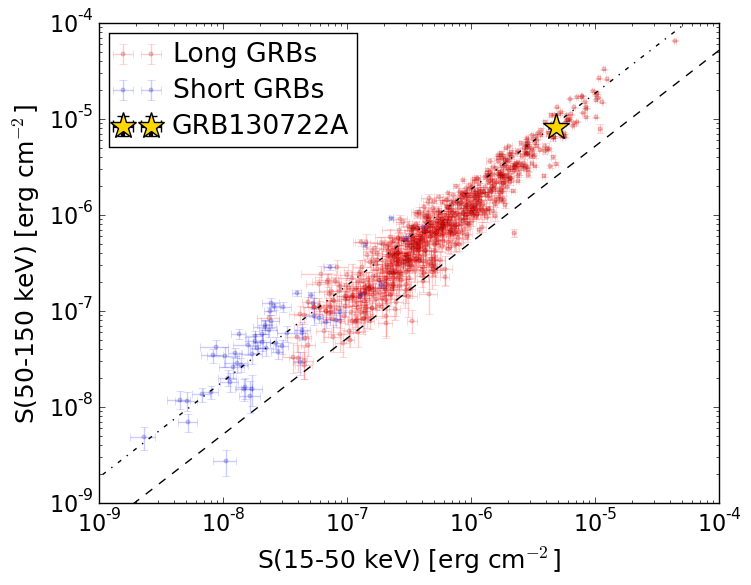
S(15-50 keV)  = 4.80802e-06
S(50-150 keV) = 8.192611e-06
The dash-dotted line and the dashed line traces the fluences calculated from the Band function with Epeak = 15 and 150 keV, respectively. Both lines assume a canonical values of alpha = -1 and beta = -2.5.
Mask shadow pattern
IMX = 8.641568649219036E-01, IMY = 8.469734488087770E-02
Spacecraft aspect plot

Bright source in the pre-burst/pre-slew/post-slew images
Pre-burst image of 15-350 keV band
Time interval of the image:
-239.048000 -3.964000

# RAcent  DECcent POSerr Theta    Phi  PeakCts   SNR AngSep     Name
#  [deg]    [deg]    ['] [deg]  [deg]                   [']
244.9758 -15.6324    0.5  40.9  -36.3   6.5018  21.2    0.5	Sco X-1
255.9856 -37.8617    0.8  22.1  -67.0   2.9065  14.1    1.1	4U 1700-377
256.3889 -36.4083    2.9  22.0  -63.1   0.8146   4.0    2.4	GX 349+2
263.1302 -24.7848    4.8  22.1  -28.1   0.4104   2.4    7.0	GX 1+4
264.6069 -44.6313   15.9  16.1  -89.4   0.1375   0.7   12.3	4U 1735-44
268.2191  -1.4203    4.5  39.3    6.1   0.7598   2.6    9.1	SW J1753.5-0127
270.1316 -25.1217    5.7  17.4  -15.2  -0.3867  -2.1    8.7	GX 5-1
270.2465 -25.6698    3.7  16.9  -16.2   0.6799   3.5    5.3	GRS 1758-258
274.0083 -14.0332    1.7  25.5    8.4   1.4211   6.8    0.2	GX 17+2
275.8485 -30.2325    6.0  10.2  -12.5   0.3550   1.9    9.0	H1820-303
284.8084 -24.8722    0.0  13.0   34.6   0.1801   1.0   12.7	HT1900.1-2455
262.9167 -33.8498    3.2  17.6  -51.5   0.6577   3.6    3.7	GX 354-0
308.7229 -27.8568    2.8  22.9  103.0   1.1122   4.2 ------	UNKNOWN
277.4495 -23.8265    1.8  15.1    7.8   1.1430   6.2 ------	UNKNOWN
265.5669 -33.2941    2.8  15.7  -47.0   0.7162   4.1 ------	UNKNOWN
 25.8835 -72.4145    2.5  57.6 -168.9   4.0018   4.5 ------	UNKNOWN
244.3900 -42.2195    2.9  30.4  -79.2   1.1382   4.0 ------	UNKNOWN
Pre-slew background subtracted image of 15-350 keV band
Time interval of the image:
-3.964000 25.052590

# RAcent  DECcent POSerr Theta    Phi  PeakCts   SNR AngSep     Name
#  [deg]    [deg]    ['] [deg]  [deg]                   [']
244.8641 -15.8288    0.0  40.9  -36.6  -0.0411  -0.4   13.1	Sco X-1
255.8213 -37.9410    4.8  22.2  -67.3  -0.1550  -2.4    9.7	4U 1700-377
256.3935 -36.2856    8.5  22.1  -62.8   0.0856   1.4    8.5	GX 349+2
262.9164 -24.9394    0.0  22.1  -28.7  -0.0402  -0.7   12.7	GX 1+4
264.7419 -44.4483   83.1  15.9  -88.8   0.0084   0.1    0.1	4U 1735-44
268.2070  -1.3973    6.9  39.3    6.1  -0.1599  -1.7   10.2	SW J1753.5-0127
270.2134 -25.0900   10.5  17.4  -15.0   0.0626   1.1    3.9	GX 5-1
270.0912 -25.6667    0.0  17.0  -16.5   0.0068   0.1   12.3	GRS 1758-258
274.0514 -13.9905   14.9  25.5    8.5   0.0488   0.8    3.8	GX 17+2
275.8483 -30.3144   45.9  10.2  -12.8  -0.0141  -0.3    5.1	H1820-303
284.9858 -25.1220    4.1  12.8   35.4  -0.1509  -2.8   12.4	HT1900.1-2455
262.9334 -33.8298   13.0  17.6  -51.5   0.0523   0.9    2.8	GX 354-0
260.6679  -2.9594    0.6  41.0   -5.6   1.8690  19.8 ------	UNKNOWN
267.3147 -56.3693    2.2  21.6 -122.6   0.3374   5.4 ------	UNKNOWN
Post-slew image of 15-350 keV band
Time interval of the image:
99.052600 426.152590

# RAcent  DECcent POSerr Theta    Phi  PeakCts   SNR AngSep     Name
#  [deg]    [deg]    ['] [deg]  [deg]                   [']
244.9728 -15.6320    0.3  20.0 -156.6   9.6755  33.1    0.6	Sco X-1
254.6288  35.4443    8.2  38.8  -34.2   0.6566   1.4   10.4	Her X-1
255.9973 -37.8580    1.4  35.1  160.1   3.5576   8.2    1.0	4U 1700-377
256.4541 -36.4177    2.9  33.7  159.8   1.6205   4.0    1.0	GX 349+2
262.9867 -24.7463    3.2  21.9  148.1   1.0859   3.6    1.2	GX 1+4
265.0039 -44.3856    7.2  41.6  149.0   1.0346   1.6   11.8	4U 1735-44
268.3218  -1.4366    3.4   7.8   52.4   0.8842   3.4    2.9	SW J1753.5-0127
270.1971 -24.9136    7.3  23.8  131.9  -0.4751  -1.6   11.0	GX 5-1
270.4384 -25.8201    4.0  24.7  132.3   0.8812   2.9    8.7	GRS 1758-258
274.0405 -14.0052    1.4  17.2  104.4   2.4068   8.0    2.8	GX 17+2
275.7919 -30.3889   58.3  30.9  127.7   0.0800   0.2    7.0	H1820-303
284.8410 -25.0018  110.4  32.0  109.3  -0.0620  -0.1   11.7	HT1900.1-2455
288.8160  10.9445    1.1  31.3   36.8   4.4799  10.9    1.0	GRS 1915+105
299.5932  35.3960   14.0  52.9   13.6   1.2335   0.8   11.7	Cyg X-1
262.9090 -33.7511    6.0  30.8  150.1   0.7093   1.9    6.4	GX 354-0
242.3874  46.4172    3.1  52.0  -42.3   7.1556   3.7 ------	UNKNOWN
213.6549  -9.9423    2.7  47.2 -127.1   6.6595   4.2 ------	UNKNOWN
217.3704  -0.4639    3.3  43.4 -113.8   5.2752   3.5 ------	UNKNOWN