Analysis Summary
Notes:
- 1) No attempt has been made to eliminate the non-significant decimal places.
- 2) This batgrbproduct analysis is done using the HEASARC data.
- 3) This batgrbproduct analysis is using the flight position for the mask-weighting calculation.
======================================================================
BAT GRB EVENT DATA PROCESSING REPORT
Process Script Ver: batgrbproduct v2.46
Process Start Time: Sun Jan 12 00:21:39 EST 2014
Host Name: batevent1
Current Working Dir: /local/data/batevent/batevent_reproc/trigger564028
======================================================================
Trigger: 00564028 Segment: 000
BAT Trigger Time: 396466778.432 [s; MET]
Trigger Stop: 396466778.944 [s; MET]
UTC: 2013-07-25T17:39:27.599040 [includes UTCF correction]
Where From?: TDRSS position message
BAT
RA: 214.232041308035 Dec: -11.1402286245125 [deg; J2000]
Catalogged Source?: NO
Point Source?: YES
GRB Indicated?: YES [ by BAT flight software ]
Image S/N Ratio: 10.17
Image Trigger?: NO
Rate S/N Ratio: 20.2237484161567 [ if not an image trigger ]
Image S/N Ratio: 10.17
Analysis Position: [ source = BAT ]
RA: 214.232041308035 Dec: -11.1402286245125 [deg; J2000]
Refined Position: [ source = BAT pre-slew burst ]
RA: 214.236639943365 Dec: -11.1198350527407 [deg; J2000]
{ 14h 16m 56.8s , -11d 07' 11.4" }
+/- 1.02718546279786 [arcmin] (estimated 90% radius based on SNR)
+/- 0.387976456956507 [arcmin] (formal 1-sigma fit error)
SNR: 29.273668134919
Angular difference between the analysis and refined position is 1.253206 arcmin
Partial Coding Fraction: 0.96875 [ including projection effects ]
Duration
T90: 4.77599990367889 +/- 0.855083658147749
Measured from: 0.0480000376701355
to: 4.82399994134903 [s; relative to TRIGTIME]
T50: 1.93999993801117 +/- 0.286216694722533
Measured from: 0.776000022888184
to: 2.71599996089935 [s; relative to TRIGTIME]
Fluence
Peak Flux (peak 1 second)
Measured from: 0.276000022888184
to: 1.27600002288818 [s; relative to TRIGTIME]
Total Fluence
Measured from: -0.38400000333786
to: 5.89600002765656 [s; relative to TRIGTIME]
Band 1 Band 2 Band 3 Band 4
15-25 25-50 50-100 100-350 keV
Total 0.348350 0.282604 0.125882 0.016226
0.014444 0.013992 0.012302 0.010984 [error]
Peak 0.108023 0.101938 0.050608 0.008612
0.006371 0.006345 0.005435 0.004601 [error]
[ fluence units of on-axis counts / fully illuminated detector ]
======================================================================
====== Table of the duration information =============================
Value tstart tstop
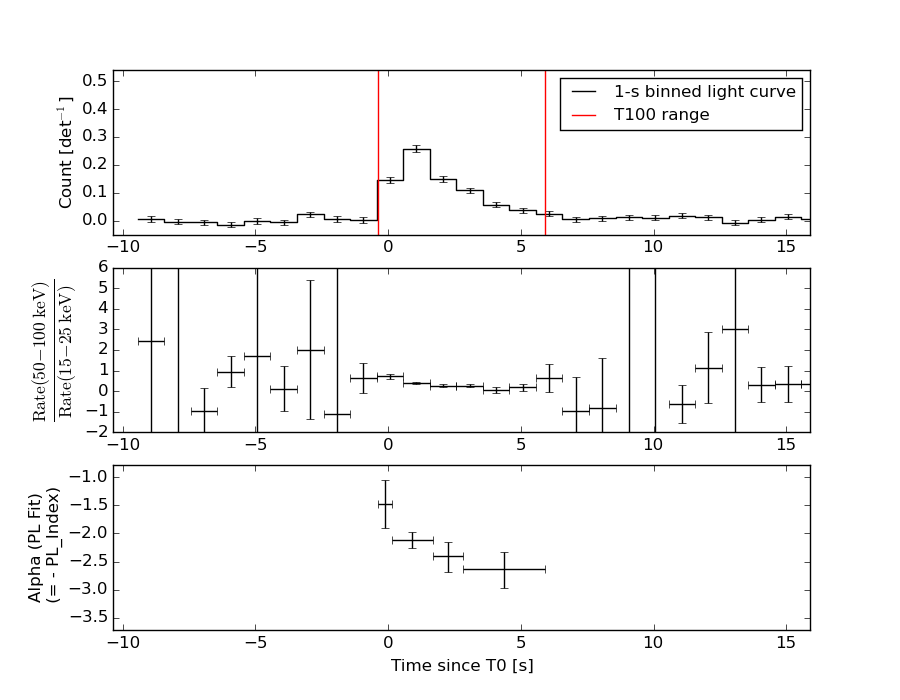
T100 6.280 -0.384 5.896
T90 4.776 0.048 4.824
T50 1.940 0.776 2.716
Peak 1.000 0.276 1.276
====== Spectral Analysis Summary =====================================
Model : spectral model: simple power-law (PL) and cutoff power-law (CPL)
Ph_index : photon index: E^{Ph_index}
Ph_90err : 90% error of the photon index
Epeak : Epeak in keV
Epeak_90err: 90% error of Epeak
Norm : normalization at 50 keV in both the PL model and CPL model
Nomr_90err : 90% error of the normalization
chi2 : Chi-Squared
dof : degree of freedo
=== Time-averaged spectral analysis ===
(Best model with acceptable fit: PL)
Model Ph_index Ph_90err_low Ph_90err_hi Epeak Epeak_90err_low Epeak_90err_hi Norm Nomr_90err_low Norm_90err_hi chi2 dof
PL -2.276 -0.135 0.130 - - - 6.27e-03 -5.22e-04 5.15e-04 67.710 57
CPL -1.987 1.987 1.987 1.799 -0.753 24.146 9.18e-03 -1.23e-03 1.18e-03 68.030 56
=== 1-s peak spectral analysis ===
(Best model with acceptable fit: PL)
Model Ph_index Ph_90err_low Ph_90err_hi Epeak Epeak_90err_low Epeak_90err_hi Norm Nomr_90err_low Norm_90err_hi chi2 dof
PL -2.066 -0.150 0.145 - - - 1.48e-02 -1.40e-03 1.37e-03 69.450 57
CPL -1.851 -0.252 0.636 29.032 -24.006 -29.032 1.97e-02 N/A N/A 69.030 56
=== Fluence/Peak Flux Summary ===
Model Band1 Band2 Band3 Band4 Band5 Total
15-25 25-50 50-100 100-350 15-150 15-350 keV
Fluence PL 1.05e-07 1.21e-07 9.95e-08 1.38e-07 3.75e-07 4.63e-07 erg/cm2
90%_error_low -9.29e-09 -7.18e-09 -1.16e-08 -2.98e-08 -2.54e-08 -4.31e-08 erg/cm2
90%_error_hi 9.52e-09 7.17e-09 1.19e-08 3.54e-08 2.58e-08 4.71e-08 erg/cm2
Peak flux PL 1.05e+00 7.60e-01 3.63e-01 2.45e-01 2.29e+00 2.42e+00 ph/cm2/s
90%_error_low -1.14e-01 -5.45e-02 -4.57e-02 -5.52e-02 -1.66e-01 -1.74e-01 ph/cm2/s
90%_error_hi 1.17e-01 5.45e-02 4.62e-02 6.48e-02 1.66e-01 1.74e-01 ph/cm2/s
Fluence CPL N/A N/A N/A N/A N/A N/A erg/cm2
90%_error_low -9.29e-09 -7.18e-09 -1.16e-08 -2.98e-08 -2.54e-08 -4.31e-08 erg/cm2
90%_error_hi 9.52e-09 7.17e-09 1.19e-08 3.54e-08 2.58e-08 4.71e-08 erg/cm2
Peak flux CPL 1.03e+00 7.77e-01 3.61e-01 1.77e-01 2.27e+00 2.34e+00 ph/cm2/s
90%_error_low N/A -6.39e-02 -4.88e-02 -1.01e-01 -1.79e-01 -2.19e-01 ph/cm2/s
90%_error_hi N/A 7.15e-02 4.78e-02 1.51e-01 1.77e-01 2.20e-01 ph/cm2/s
======================================================================
Image
Pre-slew 15.0-350.0 keV image (Event data)
#   RAcent    DECcent   POSerr    Theta     Phi              Peak Cts       SNR   Name
  214.2366   -11.1198   0.0066    19.6024  -147.5253         0.7839156     29.274 TRIG_00564028

Foreground time interval of the image:
 -0.384   5.896 (delta_t =   6.280 [sec])
Background time interval of the image:
-239.432  -0.384 (delta_t = 239.048 [sec])
Light Curves
Note: The mask-weighted lightcurves have units of either count/det or counts/sec/det, where a det is 0.4 x 0.4 = 0.16 sq cm.
Full-time range; 1 s binning
Other quick-look light curves:
- 64 ms binning (zoomed)
- 16 ms binning (zoomed)
- 8 ms binning (zoomed)
- 2 ms binning (zoomed)
- SN=5 or 10 s binning (full-time range)
- Raw light curve
Spectra
- 64 ms binning (zoomed)
- 16 ms binning (zoomed)
- 8 ms binning (zoomed)
- 2 ms binning (zoomed)
- SN=5 or 10 s binning (full-time range)
- Raw light curve
Spectra
Notes:
- 1) The fitting includes the systematic errors.
- 2) When the burst includes telescope slew time periods, the fitting uses an average response file made from multiple 5-s response files through out the slew time plus single time preiod for the non-slew times, and weighted by the total counts in the corresponding time period using addrmf. An average response file is needed becuase a spectral fit using the pre-slew DRM will introduce some errors in both a spectral shape and a normalization if the PHA file contains a lot of the slew/post-slew time interval.
- 3) For fits to more complicated models (e.g. a power-law over a cutoff power-law), the BAT team has decided to require a chi-square improvement of more than 6 for each extra dof.
Time averaged spectrum fit using the average DRM
Power-law model
Time interval is from   -0.384 sec. to    5.896 sec.

Spectral model in power-law:
------------------------------------------------------------
Parameters  : value       lower 90%   higher 90%
Photon index: -2.2761     ( -0.134947   0.13023 )
Norm@50keV  : 6.27231E-03    ( -0.000522278   0.000514689 )
------------------------------------------------------------
#Fit statistic : Chi-Squared =          67.71 using 59 PHA bins.
# Reduced chi-squared =          1.188 for     57 degrees of freedom
# Null hypothesis probability =   1.568031e-01

Photon flux (15-150 keV)    in 6.28 sec: 1.08187 ( -0.06517  0.06537 ) ph/cm2/s
Energy fluence (15-150 keV)             : 3.74886e-07 ( -2.54247e-08  2.5823e-08 ) ergs/cm2
Cutoff power-law model
Time interval is from   -0.384 sec. to    5.896 sec.
Spectral model in the cutoff power-law:
------------------------------------------------------------
Parameters  : value       lower 90%   higher 90%
Photon index: -1.98897     ( 1.98897   1.98897 )
Epeak [keV] : 1.60727      ( -0.56101 24.3379 )
Norm@50keV  : 9.11556E-03    ( -0.00116876   0.00124246 )
------------------------------------------------------------
#Fit statistic : Chi-Squared =          68.02 using 59 PHA bins.
# Reduced chi-squared =          1.215 for     56 degrees of freedom
# Null hypothesis probability =   1.301760e-01

Photon flux (15-150 keV)    in 6.28 sec: 1.07971 (    ) ph/cm2/s
Energy fluence (15-150 keV)             : 0 ( 0  0 ) ergs/cm2
1-s peak spectrum fit
Power-law model
Time interval is from    0.276 sec. to    1.276 sec.

Spectral model in power-law:
------------------------------------------------------------
Parameters  : value       lower 90%   higher 90%
Photon index: -2.06577     ( -0.150295   0.144621 )
Norm@50keV  : 1.48119E-02    ( -0.00139548   0.00137035 )
------------------------------------------------------------
#Fit statistic : Chi-Squared =          69.45 using 59 PHA bins.
# Reduced chi-squared =          1.218 for     57 degrees of freedom
# Null hypothesis probability =   1.246878e-01

Photon flux (15-150 keV)    in 1 sec: 2.29188 ( -0.16614  0.16628 ) ph/cm2/s
Energy fluence (15-150 keV)             : 1.37224e-07 ( -1.17048e-08  1.19077e-08 ) ergs/cm2
Cutoff power-law model

Time interval is from    0.276 sec. to    1.276 sec.
Spectral model in the cutoff power-law:
------------------------------------------------------------
Parameters  : value       lower 90%   higher 90%
Photon index: -1.85118     ( -0.251885   0.636182 )
Epeak [keV] : 29.0318      ( -24.0065 -29.0322 )
Norm@50keV  : 1.96577E-02    (     )
------------------------------------------------------------
#Fit statistic : Chi-Squared =          69.03 using 59 PHA bins.
# Reduced chi-squared =          1.233 for     56 degrees of freedom
# Null hypothesis probability =   1.133859e-01

Photon flux (15-150 keV)    in 1 sec: 2.26632 ( -0.17893  0.17664 ) ph/cm2/s
Energy fluence (15-150 keV)             : 0 ( 0  0 ) ergs/cm2
Time-resolved spectra
Distribution
T90 vs. Hardness ratio plot
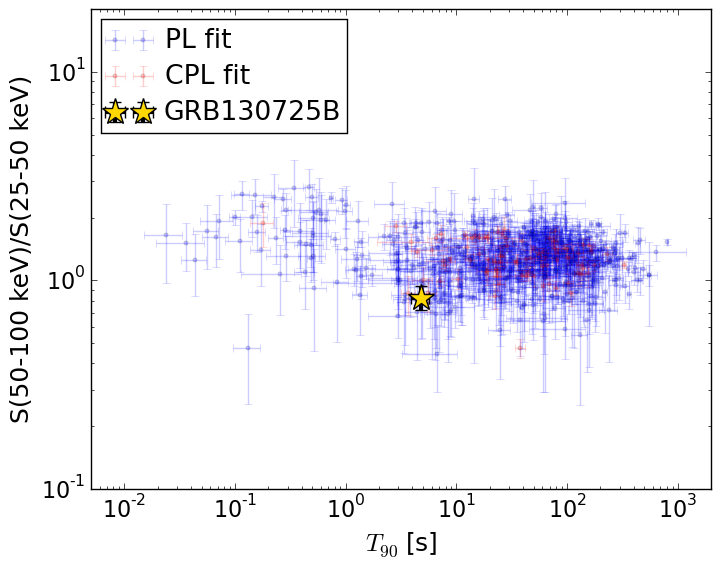
T90                                   = 4.776 sec.
Hardness ratio (energy fluence ratio) = 0.825866809365
S(15-50 keV) vs. S(50-150 keV) plot
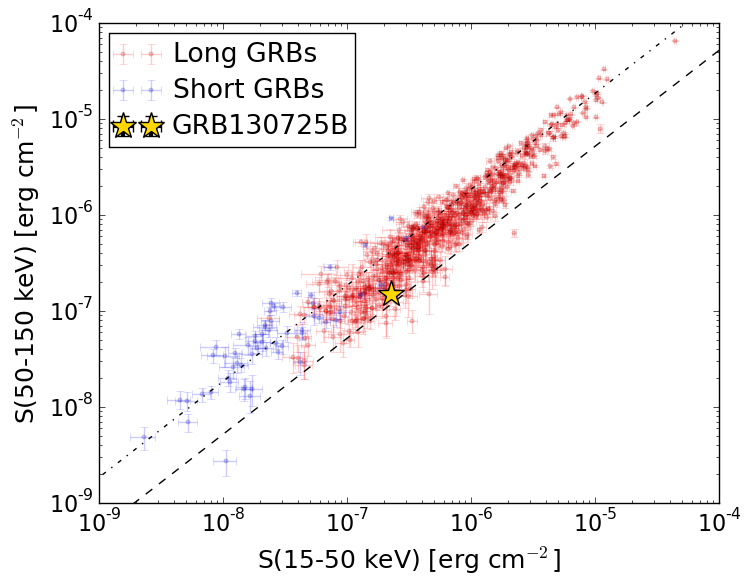
S(15-50 keV)  = 2.253626e-07
S(50-150 keV) = 1.4952888e-07
The dash-dotted line and the dashed line traces the fluences calculated from the Band function with Epeak = 15 and 150 keV, respectively. Both lines assume a canonical values of alpha = -1 and beta = -2.5.
Mask shadow pattern
IMX = -3.004419539939238E-01, IMY = 1.912158196150189E-01
Spacecraft aspect plot
Bright source in the pre-burst/pre-slew/post-slew images
Pre-burst image of 15-350 keV band
Time interval of the image:
-239.432000 -0.384000

# RAcent  DECcent POSerr Theta    Phi  PeakCts   SNR AngSep     Name
#  [deg]    [deg]    ['] [deg]  [deg]                   [']
244.9831 -15.6390    0.4  22.0  118.2   7.2207  30.9    0.2	Sco X-1
254.3773  35.4716    5.5  41.6   10.3   0.6766   2.1    8.7	Her X-1
255.9545 -37.9673    2.6  45.4  130.9  -4.1943  -4.4    7.5	4U 1700-377
256.6170 -36.4165    5.3  44.5  128.9  -1.7821  -2.2    8.8	GX 349+2
268.3976  -1.3710    6.2  38.4   72.8   1.4078   1.8    5.2	SW J1753.5-0127
203.0348  45.4840    3.4  50.7  -44.4   4.0695   3.4 ------	UNKNOWN
Pre-slew background subtracted image of 15-350 keV band
Time interval of the image:
-0.384000 5.896000

# RAcent  DECcent POSerr Theta    Phi  PeakCts   SNR AngSep     Name
#  [deg]    [deg]    ['] [deg]  [deg]                   [']
244.8700 -15.4979    5.9  21.8  118.2  -0.0629  -2.0   10.6	Sco X-1
254.4854  35.2477   14.2  41.4   10.6   0.0360   0.8    5.8	Her X-1
255.8421 -37.7705    7.7  45.2  130.8  -0.1748  -1.5    8.2	4U 1700-377
256.5542 -36.5519    0.0  44.6  129.1   0.1125   0.9    9.6	GX 349+2
268.3368  -1.5708    5.1  38.4   73.2  -0.2212  -2.3    7.3	SW J1753.5-0127
257.2546 -35.5677    2.3  44.2  127.6   0.6056   5.0 ------	UNKNOWN
245.5618 -48.2567    2.2  50.7  146.5   0.7824   5.4 ------	UNKNOWN
219.3631 -44.7038    2.2  46.3  170.3   0.3116   5.2 ------	UNKNOWN
214.0937 -33.3361    2.6  37.1 -177.9   0.1657   4.4 ------	UNKNOWN
214.2366 -11.1198    0.4  19.6 -147.5   0.7838  29.3 ------	UNKNOWN
195.7320 -14.0264    2.4  37.0 -134.9   0.2038   4.8 ------	UNKNOWN
Post-slew image of 15-350 keV band
Time interval of the image:
52.068580 962.655900

# RAcent  DECcent POSerr Theta    Phi  PeakCts   SNR AngSep     Name
#  [deg]    [deg]    ['] [deg]  [deg]                   [']
186.4962 -62.7907    5.8  55.3  175.9   4.9012   2.0    4.6	GX 301-2
244.9912 -15.6343    0.4  30.2   82.9  30.1499  32.4    0.8	Sco X-1
207.6280  47.4892    3.7  58.9  -24.3  12.1356   3.2 ------	UNKNOWN
186.7748  27.6056    4.5  47.0  -53.1   7.8035   2.6 ------	UNKNOWN