Analysis Summary
Notes:
- 1) No attempt has been made to eliminate the non-significant decimal places.
- 2) This batgrbproduct analysis is done using the HEASARC data.
- 3) This batgrbproduct analysis is using the flight position for the mask-weighting calculation.
======================================================================
                  BAT GRB EVENT DATA PROCESSING REPORT
    Process Script Ver: batgrbproduct v2.46
    Process Start Time: Sun Jan 12 00:17:33 EST 2014
             Host Name: batevent1
   Current Working Dir: /local/data/batevent/batevent_reproc/trigger564342
======================================================================

  Trigger: 00564342      Segment: 000

  BAT Trigger Time: 396636330.368   [s; MET]
      Trigger Stop: 396636330.88   [s; MET]
               UTC: 2013-07-27T16:45:19.527420    [includes UTCF correction]
       Where From?: TDRSS position message

  BAT
    RA: 330.800295251903   Dec: -65.5747492149887  [deg; J2000]

     Catalogged Source?: NO
     Point Source?:      YES
     GRB Indicated?:     YES    [ by BAT flight software ]
     Image S/N Ratio:    8.9
     Image Trigger?:     NO
     Rate S/N Ratio:     15.0332963783729  [ if not an image trigger ]
     Image S/N Ratio:    8.9

  Analysis Position:   [ source = BAT ]
    RA: 330.800295251903   Dec: -65.5747492149887  [deg; J2000]

  Refined Position:   [ source = BAT pre-slew burst ]
    RA: 330.789523299815   Dec: -65.5395120829443  [deg; J2000]
        { 22h 03m 09.5s , -65d 32' 22.2" }
         +/- 0.61200183010035 [arcmin] (estimated 90% radius based on SNR)
         +/- 0.213156397295097 [arcmin] (formal 1-sigma fit error)
    SNR: 61.3419178746699

  Angular difference between the analysis and refined position is 2.131075 arcmin

  Partial Coding Fraction: 0.5    [ including projection effects ]

  Duration
     T90: 13.5639999508858 +/- 0.803482449981413
        Measured from: 0.916000008583069
                   to: 14.4799999594688     [s; relative to TRIGTIME]
     T50: 6.03199994564056 +/- 0.362436218096313
        Measured from: 3.45200002193451
                   to: 9.48399996757507     [s; relative to TRIGTIME]


  Fluence
     Peak Flux  (peak 1 second)
        Measured from: 7.42400002479553
                   to: 8.42400002479553     [s; relative to TRIGTIME]
     Total Fluence
        Measured from: -1.07599997520447
                   to: 24.3800000548363     [s; relative to TRIGTIME]

             Band 1     Band 2     Band 3     Band 4
              15-25      25-50     50-100    100-350     keV
 Total     1.681431   2.307582   1.683496   0.418535
           0.041656   0.044289   0.038611   0.029556 [error]
 Peak      0.205625   0.303360   0.245564   0.061734
           0.010570   0.012171   0.011063   0.007643 [error]

     [ fluence units of on-axis counts / fully illuminated detector ]

======================================================================


====== Table of the duration information =============================

        Value   tstart    tstop
T100   25.456   -1.076   24.380
T90    13.564    0.916   14.480
T50     6.032    3.452    9.484
Peak    1.000    7.424    8.424


====== Spectral Analysis Summary =====================================

Model      : spectral model: simple power-law (PL) and cutoff power-law (CPL)
Ph_index   : photon index: E^{Ph_index}
Ph_90err   : 90% error of the photon index
Epeak      : Epeak in keV
Epeak_90err: 90% error of Epeak
Norm       : normalization at 50 keV in both the PL model and CPL model
Nomr_90err : 90% error of the normalization
chi2       : Chi-Squared
dof        : degree of freedo

=== Time-averaged spectral analysis ===
(Best model with acceptable fit: PL)

Model Ph_index Ph_90err_low Ph_90err_hi  Epeak  Epeak_90err_low  Epeak_90err_hi  Norm       Nomr_90err_low    Norm_90err_hi    chi2    dof
PL      -1.652    -0.047      0.047       -           -               -         1.62e-02     -4.03e-04          4.03e-04      53.840   57
CPL     -1.422    -0.189      0.197      137.800     -39.382       326.118      2.07e-02     -3.66e-03          4.67e-03      49.530   56


=== 1-s peak spectral analysis ===
(Best model with acceptable fit: CPL)

Model Ph_index Ph_90err_low Ph_90err_hi  Epeak  Epeak_90err_low  Epeak_90err_hi  Norm       Nomr_90err_low    Norm_90err_hi    chi2    dof
PL      -1.533     -0.078     0.077       -           -               -         5.54e-02     -2.53e-03          2.53e-03      65.380   57
CPL     -1.044     -0.320     0.344      104.191     -23.069        91.725      9.51e-02     -2.77e-02          4.27e-02      58.370   56


=== Fluence/Peak Flux Summary ===

              Model    Band1     Band2     Band3     Band4     Band5     Total
                       15-25     25-50    50-100    100-350    15-150    15-350    keV
Fluence         PL   6.08e-07  1.02e-06  1.29e-06  3.30e-06  3.84e-06  6.22e-06   erg/cm2
      90%_error_low -2.98e-08 -2.92e-08 -4.00e-08 -2.25e-07 -9.80e-08 -2.48e-07   erg/cm2
      90%_error_hi   3.04e-08  2.91e-08  3.98e-08  2.36e-07  9.81e-08  2.56e-07   erg/cm2
Peak flux       PL   2.35e+00  2.32e+00  1.61e+00  1.75e+00  6.98e+00  8.04e+00   ph/cm2/s
      90%_error_low -1.88e-01 -1.16e-01 -8.95e-02 -1.93e-01 -3.30e-01 -3.63e-01   ph/cm2/s
      90%_error_hi   1.93e-01  1.15e-01  8.90e-02  2.06e-01  3.31e-01  3.63e-01   ph/cm2/s

Fluence        CPL   5.75e-07  1.03e-06  1.32e-06  2.46e-06  3.78e-06  5.39e-06   erg/cm2
      90%_error_low -3.90e-08 -3.15e-08 -4.51e-08 -5.09e-07 -1.08e-07 -5.18e-07   erg/cm2
      90%_error_hi   3.98e-08  3.17e-08  4.55e-08  6.71e-07  1.08e-07  6.73e-07   erg/cm2
Peak flux      CPL   2.12e+00  2.41e+00  1.69e+00  1.10e+00  6.82e+00  7.32e+00   ph/cm2/s
      90%_error_low -2.36e-01 -1.31e-01 -1.06e-01 -2.79e-01 -3.45e-01 -4.64e-01   ph/cm2/s
      90%_error_hi   2.41e-01  1.32e-01  1.08e-01  3.91e-01  3.46e-01  5.22e-01   ph/cm2/s

======================================================================
Image
Pre-slew 15.0-350.0 keV image (Event data)
#   RAcent    DECcent   POSerr    Theta     Phi              Peak Cts       SNR   Name
  330.7895   -65.5395   0.0031    38.8219    10.0825         6.3926952     61.342 TRIG_00564342

Foreground time interval of the image:
 -1.076  24.380 (delta_t =  25.456 [sec])
Background time interval of the image:
-239.368  -1.076 (delta_t = 238.292 [sec])
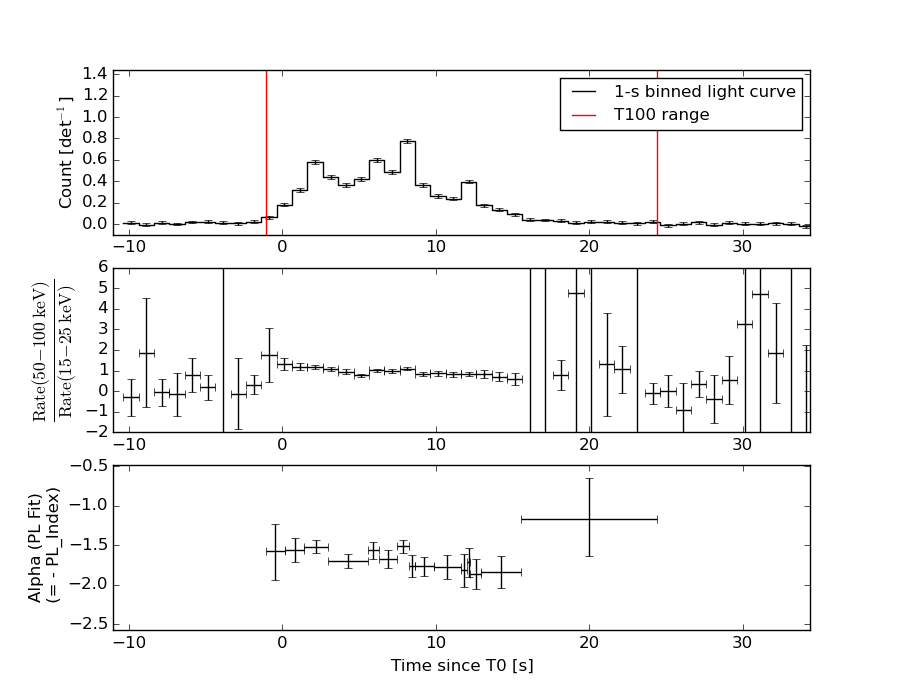
Light Curves
Note: The mask-weighted lightcurves have units of either count/det or counts/sec/det, where a det is 0.4 x 0.4 = 0.16 sq cm.
Full-time range; 1 s binning
Other quick-look light curves:
- 64 ms binning (zoomed)
- 16 ms binning (zoomed)
- 8 ms binning (zoomed)
- 2 ms binning (zoomed)
- SN=5 or 10 s binning (full-time range)
- Raw light curve
Spectra
- 64 ms binning (zoomed)
- 16 ms binning (zoomed)
- 8 ms binning (zoomed)
- 2 ms binning (zoomed)
- SN=5 or 10 s binning (full-time range)
- Raw light curve
Spectra
Notes:
- 1) The fitting includes the systematic errors.
- 2) When the burst includes telescope slew time periods, the fitting uses an average response file made from multiple 5-s response files through out the slew time plus single time preiod for the non-slew times, and weighted by the total counts in the corresponding time period using addrmf. An average response file is needed becuase a spectral fit using the pre-slew DRM will introduce some errors in both a spectral shape and a normalization if the PHA file contains a lot of the slew/post-slew time interval.
- 3) For fits to more complicated models (e.g. a power-law over a cutoff power-law), the BAT team has decided to require a chi-square improvement of more than 6 for each extra dof.
Time averaged spectrum fit using the average DRM
Power-law model
Time interval is from   -1.076 sec. to   24.380 sec.

Spectral model in power-law:
------------------------------------------------------------
Parameters  : value       lower 90%   higher 90%
Photon index: -1.6523     ( -0.0469658   0.0468738 )
Norm@50keV  : 1.61994E-02    ( -0.000403308   0.000403278 )
------------------------------------------------------------
#Fit statistic : Chi-Squared =          53.84 using 59 PHA bins.
# Reduced chi-squared =         0.9445 for     57 degrees of freedom
# Null hypothesis probability =   5.944988e-01

Photon flux (15-150 keV)    in 25.46 sec: 2.11693 ( -0.0605  0.06073 ) ph/cm2/s
Energy fluence (15-150 keV)             : 3.83547e-06 ( -9.79968e-08  9.81111e-08 ) ergs/cm2
Cutoff power-law model
Time interval is from   -1.076 sec. to   24.380 sec.
Spectral model in the cutoff power-law:
------------------------------------------------------------
Parameters  : value       lower 90%   higher 90%
Photon index: -1.42243     ( -0.189242   0.19745 )
Epeak [keV] : 137.800      ( -39.3829 326.117 )
Norm@50keV  : 2.06552E-02    ( -0.00366105   0.00466951 )
------------------------------------------------------------
#Fit statistic : Chi-Squared =          49.53 using 59 PHA bins.
# Reduced chi-squared =         0.8844 for     56 degrees of freedom
# Null hypothesis probability =   7.168025e-01

Photon flux (15-150 keV)    in 25.46 sec: 2.07846 ( -0.06737  0.06778 ) ph/cm2/s
Energy fluence (15-150 keV)             : 3.78058e-06 ( -1.08194e-07  1.07796e-07 ) ergs/cm2
1-s peak spectrum fit
Power-law model
Time interval is from    7.424 sec. to    8.424 sec.

Spectral model in power-law:
------------------------------------------------------------
Parameters  : value       lower 90%   higher 90%
Photon index: -1.53284     ( -0.0779907   0.0774715 )
Norm@50keV  : 5.54340E-02    ( -0.00252905   0.00252633 )
------------------------------------------------------------
#Fit statistic : Chi-Squared =          65.38 using 59 PHA bins.
# Reduced chi-squared =          1.147 for     57 degrees of freedom
# Null hypothesis probability =   2.086091e-01

Photon flux (15-150 keV)    in 1 sec: 6.98343 ( -0.33019  0.33074 ) ph/cm2/s
Energy fluence (15-150 keV)             : 5.23239e-07 ( -2.55019e-08  2.55811e-08 ) ergs/cm2
Cutoff power-law model
Time interval is from    7.424 sec. to    8.424 sec.
Spectral model in the cutoff power-law:
------------------------------------------------------------
Parameters  : value       lower 90%   higher 90%
Photon index: -1.04446     ( -0.320078   0.344315 )
Epeak [keV] : 104.191      ( -23.0685 91.7249 )
Norm@50keV  : 9.50822E-02    ( -0.0277306   0.042654 )
------------------------------------------------------------
#Fit statistic : Chi-Squared =          58.37 using 59 PHA bins.
# Reduced chi-squared =          1.042 for     56 degrees of freedom
# Null hypothesis probability =   3.883314e-01

Photon flux (15-150 keV)    in 1 sec: 6.82279 ( -0.34506  0.34594 ) ph/cm2/s
Energy fluence (15-150 keV)             : 5.10717e-07 ( -2.71574e-08  2.7082e-08 ) ergs/cm2
Time-resolved spectra
Distribution
T90 vs. Hardness ratio plot
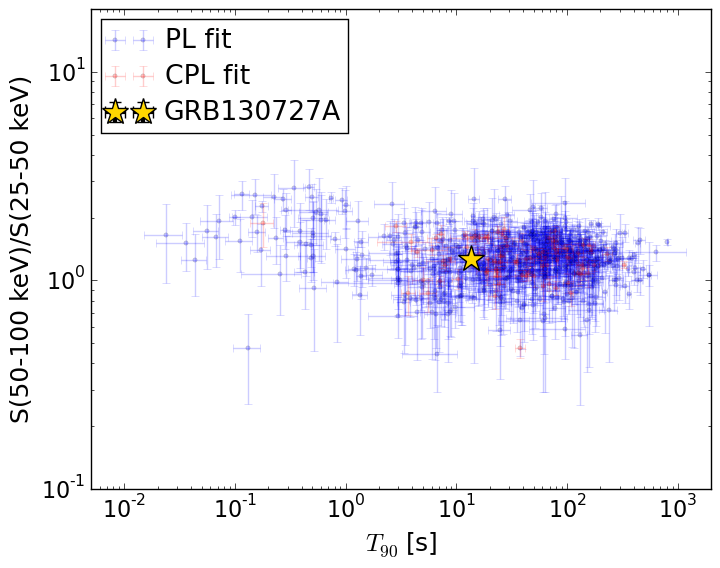
T90                                   = 13.564 sec.
Hardness ratio (energy fluence ratio) = 1.27256583421
S(15-50 keV) vs. S(50-150 keV) plot
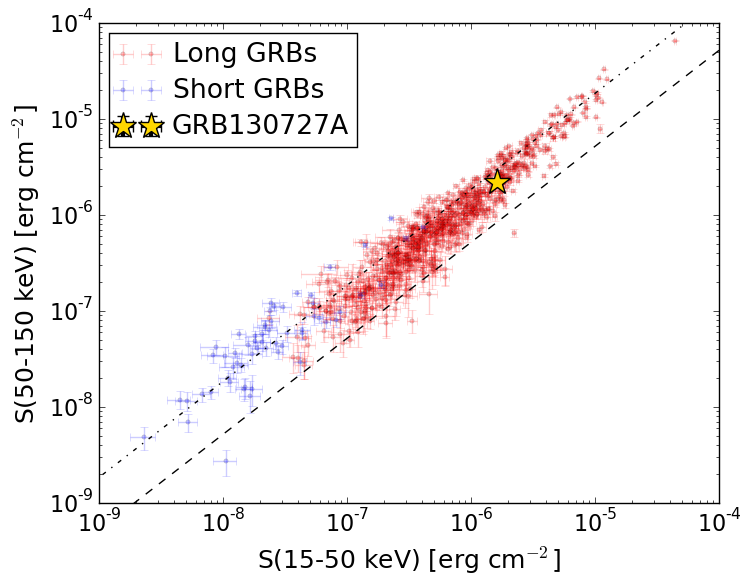
S(15-50 keV)  = 1.6252129e-06
S(50-150 keV) = 2.2103017e-06
The dash-dotted line and the dashed line traces the fluences calculated from the Band function with Epeak = 15 and 150 keV, respectively. Both lines assume a canonical values of alpha = -1 and beta = -2.5.
Mask shadow pattern
IMX = 7.922234819555326E-01, IMY = -1.408675191033983E-01
Spacecraft aspect plot
Bright source in the pre-burst/pre-slew/post-slew images
Pre-burst image of 15-350 keV band
Time interval of the image:
-239.368000 -1.076000

# RAcent  DECcent POSerr Theta    Phi  PeakCts   SNR AngSep     Name
#  [deg]    [deg]    ['] [deg]  [deg]                   [']
350.6354  16.6516    3.1  50.5  152.5   2.5899   3.7 ------	UNKNOWN
291.8941 -66.3877    2.5  53.6   17.2   3.4713   4.6 ------	UNKNOWN
326.7164 -53.5174    2.4  33.9   29.0   0.9802   4.7 ------	UNKNOWN
 10.4588 -35.5259    2.3   6.4  -68.3   0.7088   5.1 ------	UNKNOWN
 63.5793 -55.4342    2.9  47.1  -53.1   3.0735   4.0 ------	UNKNOWN
Pre-slew background subtracted image of 15-350 keV band
Time interval of the image:
-1.076000 24.380000

# RAcent  DECcent POSerr Theta    Phi  PeakCts   SNR AngSep     Name
#  [deg]    [deg]    ['] [deg]  [deg]                   [']
330.7896 -65.5395    0.2  38.8   10.1   6.3925  61.2 ------	UNKNOWN
 44.0057 -45.1262    3.2  33.5  -66.6   0.3765   3.6 ------	UNKNOWN
 61.5355 -68.0344    2.2  48.4  -36.0   0.9608   5.3 ------	UNKNOWN
 59.1662 -48.7671    2.1  44.1  -62.2   1.2487   5.5 ------	UNKNOWN
 56.6755 -43.8716    2.4  42.4  -69.4   1.2381   4.8 ------	UNKNOWN
Post-slew image of 15-350 keV band
Time interval of the image:
789.832600 962.736500

# RAcent  DECcent POSerr Theta    Phi  PeakCts   SNR AngSep     Name
#  [deg]    [deg]    ['] [deg]  [deg]                   [']
 83.6584  22.0223    1.2  53.0 -141.1   7.8559  10.0    1.5	Crab
135.5268 -40.5494    2.7  44.4  -25.9   0.9824   4.2    0.3	Vela X-1
 67.7056 -74.5647    3.1  44.1   41.1   1.4073   3.7 ------	UNKNOWN
111.7893  -2.1863    3.7  40.8  -92.8   1.9602   3.1 ------	UNKNOWN