Analysis Summary
Notes:
- 1) No attempt has been made to eliminate the non-significant decimal places.
- 2) This batgrbproduct analysis is done using the HEASARC data.
- 3) This batgrbproduct analysis is using the flight position for the mask-weighting calculation.
======================================================================
                  BAT GRB EVENT DATA PROCESSING REPORT
    Process Script Ver: batgrbproduct v2.46
    Process Start Time: Sat Jan 11 23:58:33 EST 2014
             Host Name: batevent1
   Current Working Dir: /local/data/batevent/batevent_reproc/trigger565651
======================================================================

  Trigger: 00565651      Segment: 000

  BAT Trigger Time: 397563954.176   [s; MET]
      Trigger Stop: 397563955.2   [s; MET]
               UTC: 2013-08-07T10:25:43.293700    [includes UTCF correction]
       Where From?: TDRSS position message

  BAT
    RA: 269.801145760052   Dec: -27.6125375193907  [deg; J2000]

     Catalogged Source?: NO
     Point Source?:      YES
     GRB Indicated?:     YES    [ by BAT flight software ]
     Image S/N Ratio:    9.29
     Image Trigger?:     NO
     Rate S/N Ratio:     12.9614813968157  [ if not an image trigger ]
     Image S/N Ratio:    9.29

  Analysis Position:   [ source = BAT ]
    RA: 269.801145760052   Dec: -27.6125375193907  [deg; J2000]

  Refined Position:   [ source = BAT pre-slew burst ]
    RA: 269.813247579641   Dec: -27.6161169019761  [deg; J2000]
        { 17h 59m 15.2s , -27d 36' 58.0" }
         +/- 1.4202806312892 [arcmin] (estimated 90% radius based on SNR)
         +/- 0.504748951749897 [arcmin] (formal 1-sigma fit error)
    SNR: 18.4264215336693

  Angular difference between the analysis and refined position is 0.678293 arcmin

  Partial Coding Fraction: 0.9296875    [ including projection effects ]

  Duration
     T90: 293.039999902248 +/- 26.6104443523493
        Measured from: -2.51999998092651
                   to: 290.519999921322     [s; relative to TRIGTIME]
     T50: 191.739999949932 +/- 14.3740012263483
        Measured from: 12.9319999814034
                   to: 204.671999931335     [s; relative to TRIGTIME]


  Fluence
     Peak Flux  (peak 1 second)
        Measured from: -0.448000013828278
                   to: 0.551999986171722     [s; relative to TRIGTIME]
     Total Fluence
        Measured from: -6.83600002527237
                   to: 319.195999979973     [s; relative to TRIGTIME]

             Band 1     Band 2     Band 3     Band 4
              15-25      25-50     50-100    100-350     keV
 Total     1.159788   1.436555   1.010835   0.156287
           0.108975   0.096385   0.079927   0.067530 [error]
 Peak      0.026527   0.042001   0.033252   0.007903
           0.006155   0.005911   0.005169   0.004108 [error]

     [ fluence units of on-axis counts / fully illuminated detector ]

======================================================================


====== Table of the duration information =============================

        Value   tstart    tstop
T100  326.032   -6.836  319.196
T90   293.040   -2.520  290.520
T50   191.740   12.932  204.672
Peak    1.000   -0.448    0.552


====== Spectral Analysis Summary =====================================

Model      : spectral model: simple power-law (PL) and cutoff power-law (CPL)
Ph_index   : photon index: E^{Ph_index}
Ph_90err   : 90% error of the photon index
Epeak      : Epeak in keV
Epeak_90err: 90% error of Epeak
Norm       : normalization at 50 keV in both the PL model and CPL model
Nomr_90err : 90% error of the normalization
chi2       : Chi-Squared
dof        : degree of freedo

=== Time-averaged spectral analysis ===
(Best model with acceptable fit: PL)

Model Ph_index Ph_90err_low Ph_90err_hi  Epeak  Epeak_90err_low  Epeak_90err_hi  Norm       Nomr_90err_low    Norm_90err_hi    chi2    dof
PL      -1.640    -0.134      0.133       -           -               -         7.31e-04     -5.68e-05          5.65e-05      70.800   57
CPL     -0.918    -0.572      0.660       72.719     -15.365        86.373      1.71e-03     -8.24e-04          1.94e-03      66.040   56


=== 1-s peak spectral analysis ===
(Best model with acceptable fit: N/A)

Model Ph_index Ph_90err_low Ph_90err_hi  Epeak  Epeak_90err_low  Epeak_90err_hi  Norm       Nomr_90err_low    Norm_90err_hi    chi2    dof
PL      -1.467     -0.275     0.271       -           -               -         6.75e-03     -1.14e-03          1.13e-03      73.330   57
CPL      0.143     -1.306     1.893       68.103     -15.213        71.572      4.14e-02     -4.14e-02          2.89e-01      68.630   56


=== Fluence/Peak Flux Summary ===

              Model    Band1     Band2     Band3     Band4     Band5     Total
                       15-25     25-50    50-100    100-350    15-150    15-350    keV
Fluence         PL   3.47e-07  5.85e-07  7.51e-07  1.94e-06  2.22e-06  3.62e-06   erg/cm2
      90%_error_low -4.30e-08 -4.52e-08 -7.68e-08 -3.91e-07 -1.82e-07 -4.59e-07   erg/cm2
      90%_error_hi   4.46e-08  4.51e-08  7.68e-08  4.54e-07  1.84e-07  5.08e-07   erg/cm2
Peak flux       PL   2.69e-01  2.76e-01  2.00e-01  2.32e-01  8.36e-01  9.77e-01   ph/cm2/s
      90%_error_low -7.20e-02 -4.95e-02 -4.10e-02 -8.29e-02 -1.41e-01 -1.64e-01   ph/cm2/s
      90%_error_hi   7.83e-02  4.90e-02  4.07e-02  1.07e-01  1.42e-01  1.65e-01   ph/cm2/s

Fluence        CPL   3.08e-07  6.26e-07  7.70e-07  7.25e-07  2.09e-06  2.43e-06   erg/cm2
      90%_error_low -5.27e-08 -5.57e-08 -8.46e-08 -3.59e-07 -2.07e-07 -4.16e-07   erg/cm2
      90%_error_hi   5.37e-08  5.72e-08  8.50e-08  8.10e-07  2.10e-07  8.21e-07   erg/cm2
Peak flux      CPL   1.94e-01  3.10e-01  2.26e-01  6.47e-02  7.80e-01  7.94e-01   ph/cm2/s
      90%_error_low -8.69e-02 -6.02e-02 -5.00e-02 -6.47e-02 -1.48e-01 -1.58e-01   ph/cm2/s
      90%_error_hi   9.66e-02  6.28e-02  5.14e-02  1.12e-01  1.49e-01  1.76e-01   ph/cm2/s

======================================================================
Image
Pre-slew 15.0-350.0 keV image (Event data)
#   RAcent    DECcent   POSerr    Theta     Phi              Peak Cts       SNR   Name
  269.8132   -27.6161   0.0105    24.7844  -167.8735         1.0357705     18.426 TRIG_00565651

Foreground time interval of the image:
 -6.836  17.925 (delta_t =  24.761 [sec])
Background time interval of the image:
-149.075  -6.836 (delta_t = 142.239 [sec])
Light Curves
Note: The mask-weighted lightcurves have units of either count/det or counts/sec/det, where a det is 0.4 x 0.4 = 0.16 sq cm.
Full-time range; 1 s binning
Other quick-look light curves:
- 64 ms binning (zoomed)
- 16 ms binning (zoomed)
- 8 ms binning (zoomed)
- 2 ms binning (zoomed)
- SN=5 or 10 s binning (full-time range)
- Raw light curve
Spectra
- 64 ms binning (zoomed)
- 16 ms binning (zoomed)
- 8 ms binning (zoomed)
- 2 ms binning (zoomed)
- SN=5 or 10 s binning (full-time range)
- Raw light curve
Spectra
Notes:
- 1) The fitting includes the systematic errors.
- 2) When the burst includes telescope slew time periods, the fitting uses an average response file made from multiple 5-s response files through out the slew time plus single time preiod for the non-slew times, and weighted by the total counts in the corresponding time period using addrmf. An average response file is needed becuase a spectral fit using the pre-slew DRM will introduce some errors in both a spectral shape and a normalization if the PHA file contains a lot of the slew/post-slew time interval.
- 3) For fits to more complicated models (e.g. a power-law over a cutoff power-law), the BAT team has decided to require a chi-square improvement of more than 6 for each extra dof.
Time averaged spectrum fit using the average DRM
Power-law model
Time interval is from   -6.836 sec. to  319.196 sec.

Spectral model in power-law:
------------------------------------------------------------
Parameters  : value       lower 90%   higher 90%
Photon index: -1.63975     ( -0.134034   0.132627 )
Norm@50keV  : 7.30618E-04    ( -5.6796e-05   5.6494e-05 )
------------------------------------------------------------
#Fit statistic : Chi-Squared =          70.80 using 59 PHA bins.
# Reduced chi-squared =          1.242 for     57 degrees of freedom
# Null hypothesis probability =   1.034102e-01

Photon flux (15-150 keV)    in 326 sec: 9.50843E-02 ( -0.0073148  0.0073327 ) ph/cm2/s
Energy fluence (15-150 keV)             : 2.21783e-06 ( -1.8225e-07  1.83922e-07 ) ergs/cm2
Cutoff power-law model
Time interval is from   -6.836 sec. to  319.196 sec.
Spectral model in the cutoff power-law:
------------------------------------------------------------
Parameters  : value       lower 90%   higher 90%
Photon index: -0.918447     ( -0.572069   0.659525 )
Epeak [keV] : 72.7190      ( -15.365 86.3727 )
Norm@50keV  : 1.70917E-03    ( -0.000824288   0.00194481 )
------------------------------------------------------------
#Fit statistic : Chi-Squared =          66.04 using 59 PHA bins.
# Reduced chi-squared =          1.179 for     56 degrees of freedom
# Null hypothesis probability =   1.687202e-01

Photon flux (15-150 keV)    in 326 sec: 9.13465E-02 ( -0.0078814  0.0078821 ) ph/cm2/s
Energy fluence (15-150 keV)             : 2.08539e-06 ( -2.06735e-07  2.09951e-07 ) ergs/cm2
1-s peak spectrum fit
Power-law model
Time interval is from   -0.448 sec. to    0.552 sec.

Spectral model in power-law:
------------------------------------------------------------
Parameters  : value       lower 90%   higher 90%
Photon index: -1.46717     ( -0.274715   0.270846 )
Norm@50keV  : 6.75457E-03    ( -0.00113977   0.00113422 )
------------------------------------------------------------
#Fit statistic : Chi-Squared =          73.33 using 59 PHA bins.
# Reduced chi-squared =          1.287 for     57 degrees of freedom
# Null hypothesis probability =   7.144104e-02

Photon flux (15-150 keV)    in 1 sec: 0.836022 ( -0.141167  0.141629 ) ph/cm2/s
Energy fluence (15-150 keV)             : 6.44451e-08 ( -1.17221e-08  1.18892e-08 ) ergs/cm2
Cutoff power-law model
Time interval is from   -0.448 sec. to    0.552 sec.
Spectral model in the cutoff power-law:
------------------------------------------------------------
Parameters  : value       lower 90%   higher 90%
Photon index: 0.143431     ( -1.30625   1.89319 )
Epeak [keV] : 68.1035      ( -15.2133 71.5722 )
Norm@50keV  : 4.13885E-02    ( -0.0413885   0.288869 )
------------------------------------------------------------
#Fit statistic : Chi-Squared =          68.63 using 59 PHA bins.
# Reduced chi-squared =          1.225 for     56 degrees of freedom
# Null hypothesis probability =   1.198857e-01

Photon flux (15-150 keV)    in 1 sec: 0.780045 ( -0.148313  0.148893 ) ph/cm2/s
Energy fluence (15-150 keV)             : 5.86935e-08 ( -1.22045e-08  1.27199e-08 ) ergs/cm2
Time-resolved spectra
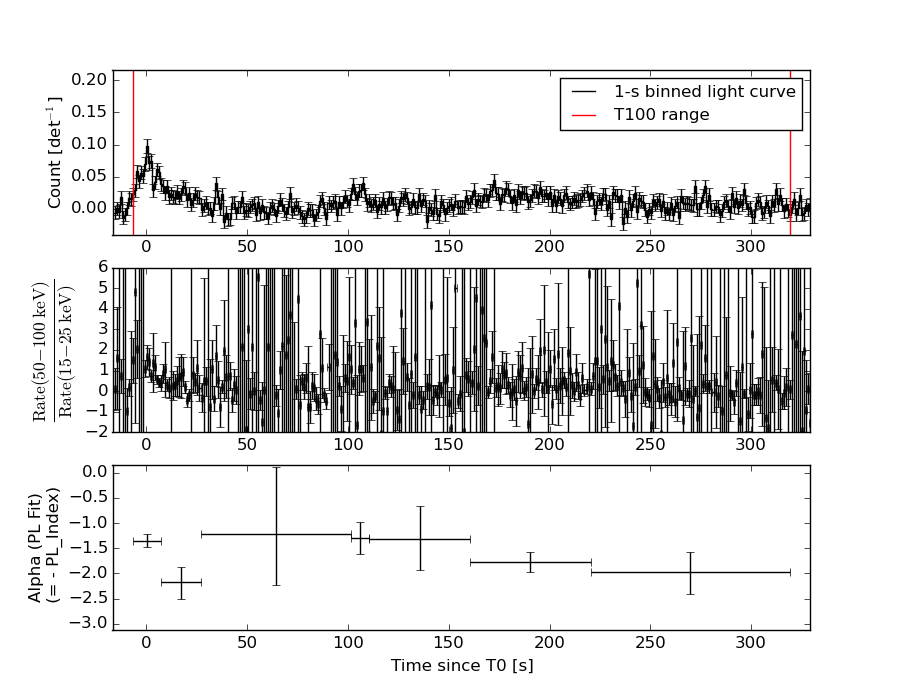
Distribution
T90 vs. Hardness ratio plot
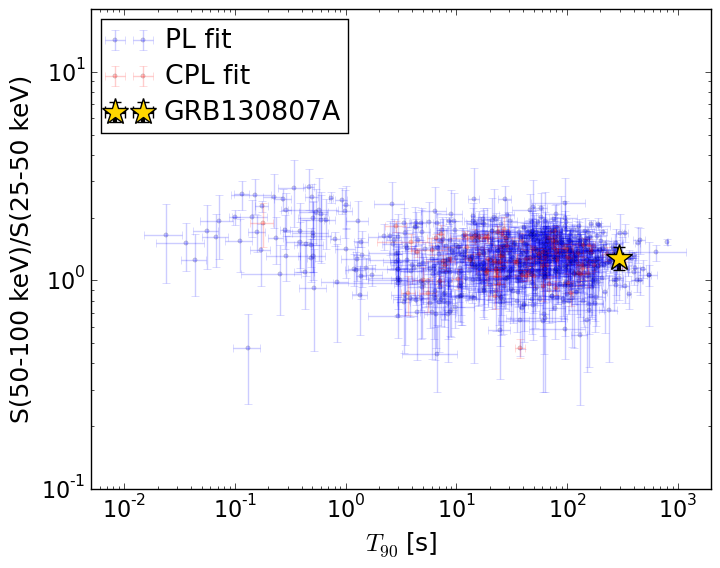
T90                                   = 293.04 sec.
Hardness ratio (energy fluence ratio) = 1.28366008426
S(15-50 keV) vs. S(50-150 keV) plot
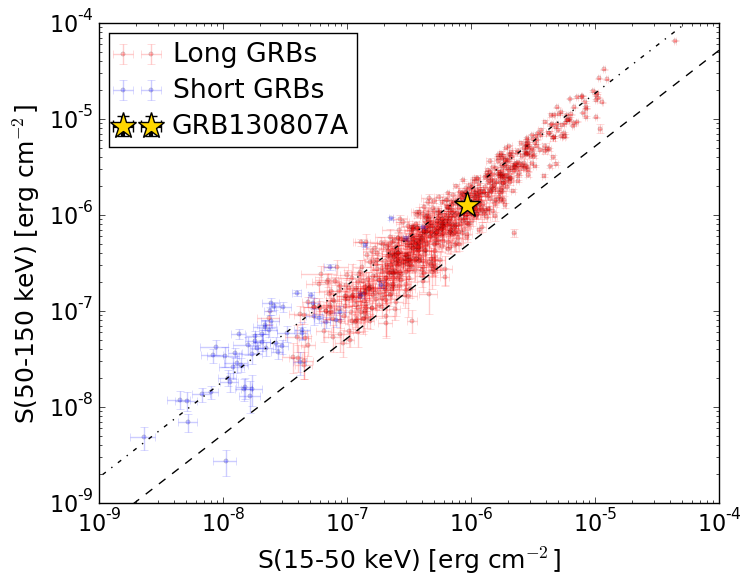
S(15-50 keV)  = 9.319897e-07
S(50-150 keV) = 1.2858337e-06
The dash-dotted line and the dashed line traces the fluences calculated from the Band function with Epeak = 15 and 150 keV, respectively. Both lines assume a canonical values of alpha = -1 and beta = -2.5.
Mask shadow pattern
IMX = -4.514319169079626E-01, IMY = 9.699713905324081E-02
Spacecraft aspect plot
Bright source in the pre-burst/pre-slew/post-slew images
Pre-burst image of 15-350 keV band
Time interval of the image:
-149.075400 -6.836000

# RAcent  DECcent POSerr Theta    Phi  PeakCts   SNR AngSep     Name
#  [deg]    [deg]    ['] [deg]  [deg]                   [']
244.9811 -15.6360    0.3  36.3 -120.4  10.6275  38.1    0.3	Sco X-1
254.5398  35.2985    4.7  47.0  -39.6   0.9019   2.4    4.8	Her X-1
255.8948 -37.8039    5.3  39.7 -159.8   0.4180   2.2    5.0	4U 1700-377
256.2906 -36.3852    9.8  38.4 -158.7   0.2153   1.2    7.4	GX 349+2
262.9838 -24.7870    2.3  25.9 -152.3   0.7603   5.1    2.8	GX 1+4
264.8460 -44.6057    8.9  41.9 -174.0  -0.2830  -1.3   10.3	4U 1735-44
268.3857  -1.5902    3.3  12.4  -85.2   0.5375   3.5    8.3	SW J1753.5-0127
270.3845 -25.0246    9.5  22.2 -166.1   0.1679   1.2    6.4	GX 5-1
270.1254 -25.8243    3.2  23.1 -166.5   0.4905   3.7   10.7	GRS 1758-258
273.9699 -14.0727    3.2  11.1 -156.6   0.4967   3.6    3.0	GX 17+2
276.0743 -30.3814    5.6  25.8  177.9   0.3333   2.0    7.8	H1820-303
284.9092 -24.7646   30.9  20.3  157.4   0.0569   0.4   11.6	HT1900.1-2455
288.8056  10.9390    0.7  18.0   17.4   2.3397  16.1    0.6	GRS 1915+105
299.6229  35.2146    2.8  44.1   12.3   1.1152   4.1    1.8	Cyg X-1
308.1269  41.0655    6.4  52.6   15.7   1.0881   1.8    6.8	Cyg X-3
263.0931 -34.0214    0.0  33.2 -163.9   0.2428   1.5   12.3	GX 354-0
266.5466 -32.2709    1.9  30.2 -167.0   1.0038   6.2 ------	UNKNOWN
246.1363 -48.9322    2.8  52.7 -162.9   1.5485   4.1 ------	UNKNOWN
248.0864  35.4585    3.1  50.5  -44.8   2.7779   3.7 ------	UNKNOWN
Pre-slew background subtracted image of 15-350 keV band
Time interval of the image:
-6.836000 17.924600

# RAcent  DECcent POSerr Theta    Phi  PeakCts   SNR AngSep     Name
#  [deg]    [deg]    ['] [deg]  [deg]                   [']
245.0154 -15.6398    5.2  36.3 -120.4  -0.2257  -2.2    2.1	Sco X-1
254.5766  35.2206    0.0  46.9  -39.6  -0.1937  -1.4    9.4	Her X-1
256.0809 -37.8590    5.8  39.6 -160.0   0.1602   2.0    4.6	4U 1700-377
256.4803 -36.4096   47.9  38.3 -158.9  -0.0190  -0.2    2.3	GX 349+2
262.8404 -24.7964    6.3  26.0 -152.1  -0.1037  -1.8    9.7	GX 1+4
264.8778 -44.4296   10.7  41.8 -174.0  -0.0856  -1.1    5.9	4U 1735-44
268.2407  -1.3244   20.1  12.6  -84.3  -0.0313  -0.6   10.8	SW J1753.5-0127
270.1058 -25.1673    6.2  22.5 -165.7   0.1020   1.8   11.0	GX 5-1
270.3295 -25.9034   10.5  23.0 -167.0  -0.0594  -1.1    9.7	GRS 1758-258
274.1248 -14.2138    0.0  11.1 -157.6  -0.1209  -2.3   12.7	GX 17+2
275.8003 -30.2244    5.9  25.6  178.5   0.1068   2.0   10.7	H1820-303
284.9113 -24.7544    0.0  20.3  157.4   0.0532   0.9   12.1	HT1900.1-2455
288.8123  10.7902   11.0  17.9   17.7   0.0572   1.0    9.4	GRS 1915+105
299.5419  35.1957    4.5  44.0   12.2  -0.2717  -2.6    2.4	Cyg X-1
308.1417  40.8384    4.2  52.4   15.9   0.6223   2.7    7.0	Cyg X-3
263.0931 -34.0214    0.0  33.2 -163.9   0.0451   0.7   12.3	GX 354-0
264.4160 -57.9651    1.9  54.5  179.7   1.2334   6.2 ------	UNKNOWN
269.8131 -27.6161    0.6  24.8 -167.9   1.0352  18.5 ------	UNKNOWN
247.6848  30.5112    2.2  47.2  -49.8   1.2272   5.3 ------	UNKNOWN
Post-slew image of 15-350 keV band
Time interval of the image:
68.524600 311.724600

# RAcent  DECcent POSerr Theta    Phi  PeakCts   SNR AngSep     Name
#  [deg]    [deg]    ['] [deg]  [deg]                   [']
244.9791 -15.6436    0.2  25.9  -63.4  19.4659  62.6    0.2	Sco X-1
256.0030 -37.7671   54.2  15.4 -130.5   0.0473   0.2    4.7	4U 1700-377
256.5004 -36.4976    2.7  14.3 -127.4   0.9691   4.3    5.5	GX 349+2
262.9980 -24.7370    3.2   6.7  -62.1   0.8577   3.7    0.8	GX 1+4
264.6147 -44.6003    3.7  17.5 -163.4   0.6985   3.2   10.6	4U 1735-44
268.2440  -1.6111    0.0  26.0    0.7  -0.1011  -0.5   12.1	SW J1753.5-0127
270.1282 -25.1955  160.8   2.4   11.2  -0.0176  -0.1   11.0	GX 5-1
270.2887 -25.7446    6.1   1.9   17.5   0.5116   2.2    0.8	GRS 1758-258
274.0958 -14.1784    5.6  14.0   21.7   0.4641   2.0   10.0	GX 17+2
276.0173 -30.3318   68.8   6.1  122.4   0.0401   0.2    5.2	H1820-303
285.0196 -24.8594    7.7  13.9   86.4   0.3583   1.5    3.8	HT1900.1-2455
288.8270  10.9546    1.7  42.7   32.4   3.5660   6.7    1.8	GRS 1915+105
263.1589 -33.6843    6.0   8.3 -134.1   0.4549   1.9   12.4	GX 354-0
314.7828 -41.6745    3.7  39.1  127.4   1.9776   3.1 ------	UNKNOWN
302.8596 -66.9702    2.3  44.2  166.5   2.6187   5.0 ------	UNKNOWN
269.8094 -27.6508    1.0   0.0 -179.4   2.5816  11.0 ------	UNKNOWN
266.5296 -32.2339    1.9   5.4 -145.0   1.4190   6.0 ------	UNKNOWN
252.6369 -48.8483    2.9  25.0 -148.4   0.9584   4.0 ------	UNKNOWN
233.6673   9.2362    2.6  50.8  -44.4   5.1286   4.4 ------	UNKNOWN
232.0623   4.1784    2.3  48.3  -50.6   5.7364   5.2 ------	UNKNOWN