Analysis Summary
Notes:
- 1) No attempt has been made to eliminate the non-significant decimal places.
- 2) This batgrbproduct analysis is done using the HEASARC data.
- 3) This batgrbproduct analysis is using the flight position for the mask-weighting calculation.
======================================================================
BAT GRB EVENT DATA PROCESSING REPORT
Process Script Ver: batgrbproduct v2.46
Process Start Time: Sat Jan 11 23:45:47 EST 2014
Host Name: batevent1
Current Working Dir: /local/data/batevent/batevent_reproc/trigger566561
======================================================================
Trigger: 00566561 Segment: 000
BAT Trigger Time: 398321629.504 [s; MET]
Trigger Stop: 398321630.528 [s; MET]
UTC: 2013-08-16T04:53:38.587620 [includes UTCF correction]
Where From?: TDRSS position message
BAT
RA: 170.092535443697 Dec: -57.5581832376266 [deg; J2000]
Catalogged Source?: NO
Point Source?: YES
GRB Indicated?: YES [ by BAT flight software ]
Image S/N Ratio: 10.39
Image Trigger?: NO
Rate S/N Ratio: 16.062378404209 [ if not an image trigger ]
Image S/N Ratio: 10.39
Analysis Position: [ source = BAT ]
RA: 170.092535443697 Dec: -57.5581832376266 [deg; J2000]
Refined Position: [ source = BAT pre-slew burst ]
RA: 170.047101745408 Dec: -57.5377683993217 [deg; J2000]
{ 11h 20m 11.3s , -57d 32' 16.0" }
+/- 1.59443637830679 [arcmin] (estimated 90% radius based on SNR)
+/- 0.555378595485049 [arcmin] (formal 1-sigma fit error)
SNR: 15.619946088531
Angular difference between the analysis and refined position is 1.907888 arcmin
Partial Coding Fraction: 0.984375 [ including projection effects ]
Duration
T90: 8.67599999904633 +/- 2.34176005165807
Measured from: -3.16400003433228
to: 5.51199996471405 [s; relative to TRIGTIME]
T50: 2.60399997234344 +/- 0.66971335751184
Measured from: -1.39200001955032
to: 1.21199995279312 [s; relative to TRIGTIME]
Fluence
Peak Flux (peak 1 second)
Measured from: 0.167999982833862
to: 1.16799998283386 [s; relative to TRIGTIME]
Total Fluence
Measured from: -3.73600000143051
to: 7.66799998283386 [s; relative to TRIGTIME]
Band 1 Band 2 Band 3 Band 4
15-25 25-50 50-100 100-350 keV
Total 0.178608 0.236588 0.105671 0.008653
0.017589 0.018012 0.015598 0.013595 [error]
Peak 0.041756 0.056238 0.031595 0.001000
0.005556 0.005804 0.004957 0.004268 [error]
[ fluence units of on-axis counts / fully illuminated detector ]
======================================================================
====== Table of the duration information =============================
Value tstart tstop
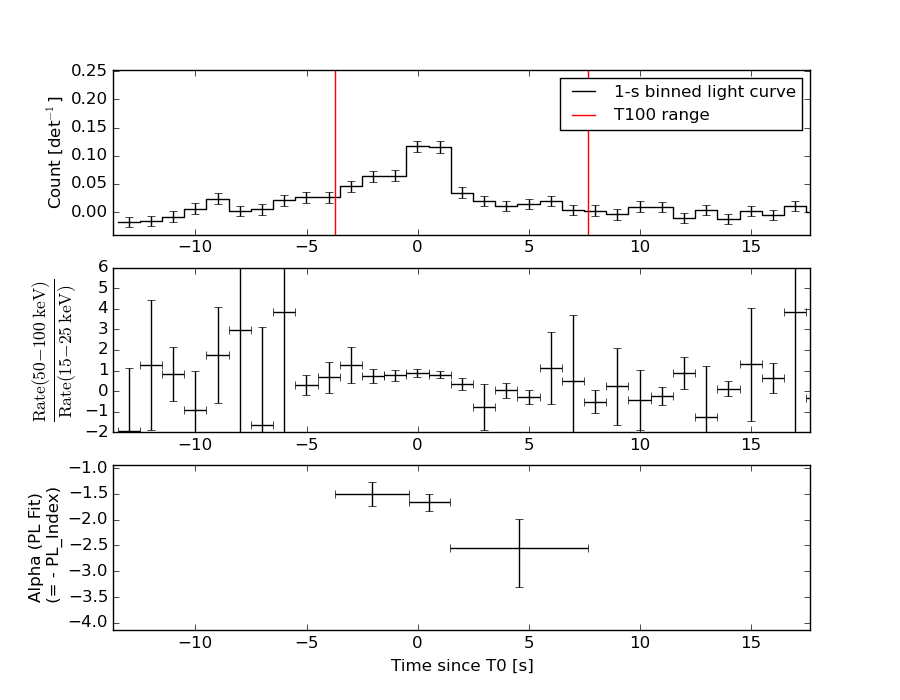
T100 11.404 -3.736 7.668
T90 8.676 -3.164 5.512
T50 2.604 -1.392 1.212
Peak 1.000 0.168 1.168
====== Spectral Analysis Summary =====================================
Model : spectral model: simple power-law (PL) and cutoff power-law (CPL)
Ph_index : photon index: E^{Ph_index}
Ph_90err : 90% error of the photon index
Epeak : Epeak in keV
Epeak_90err: 90% error of Epeak
Norm : normalization at 50 keV in both the PL model and CPL model
Nomr_90err : 90% error of the normalization
chi2 : Chi-Squared
dof : degree of freedo
=== Time-averaged spectral analysis ===
(Best model with acceptable fit: PL)
Model Ph_index Ph_90err_low Ph_90err_hi Epeak Epeak_90err_low Epeak_90err_hi Norm Nomr_90err_low Norm_90err_hi chi2 dof
PL -1.827 -0.175 0.168 - - - 2.73e-03 -3.16e-04 3.12e-04 66.250 57
CPL -0.339 -0.876 1.101 46.220 -6.874 12.820 1.97e-02 -1.97e-02 6.74e-02 56.660 56
=== 1-s peak spectral analysis ===
(Best model with acceptable fit: PL)
Model Ph_index Ph_90err_low Ph_90err_hi Epeak Epeak_90err_low Epeak_90err_hi Norm Nomr_90err_low Norm_90err_hi chi2 dof
PL -1.667 -0.207 0.202 - - - 7.66e-03 -1.09e-03 1.08e-03 51.140 57
CPL 0.225 -1.060 1.371 48.874 -7.912 14.845 9.52e-02 -9.52e-02 5.18e-01 40.210 56
=== Fluence/Peak Flux Summary ===
Model Band1 Band2 Band3 Band4 Band5 Total
15-25 25-50 50-100 100-350 15-150 15-350 keV
Fluence PL 5.42e-08 8.16e-08 9.20e-08 1.97e-07 2.87e-07 4.25e-07 erg/cm2
90%_error_low -7.38e-09 -7.88e-09 -1.42e-08 -5.44e-08 -3.32e-08 -7.09e-08 erg/cm2
90%_error_hi 7.56e-09 7.88e-09 1.44e-08 6.68e-08 3.39e-08 8.06e-08 erg/cm2
Peak flux PL 3.70e-01 3.38e-01 2.13e-01 2.05e-01 1.01e+00 1.13e+00 ph/cm2/s
90%_error_low -6.68e-02 -4.32e-02 -3.81e-02 -6.21e-02 -1.28e-01 -1.48e-01 ph/cm2/s
90%_error_hi 6.91e-02 4.32e-02 3.85e-02 7.70e-02 1.28e-01 1.49e-01 ph/cm2/s
Fluence CPL 4.75e-08 9.62e-08 8.44e-08 2.55e-08 2.48e-07 2.53e-07 erg/cm2
90%_error_low -8.56e-09 -1.14e-08 -1.96e-08 N/A -3.43e-08 -3.85e-08 erg/cm2
90%_error_hi 8.61e-09 1.19e-08 1.82e-08 N/A 3.79e-08 5.90e-08 erg/cm2
Peak flux CPL 3.12e-01 4.19e-01 2.05e-01 2.69e-02 9.60e-01 9.63e-01 ph/cm2/s
90%_error_low -7.64e-02 -6.21e-02 -5.39e-02 -2.69e-02 -1.28e-01 -1.29e-01 ph/cm2/s
90%_error_hi 7.80e-02 6.51e-02 4.97e-02 5.10e-02 1.29e-01 1.33e-01 ph/cm2/s
======================================================================
Image
Pre-slew 15.0-350.0 keV image (Event data)
#   RAcent    DECcent   POSerr    Theta     Phi              Peak Cts       SNR   Name
  170.0471   -57.5378   0.0123    14.2408  -131.4742         0.5193268     15.620 TRIG_00566561

Foreground time interval of the image:
 -3.736   7.668 (delta_t =  11.404 [sec])
Background time interval of the image:
-191.403  -3.736 (delta_t = 187.667 [sec])
Light Curves
Note: The mask-weighted lightcurves have units of either count/det or counts/sec/det, where a det is 0.4 x 0.4 = 0.16 sq cm.
Full-time range; 1 s binning
Other quick-look light curves:
- 64 ms binning (zoomed)
- 16 ms binning (zoomed)
- 8 ms binning (zoomed)
- 2 ms binning (zoomed)
- SN=5 or 10 s binning (full-time range)
- Raw light curve
Spectra
- 64 ms binning (zoomed)
- 16 ms binning (zoomed)
- 8 ms binning (zoomed)
- 2 ms binning (zoomed)
- SN=5 or 10 s binning (full-time range)
- Raw light curve
Spectra
Notes:
- 1) The fitting includes the systematic errors.
- 2) When the burst includes telescope slew time periods, the fitting uses an average response file made from multiple 5-s response files through out the slew time plus single time preiod for the non-slew times, and weighted by the total counts in the corresponding time period using addrmf. An average response file is needed becuase a spectral fit using the pre-slew DRM will introduce some errors in both a spectral shape and a normalization if the PHA file contains a lot of the slew/post-slew time interval.
- 3) For fits to more complicated models (e.g. a power-law over a cutoff power-law), the BAT team has decided to require a chi-square improvement of more than 6 for each extra dof.
Time averaged spectrum fit using the average DRM
Power-law model
Time interval is from   -3.736 sec. to    7.668 sec.

Spectral model in power-law:
------------------------------------------------------------
Parameters  : value       lower 90%   higher 90%
Photon index: -1.82701     ( -0.174613   0.167631 )
Norm@50keV  : 2.73453E-03    ( -0.00031649   0.000311746 )
------------------------------------------------------------
#Fit statistic : Chi-Squared =          66.25 using 59 PHA bins.
# Reduced chi-squared =          1.162 for     57 degrees of freedom
# Null hypothesis probability =   1.879386e-01

Photon flux (15-150 keV)    in 11.4 sec: 0.380851 ( -0.036812  0.036819 ) ph/cm2/s
Energy fluence (15-150 keV)             : 2.8681e-07 ( -3.32071e-08  3.38793e-08 ) ergs/cm2
Cutoff power-law model
Time interval is from   -3.736 sec. to    7.668 sec.
Spectral model in the cutoff power-law:
------------------------------------------------------------
Parameters  : value       lower 90%   higher 90%
Photon index: -0.339121     ( -0.876316   1.10143 )
Epeak [keV] : 46.2201      ( -6.87421 12.8199 )
Norm@50keV  : 1.96872E-02    ( -0.0196876   0.0674123 )
------------------------------------------------------------
#Fit statistic : Chi-Squared =          56.66 using 59 PHA bins.
# Reduced chi-squared =          1.012 for     56 degrees of freedom
# Null hypothesis probability =   4.501923e-01

Photon flux (15-150 keV)    in 11.4 sec: 0.360904 ( -0.037938  0.038227 ) ph/cm2/s
Energy fluence (15-150 keV)             : 2.48219e-07 ( -3.42678e-08  3.78592e-08 ) ergs/cm2
1-s peak spectrum fit
Power-law model
Time interval is from    0.168 sec. to    1.168 sec.

Spectral model in power-law:
------------------------------------------------------------
Parameters  : value       lower 90%   higher 90%
Photon index: -1.66713     ( -0.207387   0.201261 )
Norm@50keV  : 7.66239E-03    ( -0.00109494   0.00108163 )
------------------------------------------------------------
#Fit statistic : Chi-Squared =          51.14 using 59 PHA bins.
# Reduced chi-squared =         0.8972 for     57 degrees of freedom
# Null hypothesis probability =   6.934386e-01

Photon flux (15-150 keV)    in 1 sec: 1.00627 ( -0.128144  0.12817 ) ph/cm2/s
Energy fluence (15-150 keV)             : 7.11656e-08 ( -1.06385e-08  1.08639e-08 ) ergs/cm2
Cutoff power-law model
Time interval is from    0.168 sec. to    1.168 sec.
Spectral model in the cutoff power-law:
------------------------------------------------------------
Parameters  : value       lower 90%   higher 90%
Photon index: 0.22526     ( -1.06015   1.37127 )
Epeak [keV] : 48.8745      ( -7.91197 14.8456 )
Norm@50keV  : 9.52014E-02    ( -0.0952072   0.518322 )
------------------------------------------------------------
#Fit statistic : Chi-Squared =          40.21 using 59 PHA bins.
# Reduced chi-squared =         0.7181 for     56 degrees of freedom
# Null hypothesis probability =   9.447822e-01

Photon flux (15-150 keV)    in 1 sec: 0.959897 ( -0.127699  0.128653 ) ph/cm2/s
Energy fluence (15-150 keV)             : 6.00441e-08 ( -1.01212e-08  1.13644e-08 ) ergs/cm2
Time-resolved spectra
Distribution
T90 vs. Hardness ratio plot
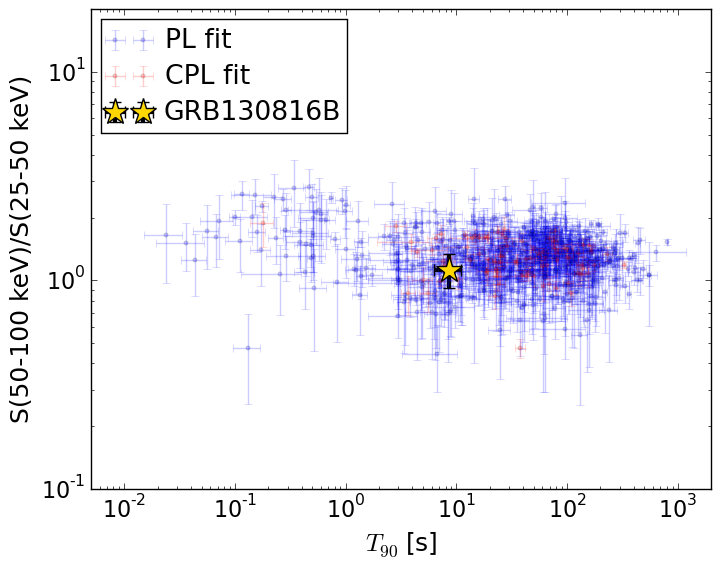
T90                                   = 8.676 sec.
Hardness ratio (energy fluence ratio) = 1.12750904788
S(15-50 keV) vs. S(50-150 keV) plot
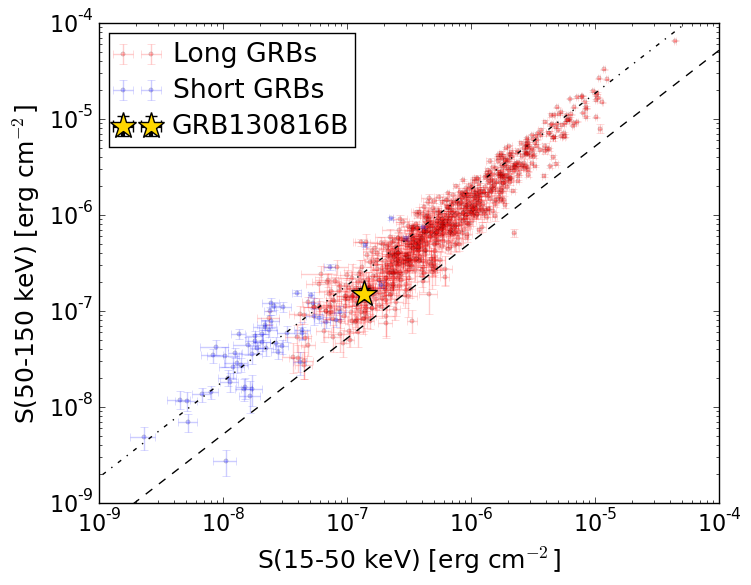
S(15-50 keV)  = 1.357166e-07
S(50-150 keV) = 1.5109841e-07
The dash-dotted line and the dashed line traces the fluences calculated from the Band function with Epeak = 15 and 150 keV, respectively. Both lines assume a canonical values of alpha = -1 and beta = -2.5.
Mask shadow pattern
IMX = -1.680850985297974E-01, IMY = 1.901583252465348E-01
Spacecraft aspect plot
Bright source in the pre-burst/pre-slew/post-slew images
Pre-burst image of 15-350 keV band
Time interval of the image:
-191.403390 -3.736000

# RAcent  DECcent POSerr Theta    Phi  PeakCts   SNR AngSep     Name
#  [deg]    [deg]    ['] [deg]  [deg]                   [']
135.5254 -40.5341    1.9  42.0 -127.6   2.2358   6.2    1.2	Vela X-1
170.2179 -60.6388    2.4  13.6 -144.1   0.7673   4.8    3.0	Cen X-3
186.5698 -62.8960    6.3   6.5 -167.5   0.3044   1.8    7.9	GX 301-2
256.1112 -37.7130    0.0  42.7   51.8   0.8673   1.3    9.8	4U 1700-377
256.6072 -36.4086   22.8  44.0   51.0   0.3597   0.5    8.3	GX 349+2
 96.0356 -43.5905    3.1  58.8 -159.2   4.2809   3.7 ------	UNKNOWN
108.9182 -45.5759    2.6  51.5 -152.0   2.0840   4.5 ------	UNKNOWN
Pre-slew background subtracted image of 15-350 keV band
Time interval of the image:
-3.736000 7.668000

# RAcent  DECcent POSerr Theta    Phi  PeakCts   SNR AngSep     Name
#  [deg]    [deg]    ['] [deg]  [deg]                   [']
135.6201 -40.5451    4.4  42.0 -127.5   0.2204   2.6    4.2	Vela X-1
170.3843 -60.4617   10.1  13.5 -143.3   0.0375   1.1    9.9	Cen X-3
186.6589 -62.9820    0.0   6.5 -168.3  -0.0300  -1.0   12.7	GX 301-2
255.7519 -37.7242    0.0  42.5   51.5  -0.2371  -1.9   13.3	4U 1700-377
256.4225 -36.4049   13.3  43.9   50.8  -0.1272  -0.9    1.3	GX 349+2
165.2777 -66.2933    2.3  16.2 -165.7   0.1750   5.0 ------	UNKNOWN
170.0471 -57.5378    0.7  14.2 -131.5   0.5191  15.6 ------	UNKNOWN
Post-slew image of 15-350 keV band
Time interval of the image:
53.996600 962.628600

# RAcent  DECcent POSerr Theta    Phi  PeakCts   SNR AngSep     Name
#  [deg]    [deg]    ['] [deg]  [deg]                   [']
135.5295 -40.5580    0.5  27.8 -132.7  14.8977  21.4    0.2	Vela X-1
170.2891 -60.6877    1.4   3.1  113.3   3.7119   7.9    4.0	Cen X-3
186.7922 -62.9132    7.4   9.8   64.7   0.7420   1.6    9.3	GX 301-2
246.8755 -43.8441    2.6  47.7   43.1   8.4492   4.5 ------	UNKNOWN
206.5598 -32.6169    3.1  35.1   -4.7   2.3620   3.8 ------	UNKNOWN
212.0151 -18.2934    3.6  49.9   -9.3   3.3059   3.2 ------	UNKNOWN
 90.9949 -32.4284    2.8  57.5 -165.7   9.4005   4.1 ------	UNKNOWN
202.5565 -15.0719    2.8  49.0  -21.9   4.3918   4.2 ------	UNKNOWN
186.3102  -8.3914    4.3  50.8  -44.4   7.1456   2.7 ------	UNKNOWN
179.1753 -11.0877    3.1  47.0  -53.0  10.4079   3.8 ------	UNKNOWN
147.4923 -19.8866    4.9  41.2  -98.6   6.9112   2.4 ------	UNKNOWN