Analysis Summary
Notes:
- 1) No attempt has been made to eliminate the non-significant decimal places.
- 2) This batgrbproduct analysis is done using the HEASARC data.
- 3) This batgrbproduct analysis is using the flight position for the mask-weighting calculation.
======================================================================
BAT GRB EVENT DATA PROCESSING REPORT
Process Script Ver: batgrbproduct v2.46
Process Start Time: Sat Jan 11 23:41:22 EST 2014
Host Name: batevent1
Current Working Dir: /local/data/batevent/batevent_reproc/trigger567163
======================================================================
Trigger: 00567163 Segment: 000
BAT Trigger Time: 398879668.212 [s; MET]
Trigger Stop: 398879668.244 [s; MET]
UTC: 2013-08-22T15:54:17.270440 [includes UTCF correction]
Where From?: (*SHORT BURST*) TDRSS scaled map message
BAT
RA: 27.9397002132013 Dec: -3.21912082484814 [deg; J2000]
Catalogged Source?: NO
Point Source?: YES
GRB Indicated?: YES [ by BAT flight software ]
Image S/N Ratio: 7.43
Image Trigger?: NO
Rate S/N Ratio: 19.6468827043885 [ if not an image trigger ]
Image S/N Ratio: 7.43
Analysis Position: [ source = BAT ]
RA: 27.9397002132013 Dec: -3.21912082484814 [deg; J2000]
Refined Position: [ source = BAT pre-slew burst ]
RA: 27.929772957175 Dec: -3.19358332719016 [deg; J2000]
{ 01h 51m 43.1s , -03d 11' 36.9" }
+/- 2.44867327978622 [arcmin] (estimated 90% radius based on SNR)
+/- 0.961374981541333 [arcmin] (formal 1-sigma fit error)
SNR: 8.46258202423166
Angular difference between the analysis and refined position is 1.643612 arcmin
Partial Coding Fraction: 0.9296875 [ including projection effects ]
Duration
T90: 0.043999969959259 +/- 0.0113137314268704
Measured from: -0.00400000810623169
to: 0.0399999618530273 [s; relative to TRIGTIME]
T50: 0.0199999213218689 +/- 0.0113137314268704
Measured from: 0.00800001621246338
to: 0.0279999375343323 [s; relative to TRIGTIME]
Fluence
Peak Flux (peak 1 second)
Measured from: -0.477999985218048
to: 0.522000014781952 [s; relative to TRIGTIME]
Total Fluence
Measured from: -0.00400000810623169
to: 0.043999969959259 [s; relative to TRIGTIME]
Band 1 Band 2 Band 3 Band 4
15-25 25-50 50-100 100-350 keV
Total 0.007412 0.007896 0.009023 -0.000204
0.001559 0.001739 0.001487 0.001054 [error]
Peak 0.013348 0.012007 0.012620 -0.001754
0.005095 0.005191 0.004671 0.003949 [error]
[ fluence units of on-axis counts / fully illuminated detector ]
======================================================================
====== Table of the duration information =============================
Value tstart tstop
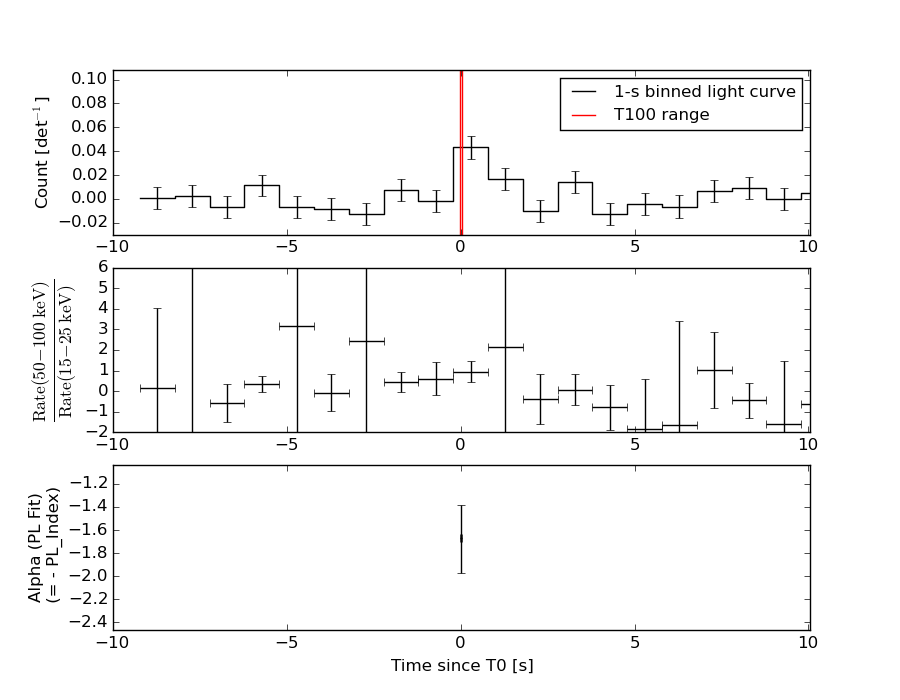
T100 0.048 -0.004 0.044
T90 0.044 -0.004 0.040
T50 0.020 0.008 0.028
Peak 1.000 -0.478 0.522
====== Spectral Analysis Summary =====================================
Model : spectral model: simple power-law (PL) and cutoff power-law (CPL)
Ph_index : photon index: E^{Ph_index}
Ph_90err : 90% error of the photon index
Epeak : Epeak in keV
Epeak_90err: 90% error of Epeak
Norm : normalization at 50 keV in both the PL model and CPL model
Nomr_90err : 90% error of the normalization
chi2 : Chi-Squared
dof : degree of freedo
=== Time-averaged spectral analysis ===
(Best model with acceptable fit: PL)
Model Ph_index Ph_90err_low Ph_90err_hi Epeak Epeak_90err_low Epeak_90err_hi Norm Nomr_90err_low Norm_90err_hi chi2 dof
PL -1.673 -0.302 0.288 - - - 2.73e-02 -5.78e-03 5.71e-03 59.580 57
CPL 0.452 -1.556 2.247 60.315 -10.926 26.247 3.08e-01 -3.08e-01 2.57e+00 53.820 56
=== 1-s peak spectral analysis ===
(Best model with acceptable fit: N/A)
Model Ph_index Ph_90err_low Ph_90err_hi Epeak Epeak_90err_low Epeak_90err_hi Norm Nomr_90err_low Norm_90err_hi chi2 dof
PL -1.866 -0.853 0.657 - - - 2.27e-03 -1.15e-03 1.05e-03 44.240 57
CPL -0.998 -1.187 4.958 53.244 N/A N/A 6.73e-03 N/A N/A 43.950 56
=== Fluence/Peak Flux Summary ===
Model Band1 Band2 Band3 Band4 Band5 Total
15-25 25-50 50-100 100-350 15-150 15-350 keV
Fluence PL 1.97e-09 3.26e-09 4.09e-09 1.02e-08 1.22e-08 1.95e-08 erg/cm2
90%_error_low -5.61e-10 -6.69e-10 -1.06e-09 -4.38e-09 -2.65e-09 -5.70e-09 erg/cm2
90%_error_hi 5.89e-10 6.66e-10 1.05e-09 5.80e-09 2.66e-09 6.66e-09 erg/cm2
Peak flux PL 1.33e-01 1.08e-01 5.93e-02 4.77e-02 3.22e-01 3.48e-01 ph/cm2/s
90%_error_low -6.55e-02 -4.06e-02 -3.60e-02 -4.77e-02 -1.20e-01 -1.33e-01 ph/cm2/s
90%_error_hi 7.21e-02 4.03e-02 3.75e-02 7.94e-02 1.20e-01 1.37e-01 ph/cm2/s
Fluence CPL 1.37e-09 4.13e-09 5.14e-09 1.90e-09 1.21e-08 1.25e-08 erg/cm2
90%_error_low -7.33e-10 -9.31e-10 -1.41e-09 -1.28e-09 -2.52e-09 -1.59e-09 erg/cm2
90%_error_hi 7.55e-10 9.69e-10 1.50e-09 3.77e-09 2.57e-09 3.77e-09 erg/cm2
Peak flux CPL 1.19e-01 1.19e-01 6.23e-02 1.93e-02 3.15e-01 3.19e-01 ph/cm2/s
90%_error_low N/A -6.55e-02 -4.01e-02 N/A -1.23e-01 -1.27e-01 ph/cm2/s
90%_error_hi N/A 5.56e-02 4.46e-02 N/A 1.22e-01 1.47e-01 ph/cm2/s
======================================================================
Image
Pre-slew 15.0-350.0 keV image (Event data)
#   RAcent    DECcent   POSerr    Theta     Phi              Peak Cts       SNR   Name
   27.9298    -3.1936   0.0228    19.2844    18.8145         0.0245257      8.463 TRIG_00567163

Foreground time interval of the image:
 -0.004   0.044 (delta_t =   0.048 [sec])
Background time interval of the image:
-185.911  -0.004 (delta_t = 185.907 [sec])
Light Curves
Note: The mask-weighted lightcurves have units of either count/det or counts/sec/det, where a det is 0.4 x 0.4 = 0.16 sq cm.
Full-time range; 1 s binning
Other quick-look light curves:
- 64 ms binning (zoomed)
- 16 ms binning (zoomed)
- 8 ms binning (zoomed)
- 2 ms binning (zoomed)
- SN=5 or 10 s binning (full-time range)
- Raw light curve
Spectra
- 64 ms binning (zoomed)
- 16 ms binning (zoomed)
- 8 ms binning (zoomed)
- 2 ms binning (zoomed)
- SN=5 or 10 s binning (full-time range)
- Raw light curve
Spectra
Notes:
- 1) The fitting includes the systematic errors.
- 2) When the burst includes telescope slew time periods, the fitting uses an average response file made from multiple 5-s response files through out the slew time plus single time preiod for the non-slew times, and weighted by the total counts in the corresponding time period using addrmf. An average response file is needed becuase a spectral fit using the pre-slew DRM will introduce some errors in both a spectral shape and a normalization if the PHA file contains a lot of the slew/post-slew time interval.
- 3) For fits to more complicated models (e.g. a power-law over a cutoff power-law), the BAT team has decided to require a chi-square improvement of more than 6 for each extra dof.
Time averaged spectrum fit using the average DRM
Power-law model
Time interval is from   -0.004 sec. to    0.044 sec.

Spectral model in power-law:
------------------------------------------------------------
Parameters  : value       lower 90%   higher 90%
Photon index: -1.67252     ( -0.301636   0.288156 )
Norm@50keV  : 2.73438E-02    ( -0.00577729   0.00570914 )
------------------------------------------------------------
#Fit statistic : Chi-Squared =          59.58 using 59 PHA bins.
# Reduced chi-squared =          1.045 for     57 degrees of freedom
# Null hypothesis probability =   3.819274e-01

Photon flux (15-150 keV)    in 0.048 sec: 3.59751 ( -0.73687  0.73775 ) ph/cm2/s
Energy fluence (15-150 keV)             : 1.21826e-08 ( -2.65092e-09  2.66445e-09 ) ergs/cm2
Cutoff power-law model
Time interval is from   -0.004 sec. to    0.044 sec.
Spectral model in the cutoff power-law:
------------------------------------------------------------
Parameters  : value       lower 90%   higher 90%
Photon index: 0.451928     ( -1.56003   2.24349 )
Epeak [keV] : 60.3147      ( -10.915 26.258 )
Norm@50keV  : 0.308028    ( -0.309497   2.56839 )
------------------------------------------------------------
#Fit statistic : Chi-Squared =          53.82 using 59 PHA bins.
# Reduced chi-squared =         0.9611 for     56 degrees of freedom
# Null hypothesis probability =   5.576789e-01

Photon flux (15-150 keV)    in 0.048 sec: 3.53513 ( -0.76916  0.75874 ) ph/cm2/s
Energy fluence (15-150 keV)             : 1.21451e-08 ( -2.52076e-09  2.57061e-09 ) ergs/cm2
1-s peak spectrum fit
Power-law model
Time interval is from   -0.478 sec. to    0.522 sec.

Spectral model in power-law:
------------------------------------------------------------
Parameters  : value       lower 90%   higher 90%
Photon index: -1.86624     ( -0.852833   0.657105 )
Norm@50keV  : 2.27462E-03    ( -0.00115102   0.0010457 )
------------------------------------------------------------
#Fit statistic : Chi-Squared =          44.24 using 59 PHA bins.
# Reduced chi-squared =         0.7761 for     57 degrees of freedom
# Null hypothesis probability =   8.914561e-01

Photon flux (15-150 keV)    in 1 sec: 0.321872 ( -0.11983  0.119849 ) ph/cm2/s
Energy fluence (15-150 keV)             : 2.09146e-08 ( -9.53649e-09  1.03217e-08 ) ergs/cm2
Cutoff power-law model
Time interval is from   -0.478 sec. to    0.522 sec.
Spectral model in the cutoff power-law:
------------------------------------------------------------
Parameters  : value       lower 90%   higher 90%
Photon index: -0.998189     ( -1.18945   4.95566 )
Epeak [keV] : 53.2438      (   )
Norm@50keV  : 6.73344E-03    (     )
------------------------------------------------------------
#Fit statistic : Chi-Squared =          43.95 using 59 PHA bins.
# Reduced chi-squared =         0.7848 for     56 degrees of freedom
# Null hypothesis probability =   8.786565e-01

Photon flux (15-150 keV)    in 1 sec: 0.314629 ( -0.123333  0.121804 ) ph/cm2/s
Energy fluence (15-150 keV)             : 1.99205e-08 ( 0  0 ) ergs/cm2
Time-resolved spectra
Distribution
T90 vs. Hardness ratio plot
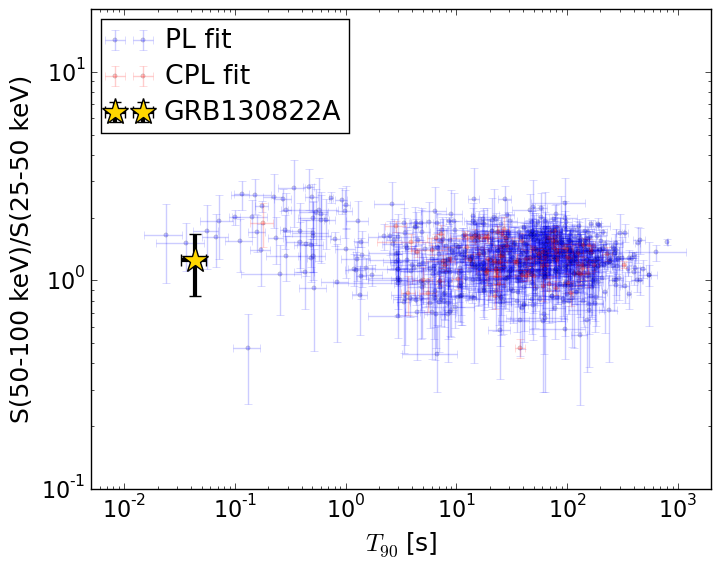
T90                                   = 0.04399997 sec.
Hardness ratio (energy fluence ratio) = 1.25493124599
S(15-50 keV) vs. S(50-150 keV) plot
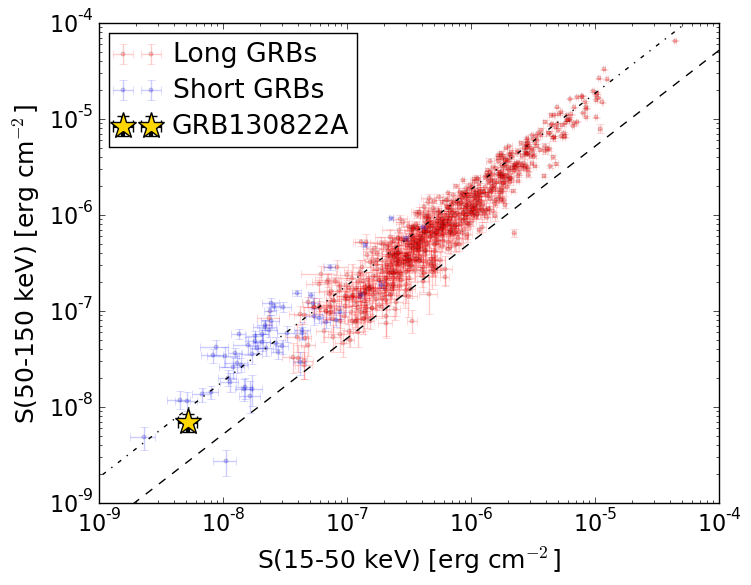
S(15-50 keV)  = 5.230822e-09
S(50-150 keV) = 6.951935e-09
The dash-dotted line and the dashed line traces the fluences calculated from the Band function with Epeak = 15 and 150 keV, respectively. Both lines assume a canonical values of alpha = -1 and beta = -2.5.
Mask shadow pattern
IMX = 3.311932371978128E-01, IMY = -1.128406262777303E-01
Spacecraft aspect plot
Bright source in the pre-burst/pre-slew/post-slew images
Pre-burst image of 15-350 keV band
Time interval of the image:
-185.911420 -0.004000

# RAcent  DECcent POSerr Theta    Phi  PeakCts   SNR AngSep     Name
#  [deg]    [deg]    ['] [deg]  [deg]                   [']
353.7746  -9.5915    2.7  39.4   82.0   2.7143   4.3 ------	UNKNOWN
356.4952 -12.4155    3.8  39.3   75.9   1.7679   3.1 ------	UNKNOWN
 13.5692 -12.9624    2.6  30.6   50.8   0.9600   4.4 ------	UNKNOWN
337.0685  35.1031    2.6  46.3  153.9   1.8815   4.4 ------	UNKNOWN
 72.4493  -1.6551    2.6  50.7  -44.3   3.4524   4.4 ------	UNKNOWN
Pre-slew background subtracted image of 15-350 keV band
Time interval of the image:
-0.004000 0.044000

# RAcent  DECcent POSerr Theta    Phi  PeakCts   SNR AngSep     Name
#  [deg]    [deg]    ['] [deg]  [deg]                   [']
 27.9298  -3.1936    1.4  19.3   18.8   0.0245   8.5 ------	UNKNOWN
 14.9506  57.3254    2.5  42.2 -157.4   0.0211   4.7 ------	UNKNOWN
 66.2100 -11.0324    2.1  49.4  -29.7   0.0416   5.6 ------	UNKNOWN
 38.3748  61.6090    2.3  47.0 -140.8   0.0328   5.0 ------	UNKNOWN
Post-slew image of 15-350 keV band
Time interval of the image:
57.088600 962.818600

# RAcent  DECcent POSerr Theta    Phi  PeakCts   SNR AngSep     Name
#  [deg]    [deg]    ['] [deg]  [deg]                   [']
352.7849  10.5965    2.5  37.6  124.0   5.2316   4.6 ------	UNKNOWN
  3.2628  46.4721    2.8  54.3  171.2   8.3658   4.1 ------	UNKNOWN
 28.2558 -25.8586    3.3  22.6   11.2   1.4864   3.5 ------	UNKNOWN
 19.1858  20.4165    2.9  25.2  172.4   1.9481   4.0 ------	UNKNOWN
 39.8513 -36.6085    3.4  35.1   -4.8   1.9968   3.4 ------	UNKNOWN