Analysis Summary
Notes:
- 1) No attempt has been made to eliminate the non-significant decimal places.
- 2) This batgrbproduct analysis is done using the HEASARC data.
- 3) This batgrbproduct analysis is using the flight position for the mask-weighting calculation.
======================================================================
                  BAT GRB EVENT DATA PROCESSING REPORT
    Process Script Ver: batgrbproduct v2.46
    Process Start Time: Sat Jan 11 23:37:14 EST 2014
             Host Name: batevent1
   Current Working Dir: /local/data/batevent/batevent_reproc/trigger568417
======================================================================

  Trigger: 00568417      Segment: 000

  BAT Trigger Time: 399447824   [s; MET]
      Trigger Stop: 399447888   [s; MET]
               UTC: 2013-08-29T05:43:33.032660    [includes UTCF correction]
       Where From?: TDRSS position message

  BAT
    RA: 182.436503188924   Dec: 46.5315062760872  [deg; J2000]

     Catalogged Source?: YES
     Point Source?:      YES
     GRB Indicated?:     NO    [ by BAT flight software ]
     Image S/N Ratio:    13.79
     Image Trigger?:     YES
     Rate S/N Ratio:     0  [ if not an image trigger ]
     Image S/N Ratio:    13.79

  Analysis Position:   [ source = BAT ]
    RA: 182.436503188924   Dec: 46.5315062760872  [deg; J2000]

  Refined Position:   [ source = BAT pre-slew burst ]
    RA: 182.426038394831   Dec: 46.5218315481025  [deg; J2000]
        { 12h 09m 42.2s , +46d 31' 18.6" }
         +/- 1.27063217388016 [arcmin] (estimated 90% radius based on SNR)
         +/- 0.529132689092728 [arcmin] (formal 1-sigma fit error)
    SNR: 21.6032254114142

  Angular difference between the analysis and refined position is 0.723590 arcmin

  Partial Coding Fraction: 0.84375    [ including projection effects ]

  Duration
     T90: 51.8839999437332 +/- 8.18044987657075
        Measured from: 32.8999999761581
                   to: 84.7839999198914     [s; relative to TRIGTIME]
     T50: 20.8279999494553 +/- 5.36724434042409
        Measured from: 44.7120000123978
                   to: 65.539999961853     [s; relative to TRIGTIME]


  Fluence
     Peak Flux  (peak 1 second)
        Measured from: 50.9039999842644
                   to: 51.9039999842644     [s; relative to TRIGTIME]
     Total Fluence
        Measured from: 28.0960000157356
                   to: 92.1320000290871     [s; relative to TRIGTIME]

             Band 1     Band 2     Band 3     Band 4
              15-25      25-50     50-100    100-350     keV
 Total     0.449003   0.718860   0.588641   0.116893
           0.040678   0.042749   0.039071   0.036808 [error]
 Peak      0.023893   0.027853   0.022011   0.004943
           0.005148   0.005498   0.005002   0.004639 [error]

     [ fluence units of on-axis counts / fully illuminated detector ]

======================================================================


====== Table of the duration information =============================

        Value   tstart    tstop
T100   64.036   28.096   92.132
T90    51.884   32.900   84.784
T50    20.828   44.712   65.540
Peak    1.000   50.904   51.904


====== Spectral Analysis Summary =====================================

Model      : spectral model: simple power-law (PL) and cutoff power-law (CPL)
Ph_index   : photon index: E^{Ph_index}
Ph_90err   : 90% error of the photon index
Epeak      : Epeak in keV
Epeak_90err: 90% error of Epeak
Norm       : normalization at 50 keV in both the PL model and CPL model
Nomr_90err : 90% error of the normalization
chi2       : Chi-Squared
dof        : degree of freedo

=== Time-averaged spectral analysis ===
(Best model with acceptable fit: PL)

Model Ph_index Ph_90err_low Ph_90err_hi  Epeak  Epeak_90err_low  Epeak_90err_hi  Norm       Nomr_90err_low    Norm_90err_hi    chi2    dof
PL      -1.343    -0.120      0.121       -           -               -         2.02e-03     -1.36e-04          1.36e-04      59.530   57
CPL     -1.071    -0.330      0.507      175.945     -83.306      -175.945      2.75e-03     -8.27e-04          2.05e-03      58.520   56


=== 1-s peak spectral analysis ===
(Best model with acceptable fit: PL)

Model Ph_index Ph_90err_low Ph_90err_hi  Epeak  Epeak_90err_low  Epeak_90err_hi  Norm       Nomr_90err_low    Norm_90err_hi    chi2    dof
PL      -1.500     -0.367     0.361       -           -               -         5.02e-03     -1.11e-03          1.09e-03      51.400   57
CPL     -1.251     -0.607     1.817      133.497    -133.497      -133.497      6.92e-03     -2.99e-03          7.06e-02      51.320   56


=== Fluence/Peak Flux Summary ===

              Model    Band1     Band2     Band3     Band4     Band5     Total
                       15-25     25-50    50-100    100-350    15-150    15-350    keV
Fluence         PL   1.43e-07  2.89e-07  4.56e-07  1.59e-06  1.27e-06  2.48e-06   erg/cm2
      90%_error_low -1.73e-08 -2.11e-08 -3.89e-08 -2.82e-07 -9.53e-08 -3.11e-07   erg/cm2
      90%_error_hi   1.79e-08  2.10e-08  3.87e-08  3.23e-07  9.61e-08  3.46e-07   erg/cm2
Peak flux       PL   2.07e-01  2.08e-01  1.47e-01  1.65e-01  6.27e-01  7.27e-01   ph/cm2/s
      90%_error_low -6.67e-02 -4.45e-02 -4.13e-02 -7.71e-02 -1.29e-01 -1.55e-01   ph/cm2/s
      90%_error_hi   7.13e-02  4.40e-02  4.12e-02  1.12e-01  1.29e-01  1.59e-01   ph/cm2/s

Fluence        CPL   1.36e-07  2.96e-07  4.64e-07  1.05e-06  1.24e-06  1.95e-06   erg/cm2
      90%_error_low -2.09e-08 -2.44e-08 -4.17e-08 -5.02e-07 -1.08e-07 -5.10e-07   erg/cm2
      90%_error_hi   2.13e-08  2.50e-08  4.25e-08  5.31e-07  1.07e-07  6.48e-07   erg/cm2
Peak flux      CPL   2.01e-01  2.15e-01  1.48e-01  1.15e-01  6.21e-01  6.79e-01   ph/cm2/s
      90%_error_low -7.41e-02 -5.02e-02 -4.94e-02 -1.15e-01 -1.34e-01 -1.82e-01   ph/cm2/s
      90%_error_hi   7.42e-02  6.14e-02  4.40e-02  7.20e-02  1.32e-01  2.02e-01   ph/cm2/s

======================================================================
Image
Pre-slew 15.0-350.0 keV image (Event data)
#   RAcent    DECcent   POSerr    Theta     Phi              Peak Cts       SNR   Name
  182.4260    46.5218   0.0089    25.5767   -32.5793         2.0360174     21.603 TRIG_00568417

Foreground time interval of the image:
 28.096  92.132 (delta_t =  64.036 [sec])
Background time interval of the image:
-239.000  28.096 (delta_t = 267.096 [sec])
Light Curves
Note: The mask-weighted lightcurves have units of either count/det or counts/sec/det, where a det is 0.4 x 0.4 = 0.16 sq cm.
Full-time range; 1 s binning
Other quick-look light curves:
- 64 ms binning (zoomed)
- 16 ms binning (zoomed)
- 8 ms binning (zoomed)
- 2 ms binning (zoomed)
- SN=5 or 10 s binning (full-time range)
- Raw light curve
Spectra
- 64 ms binning (zoomed)
- 16 ms binning (zoomed)
- 8 ms binning (zoomed)
- 2 ms binning (zoomed)
- SN=5 or 10 s binning (full-time range)
- Raw light curve
Spectra
Notes:
- 1) The fitting includes the systematic errors.
- 2) When the burst includes telescope slew time periods, the fitting uses an average response file made from multiple 5-s response files through out the slew time plus single time preiod for the non-slew times, and weighted by the total counts in the corresponding time period using addrmf. An average response file is needed becuase a spectral fit using the pre-slew DRM will introduce some errors in both a spectral shape and a normalization if the PHA file contains a lot of the slew/post-slew time interval.
- 3) For fits to more complicated models (e.g. a power-law over a cutoff power-law), the BAT team has decided to require a chi-square improvement of more than 6 for each extra dof.
Time averaged spectrum fit using the average DRM
Power-law model
Time interval is from   28.096 sec. to   92.132 sec.

Spectral model in power-law:
------------------------------------------------------------
Parameters  : value       lower 90%   higher 90%
Photon index: -1.34285     ( -0.120349   0.120597 )
Norm@50keV  : 2.02447E-03    ( -0.00013586   0.000135594 )
------------------------------------------------------------
#Fit statistic : Chi-Squared =          59.53 using 59 PHA bins.
# Reduced chi-squared =          1.044 for     57 degrees of freedom
# Null hypothesis probability =   3.836356e-01

Photon flux (15-150 keV)    in 64.04 sec: 0.243538 ( -0.016627  0.016651 ) ph/cm2/s
Energy fluence (15-150 keV)             : 1.26845e-06 ( -9.53299e-08  9.60779e-08 ) ergs/cm2
Cutoff power-law model
Time interval is from   28.096 sec. to   92.132 sec.
Spectral model in the cutoff power-law:
------------------------------------------------------------
Parameters  : value       lower 90%   higher 90%
Photon index: -1.07066     ( -0.330301   0.506643 )
Epeak [keV] : 175.945      ( -83.3075 -175.946 )
Norm@50keV  : 2.75379E-03    ( -0.000827282   0.00205157 )
------------------------------------------------------------
#Fit statistic : Chi-Squared =          58.52 using 59 PHA bins.
# Reduced chi-squared =          1.045 for     56 degrees of freedom
# Null hypothesis probability =   3.831666e-01

Photon flux (15-150 keV)    in 64.04 sec: 0.240082 ( -0.017629  0.017602 ) ph/cm2/s
Energy fluence (15-150 keV)             : 1.24008e-06 ( -1.07549e-07  1.06959e-07 ) ergs/cm2
1-s peak spectrum fit
Power-law model
Time interval is from   50.904 sec. to   51.904 sec.

Spectral model in power-law:
------------------------------------------------------------
Parameters  : value       lower 90%   higher 90%
Photon index: -1.49965     ( -0.366539   0.360914 )
Norm@50keV  : 5.02401E-03    ( -0.00111311   0.0010898 )
------------------------------------------------------------
#Fit statistic : Chi-Squared =          51.40 using 59 PHA bins.
# Reduced chi-squared =         0.9018 for     57 degrees of freedom
# Null hypothesis probability =   6.841590e-01

Photon flux (15-150 keV)    in 1 sec: 0.627150 ( -0.12918  0.129251 ) ph/cm2/s
Energy fluence (15-150 keV)             : 4.76694e-08 ( -1.14618e-08  1.18324e-08 ) ergs/cm2
Cutoff power-law model
Time interval is from   50.904 sec. to   51.904 sec.
Spectral model in the cutoff power-law:
------------------------------------------------------------
Parameters  : value       lower 90%   higher 90%
Photon index: -1.25099     ( -0.602561   1.82159 )
Epeak [keV] : 133.497      ( -136.628 -136.628 )
Norm@50keV  : 6.92375E-03    ( -0.0029225   0.0706592 )
------------------------------------------------------------
#Fit statistic : Chi-Squared =          51.32 using 59 PHA bins.
# Reduced chi-squared =         0.9164 for     56 degrees of freedom
# Null hypothesis probability =   6.525036e-01

Photon flux (15-150 keV)    in 1 sec: 0.621218 ( -0.134222  0.132385 ) ph/cm2/s
Energy fluence (15-150 keV)             : 4.62488e-08 ( -1.41092e-08  1.29905e-08 ) ergs/cm2
Time-resolved spectra
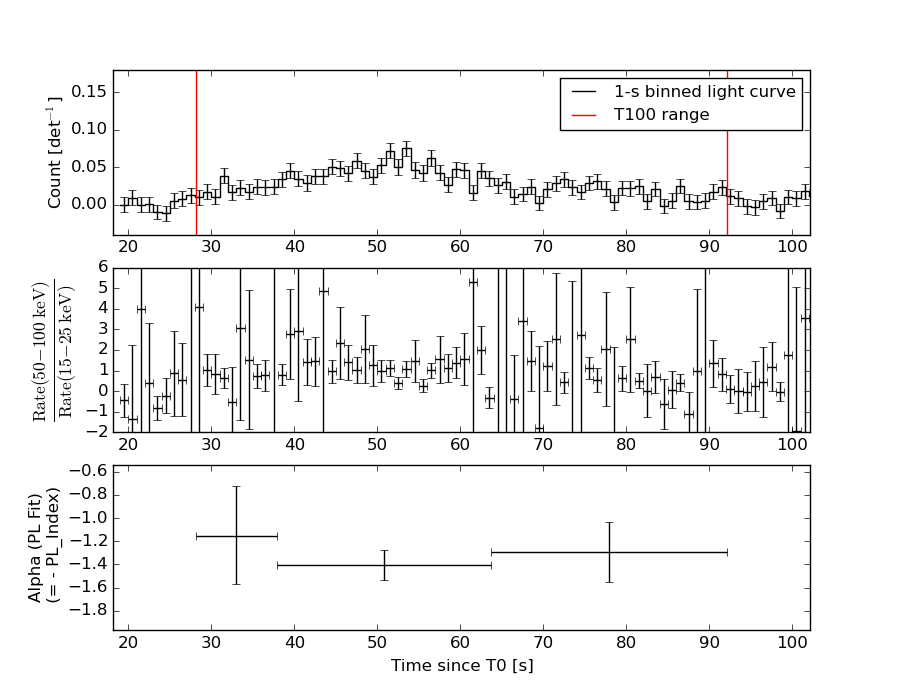
Distribution
T90 vs. Hardness ratio plot
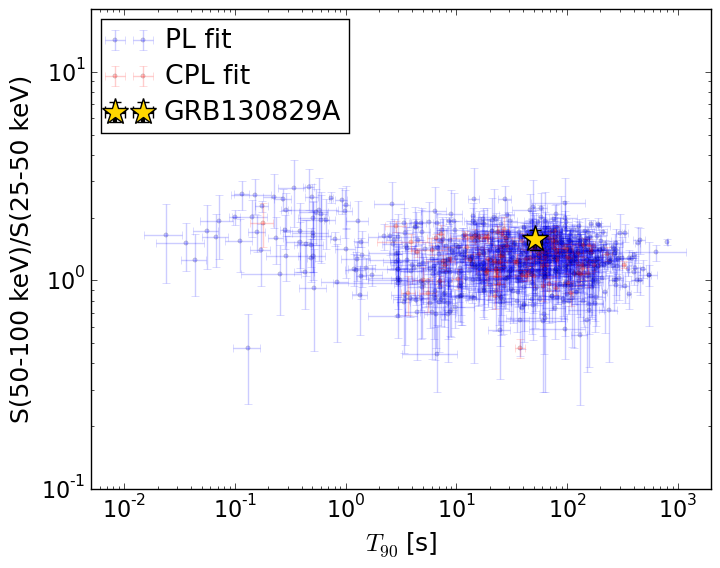
T90                                   = 51.884 sec.
Hardness ratio (energy fluence ratio) = 1.57702994132
S(15-50 keV) vs. S(50-150 keV) plot
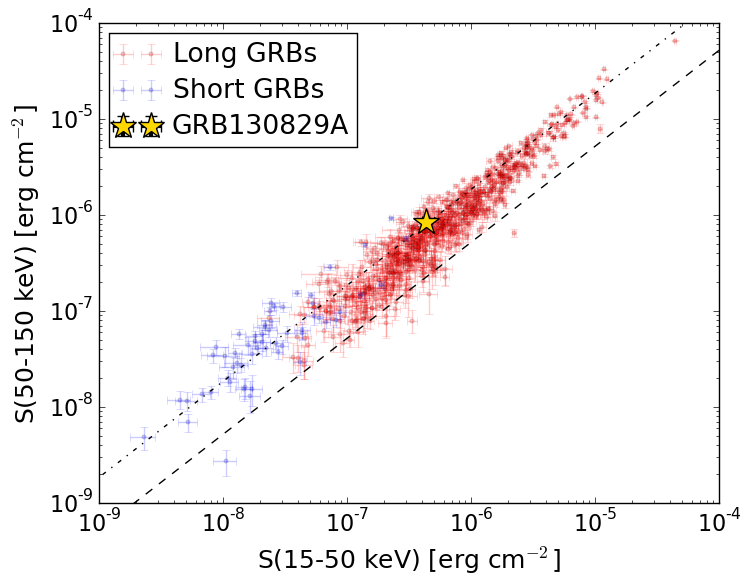
S(15-50 keV)  = 4.320152e-07
S(50-150 keV) = 8.364234e-07
The dash-dotted line and the dashed line traces the fluences calculated from the Band function with Epeak = 15 and 150 keV, respectively. Both lines assume a canonical values of alpha = -1 and beta = -2.5.
Mask shadow pattern
IMX = 4.033076120475479E-01, IMY = 2.577204965095330E-01
Spacecraft aspect plot
Bright source in the pre-burst/pre-slew/post-slew images
Pre-burst image of 15-350 keV band
Time interval of the image:
-239.000000 28.096000

# RAcent  DECcent POSerr Theta    Phi  PeakCts   SNR AngSep     Name
#  [deg]    [deg]    ['] [deg]  [deg]                   [']
256.6639  49.2920    2.4  43.8   53.3   3.6865   4.8 ------	UNKNOWN
218.2114  57.0886    1.9  30.0   20.0   1.2103   6.0 ------	UNKNOWN
197.1459  83.6761    2.1  55.3    5.1   4.3652   5.6 ------	UNKNOWN
214.4221  -2.5584    3.4  32.2  169.4   0.7773   3.4 ------	UNKNOWN
192.2297  62.4169    2.4  35.1   -4.5   1.0375   4.7 ------	UNKNOWN
195.0825   5.5097    3.1  25.0 -148.4   0.7233   3.8 ------	UNKNOWN
Pre-slew background subtracted image of 15-350 keV band
Time interval of the image:
28.096000 92.132000

# RAcent  DECcent POSerr Theta    Phi  PeakCts   SNR AngSep     Name
#  [deg]    [deg]    ['] [deg]  [deg]                   [']
216.3928  72.1132    2.5  44.1   11.0   0.7029   4.7 ------	UNKNOWN
213.5413  15.4070    2.3  15.0  155.0   0.4389   5.0 ------	UNKNOWN
182.4260  46.5218    0.5  25.6  -32.6   2.0360  21.6 ------	UNKNOWN
184.0000  31.2816    2.0  18.9  -69.9   0.4965   5.6 ------	UNKNOWN
Post-slew image of 15-350 keV band
Time interval of the image:
539.400590 900.788400
901.000000 963.051400

# RAcent  DECcent POSerr Theta    Phi  PeakCts   SNR AngSep     Name
#  [deg]    [deg]    ['] [deg]  [deg]                   [']
244.9871 -15.6459    0.5  41.7  126.5  22.5858  22.9    0.6	Sco X-1
254.4746  35.3386   26.0  38.5   41.2  -0.2416  -0.4    0.9	Her X-1
231.6309  63.5067    3.0  48.8   -2.7   2.0325   3.8 ------	UNKNOWN
195.7881 -30.3958    2.8  50.6 -167.0   2.8827   4.1 ------	UNKNOWN