Analysis Summary
Notes:
- 1) No attempt has been made to eliminate the non-significant decimal places.
- 2) This batgrbproduct analysis is done using the HEASARC data.
- 3) This batgrbproduct analysis is using the flight position for the mask-weighting calculation.
======================================================================
                  BAT GRB EVENT DATA PROCESSING REPORT
    Process Script Ver: batgrbproduct v2.46
    Process Start Time: Sat Jan 11 23:20:55 EST 2014
             Host Name: batevent1
   Current Working Dir: /local/data/batevent/batevent_reproc/trigger569992
======================================================================

  Trigger: 00569992      Segment: 000

  BAT Trigger Time: 400282884.092   [s; MET]
      Trigger Stop: 400282884.156   [s; MET]
               UTC: 2013-09-07T21:41:13.086760    [includes UTCF correction]
       Where From?: (*SHORT BURST*) TDRSS scaled map message

  BAT
    RA: 215.877573298739   Dec: 45.6161784400488  [deg; J2000]

     Catalogged Source?: NO
     Point Source?:      YES
     GRB Indicated?:     YES    [ by BAT flight software ]
     Image S/N Ratio:    9.91
     Image Trigger?:     NO
     Rate S/N Ratio:     18.8414436814168  [ if not an image trigger ]
     Image S/N Ratio:    9.91

  Analysis Position:   [ source = BAT ]
    RA: 215.877573298739   Dec: 45.6161784400488  [deg; J2000]

  Refined Position:   [ source = BAT pre-slew burst ]
    RA: 215.898089106571   Dec: 45.6035657982802  [deg; J2000]
        { 14h 23m 35.5s , +45d 36' 12.8" }
         +/- 0.355981997990349 [arcmin] (estimated 90% radius based on SNR)
         +/- 0.0802970063433051 [arcmin] (formal 1-sigma fit error)
    SNR: 133.025674922245

  Angular difference between the analysis and refined position is 1.146374 arcmin

  Partial Coding Fraction: 1.03125    [ including projection effects ]

  Duration
     T90: 364.367999970913 +/- 5.44720111538182
        Measured from: -40.244000017643
                   to: 324.12399995327     [s; relative to TRIGTIME]
     T50: 59.6919999718666 +/- 0.323827104313879
        Measured from: 2.90799999237061
                   to: 62.5999999642372     [s; relative to TRIGTIME]


  Fluence
     Peak Flux  (peak 1 second)
        Measured from: 57.6639999747276
                   to: 58.6639999747276     [s; relative to TRIGTIME]
     Total Fluence
        Measured from: -73.7360000014305
                   to: 767.287999987602     [s; relative to TRIGTIME]

             Band 1     Band 2     Band 3     Band 4
              15-25      25-50     50-100    100-350     keV
 Total    46.656306  70.537964  66.275492  20.894706
           0.165908   0.182017   0.172970   0.145309 [error]
 Peak      0.637179   1.124316   1.256130   0.410995
           0.011282   0.014786   0.016303   0.012533 [error]

     [ fluence units of on-axis counts / fully illuminated detector ]

======================================================================


====== Table of the duration information =============================

        Value   tstart    tstop
T100  841.024  -73.736  767.288
T90   364.368  -40.244  324.124
T50    59.692    2.908   62.600
Peak    1.000   57.664   58.664


====== Spectral Analysis Summary =====================================

Model      : spectral model: simple power-law (PL) and cutoff power-law (CPL)
Ph_index   : photon index: E^{Ph_index}
Ph_90err   : 90% error of the photon index
Epeak      : Epeak in keV
Epeak_90err: 90% error of Epeak
Norm       : normalization at 50 keV in both the PL model and CPL model
Nomr_90err : 90% error of the normalization
chi2       : Chi-Squared
dof        : degree of freedo

=== Time-averaged spectral analysis ===
(Best model with acceptable fit: PL)

Model Ph_index Ph_90err_low Ph_90err_hi  Epeak  Epeak_90err_low  Epeak_90err_hi  Norm       Nomr_90err_low    Norm_90err_hi    chi2    dof
PL      -1.190    -0.019      0.019       -           -               -         1.59e-02     -1.95e-04          1.94e-04      15.880   57
CPL     -1.127    -0.075     -0.037      999.537    -999.537      -999.537      1.67e-02     -9.22e-04          -4.26e-04      17.910   56


=== 1-s peak spectral analysis ===
(Best model with acceptable fit: N/A)

Model Ph_index Ph_90err_low Ph_90err_hi  Epeak  Epeak_90err_low  Epeak_90err_hi  Norm       Nomr_90err_low    Norm_90err_hi    chi2    dof
PL      -0.991     -0.033     0.034       -           -               -         2.25e-01     -4.10e-03          4.09e-03      59.550   57
CPL     -0.924     -0.078     0.116      992.593    -992.593      -992.593      2.39e-01     -4.33e-03          2.66e-02      59.220   56


=== Fluence/Peak Flux Summary ===

              Model    Band1     Band2     Band3     Band4     Band5     Total
                       15-25     25-50    50-100    100-350    15-150    15-350    keV
Fluence         PL   1.28e-05  2.84e-05  4.98e-05  2.04e-04  1.36e-04  2.95e-04   erg/cm2
      90%_error_low -3.39e-07 -4.66e-07 -4.89e-07 -4.45e-06 -1.36e-06 -4.38e-06   erg/cm2
      90%_error_hi   3.43e-07  4.66e-07  4.89e-07  4.52e-06  1.36e-06  4.43e-06   erg/cm2
Peak flux       PL   2.19e-03  3.38e-02  2.86e-01  3.32e+01  1.27e+00  3.24e+01   ph/cm2/s
      90%_error_low     N/A       N/A       N/A       N/A       N/A       N/A     ph/cm2/s
      90%_error_hi      N/A       N/A       N/A       N/A       N/A       N/A     ph/cm2/s

Fluence        CPL   1.27e-05  2.84e-05  4.97e-05  2.04e-04  1.36e-04  2.95e-04   erg/cm2
      90%_error_low    N/A    -5.91e-07 -4.69e-07 -8.38e-06 -1.55e-06 -8.06e-06   erg/cm2
      90%_error_hi     N/A     5.93e-07  5.96e-07  1.54e-06  1.52e-06  3.65e-06   erg/cm2
Peak flux      CPL   5.61e+00  7.82e+00  7.85e+00  1.43e+01  2.58e+01  3.47e+01   ph/cm2/s
      90%_error_low -3.32e-01 -2.52e-01 -1.76e-01 -2.36e+00 -4.89e-01 -1.69e+00   ph/cm2/s
      90%_error_hi   2.60e-01  1.36e-01  2.19e-01  3.23e-01  4.97e-01  1.09e+00   ph/cm2/s

======================================================================
Image
Pre-slew 15.0-350.0 keV image (Event data)
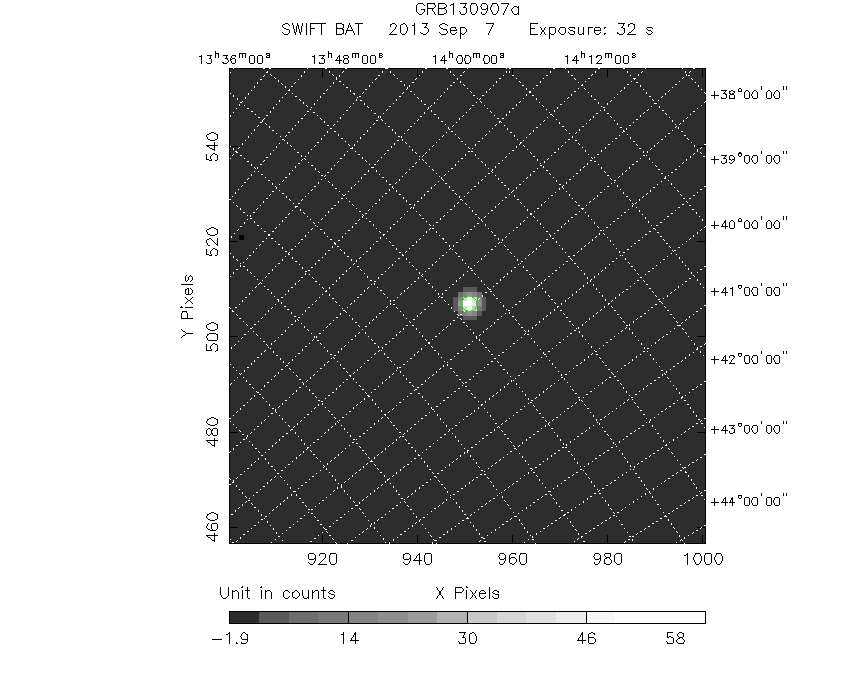
#   RAcent    DECcent   POSerr    Theta     Phi              Peak Cts       SNR   Name
  215.8981    45.6036   0.0014     9.2394  -156.9254        63.3250911    133.026 TRIG_00569992

Foreground time interval of the image:
-14.391  18.009 (delta_t =  32.400 [sec])
Background time interval of the image:
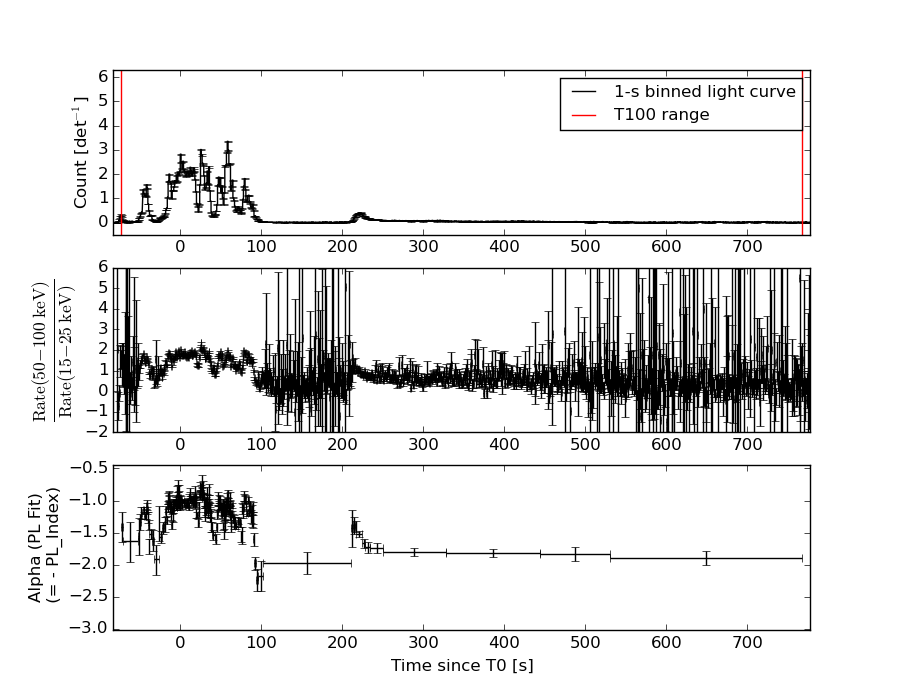
Light Curves
Note: The mask-weighted lightcurves have units of either count/det or counts/sec/det, where a det is 0.4 x 0.4 = 0.16 sq cm.
Full-time range; 1 s binning
Other quick-look light curves:
- 64 ms binning (zoomed)
- 16 ms binning (zoomed)
- 8 ms binning (zoomed)
- 2 ms binning (zoomed)
- SN=5 or 10 s binning (full-time range)
- Raw light curve
Spectra
- 64 ms binning (zoomed)
- 16 ms binning (zoomed)
- 8 ms binning (zoomed)
- 2 ms binning (zoomed)
- SN=5 or 10 s binning (full-time range)
- Raw light curve
Spectra
Notes:
- 1) The fitting includes the systematic errors.
- 2) When the burst includes telescope slew time periods, the fitting uses an average response file made from multiple 5-s response files through out the slew time plus single time preiod for the non-slew times, and weighted by the total counts in the corresponding time period using addrmf. An average response file is needed becuase a spectral fit using the pre-slew DRM will introduce some errors in both a spectral shape and a normalization if the PHA file contains a lot of the slew/post-slew time interval.
- 3) For fits to more complicated models (e.g. a power-law over a cutoff power-law), the BAT team has decided to require a chi-square improvement of more than 6 for each extra dof.
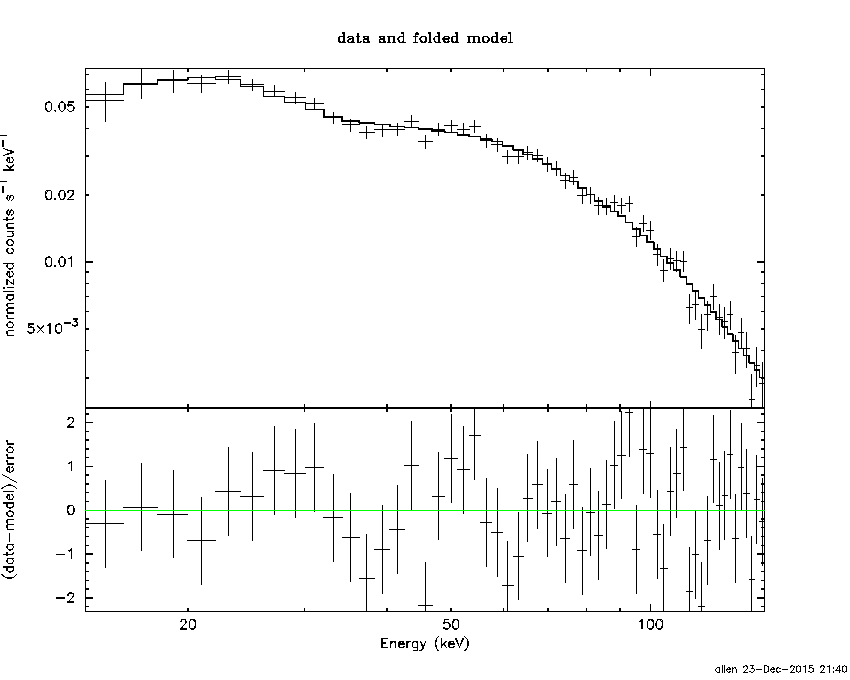
Time averaged spectrum fit using the average DRM
Power-law model
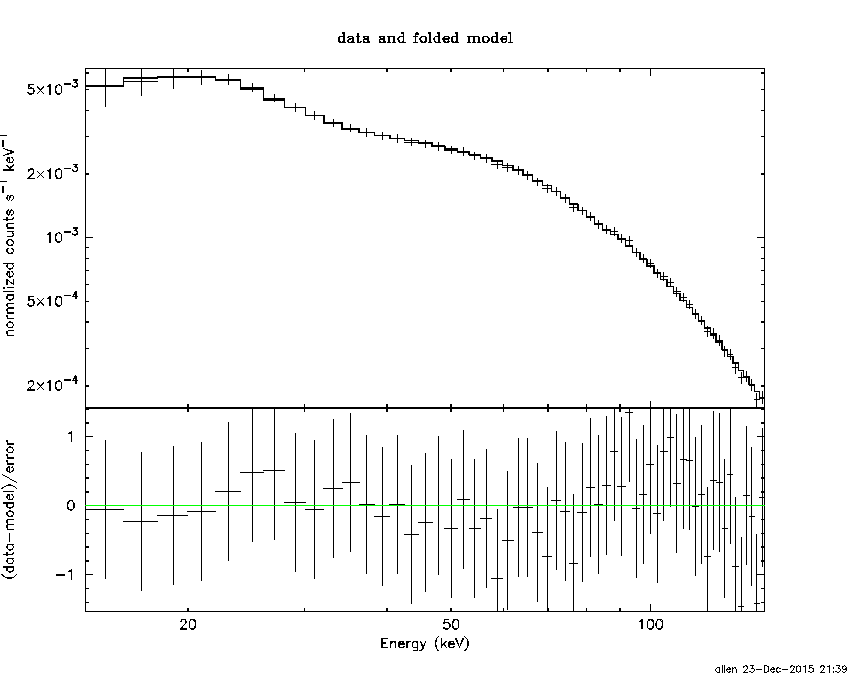
Multiple GTIs in the spectrum
tstart tstop
-73.736000 -47.580100
-46.092000 767.288000

Spectral model in power-law:
------------------------------------------------------------
Parameters  : value       lower 90%   higher 90%
Photon index: -1.18957     ( -0.0188701   0.0189644 )
Norm@50keV  : 1.59100E-02    ( -0.000194563   0.000193782 )
------------------------------------------------------------
#Fit statistic : Chi-Squared =          15.88 using 59 PHA bins.
# Reduced chi-squared =         0.2786 for     57 degrees of freedom
# Null hypothesis probability =   1.000000e+00

Photon flux (15-150 keV)    in 839.5 sec: 1.86482 ( -0.02583  0.02597 ) ph/cm2/s
Energy fluence (15-150 keV)             : 0.000135925 ( -1.35746e-06  1.35596e-06 ) ergs/cm2
Cutoff power-law model
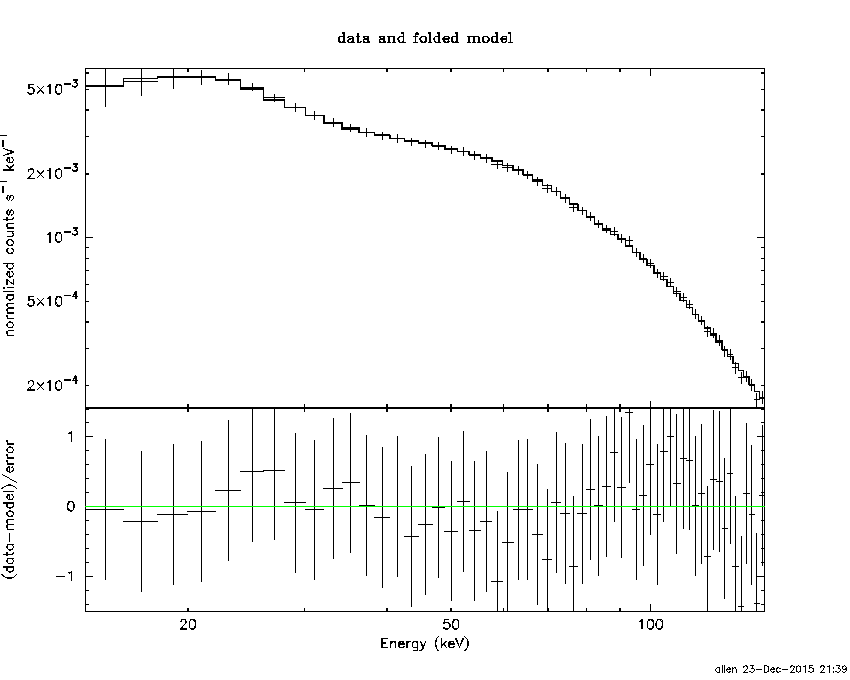
Multiple GTIs in the spectrum
tstart tstop
-73.736000 -47.580100
-46.092000 767.288000
Spectral model in the cutoff power-law:
------------------------------------------------------------
Parameters  : value       lower 90%   higher 90%
Photon index: -1.18475     ( -0.0184271   0.0199692 )
Epeak [keV] : 9999.36      ( -9999.36 -9999.36 )
Norm@50keV  : 1.59757E-02    ( -0.000184749   0.000311522 )
------------------------------------------------------------
#Fit statistic : Chi-Squared =          15.95 using 59 PHA bins.
# Reduced chi-squared =         0.2848 for     56 degrees of freedom
# Null hypothesis probability =   1.000000e+00

Photon flux (15-150 keV)    in 839.5 sec: 1.06596 ( -0.02966  0.01437 ) ph/cm2/s
Energy fluence (15-150 keV)             : 0.000135932 ( -1.55306e-06  1.51688e-06 ) ergs/cm2
1-s peak spectrum fit
Power-law model
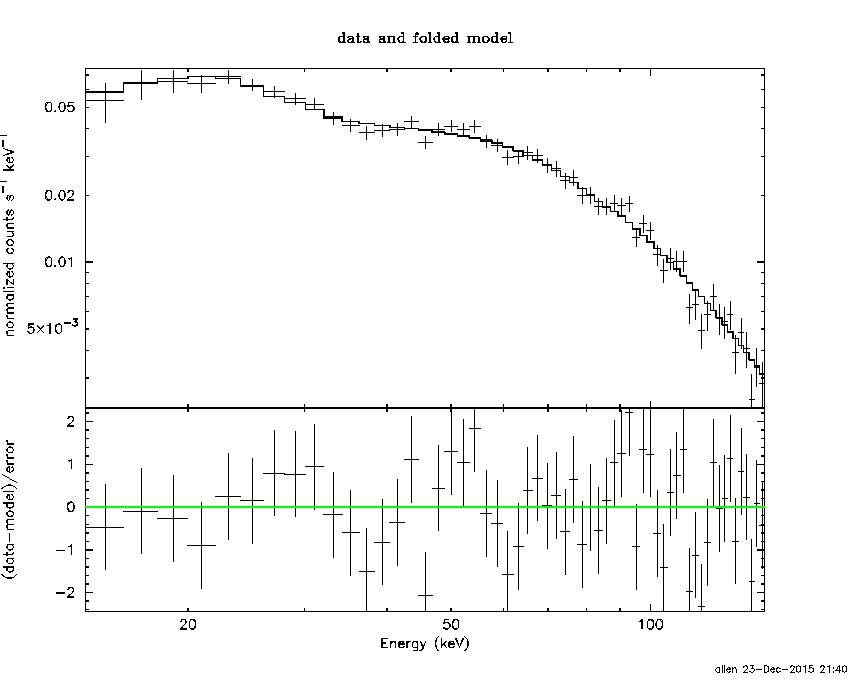
Time interval is from   57.664 sec. to   58.664 sec.

Spectral model in power-law:
------------------------------------------------------------
Parameters  : value       lower 90%   higher 90%
Photon index: -0.991232     ( -0.0334723   0.0335721 )
Norm@50keV  : 0.224667    ( -0.00409468   0.00408549 )
------------------------------------------------------------
#Fit statistic : Chi-Squared =          59.55 using 59 PHA bins.
# Reduced chi-squared =          1.045 for     57 degrees of freedom
# Null hypothesis probability =   3.831426e-01

Photon flux (15-150 keV)    in 1 sec: 1.26698 (    ) ph/cm2/s
Energy fluence (15-150 keV)             : 2.43731e-06 ( -4.57571e-08  4.57659e-08 ) ergs/cm2
Cutoff power-law model
Time interval is from   57.664 sec. to   58.664 sec.
Spectral model in the cutoff power-law:
------------------------------------------------------------
Parameters  : value       lower 90%   higher 90%
Photon index: -0.923802     ( -0.077926   0.116528 )
Epeak [keV] : 992.593      ( -997.684 -997.684 )
Norm@50keV  : 0.239304    ( -0.00421711   0.0266893 )
------------------------------------------------------------
#Fit statistic : Chi-Squared =          59.22 using 59 PHA bins.
# Reduced chi-squared =          1.058 for     56 degrees of freedom
# Null hypothesis probability =   3.588784e-01

Photon flux (15-150 keV)    in 1 sec: 25.8038 ( -0.4894  0.4967 ) ph/cm2/s
Energy fluence (15-150 keV)             : 2.43243e-06 ( -4.40138e-08  4.39084e-08 ) ergs/cm2
Time-resolved spectra
Distribution
T90 vs. Hardness ratio plot
T90                                   = N/A sec.
Hardness ratio (energy fluence ratio) = N/A
S(15-50 keV) vs. S(50-150 keV) plot
S(15-50 keV)  = N/A
S(50-150 keV) = N/A
The dash-dotted line and the dashed line traces the fluences calculated from the Band function with Epeak = 15 and 150 keV, respectively. Both lines assume a canonical values of alpha = -1 and beta = -2.5.
Mask shadow pattern
IMX = -1.496567800679415E-01, IMY = 6.375568929015461E-02
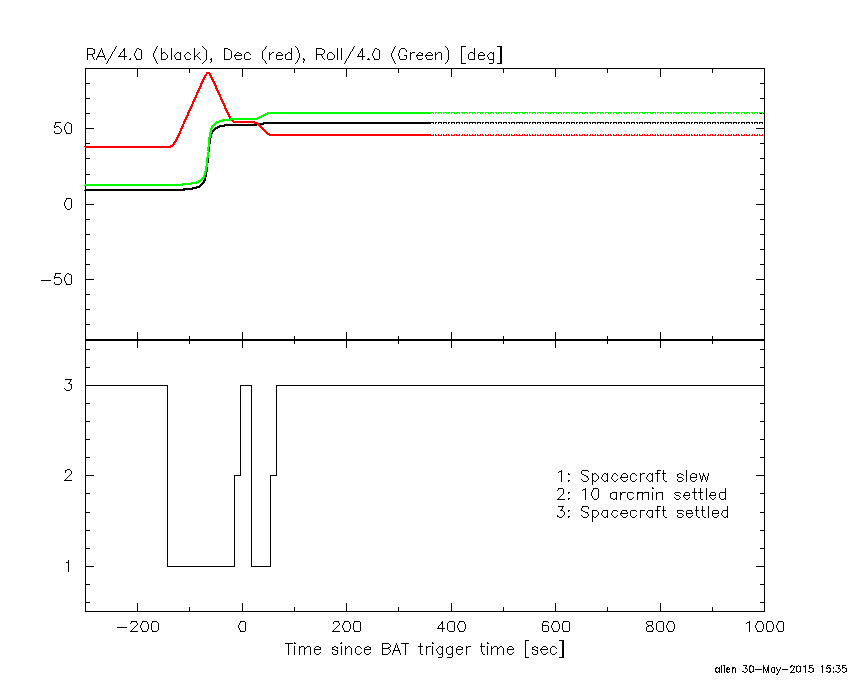
Spacecraft aspect plot
Bright source in the pre-burst/pre-slew/post-slew images
Pre-burst image of 15-350 keV band
Time interval of the image:
Pre-slew background subtracted image of 15-350 keV band
Time interval of the image:
-14.391400 18.008590

# RAcent  DECcent POSerr Theta    Phi  PeakCts   SNR AngSep     Name
#  [deg]    [deg]    ['] [deg]  [deg]                   [']
254.2791  35.4422   24.0  35.2  149.5  -0.3811  -0.5   10.6	Her X-1
276.1725  43.7791    2.5  42.4  121.6   9.8172   4.6 ------	UNKNOWN
281.1648  66.1318    2.4  34.7   87.2   5.3274   4.7 ------	UNKNOWN
268.2604  26.0508    3.4  50.2  145.5   8.5757   3.4 ------	UNKNOWN
246.0993  54.2087    2.6  20.3  121.0   2.3057   4.3 ------	UNKNOWN
215.8981  45.6036    0.1   9.2 -156.9  63.3232 133.0 ------	UNKNOWN
244.1170   8.3021    2.4  53.1 -177.5   6.5141   4.8 ------	UNKNOWN
240.9331   3.9726    2.0  55.9 -171.9  10.2983   5.7 ------	UNKNOWN
155.3910  42.2121    2.7  37.8  -40.0   3.1377   4.3 ------	UNKNOWN
213.6980  12.2921    2.7  42.0 -138.8   4.0883   4.3 ------	UNKNOWN
220.2930  -0.1121    2.5  54.9 -146.3  13.7220   4.7 ------	UNKNOWN
195.7685  13.2385    2.3  42.7 -112.8   9.5444   5.1 ------	UNKNOWN
Post-slew image of 15-350 keV band
Time interval of the image:
54.808590 962.974900

# RAcent  DECcent POSerr Theta    Phi  PeakCts   SNR AngSep     Name
#  [deg]    [deg]    ['] [deg]  [deg]                   [']
254.5061  35.3991    2.4  30.7  123.4   5.6073   4.9    4.1	Her X-1
257.7833   8.7501    3.1  51.5  150.2  14.2997   3.7 ------	UNKNOWN
215.8994  45.6044    0.1   0.0 -171.2  76.8186 107.9 ------	UNKNOWN
213.7815  20.8617    2.8  24.8 -147.6   2.9238   4.1 ------	UNKNOWN
128.7367  49.3989    2.2  55.6  -24.3  14.1124   5.2 ------	UNKNOWN