Analysis Summary
Notes:
- 1) No attempt has been made to eliminate the non-significant decimal places.
- 2) This batgrbproduct analysis is done using the HEASARC data.
- 3) This batgrbproduct analysis is using the flight position for the mask-weighting calculation.
======================================================================
BAT GRB EVENT DATA PROCESSING REPORT
Process Script Ver: batgrbproduct v2.46
Process Start Time: Sat Jan 11 23:15:45 EST 2014
Host Name: batevent1
Current Working Dir: /local/data/batevent/batevent_reproc/trigger570465
======================================================================
Trigger: 00570465 Segment: 000
BAT Trigger Time: 400667708.956 [s; MET]
Trigger Stop: 400667709.02 [s; MET]
UTC: 2013-09-12T08:34:57.933280 [includes UTCF correction]
Where From?: (*SHORT BURST*) TDRSS scaled map message
BAT
RA: 47.6148478284115 Dec: 13.9744257814072 [deg; J2000]
Catalogged Source?: NO
Point Source?: YES
GRB Indicated?: YES [ by BAT flight software ]
Image S/N Ratio: 7.18
Image Trigger?: NO
Rate S/N Ratio: 46.2385120867876 [ if not an image trigger ]
Image S/N Ratio: 7.18
Analysis Position: [ source = BAT ]
RA: 47.6148478284115 Dec: 13.9744257814072 [deg; J2000]
Refined Position: [ source = BAT pre-slew burst ]
RA: 47.606543942408 Dec: 13.9984281667244 [deg; J2000]
{ 03h 10m 25.6s , +13d 59' 54.3" }
+/- 1.64734215996842 [arcmin] (estimated 90% radius based on SNR)
+/- 0.534050308930498 [arcmin] (formal 1-sigma fit error)
SNR: 14.9082689189064
Angular difference between the analysis and refined position is 1.519127 arcmin
Partial Coding Fraction: 0.3125 [ including projection effects ]
Duration
T90: 0.283999919891357 +/- 0.0288444686585799
Measured from: 0.0160000324249268
to: 0.299999952316284 [s; relative to TRIGTIME]
T50: 0.20799994468689 +/- 0.0268327901402435
Measured from: 0.0400000214576721
to: 0.247999966144562 [s; relative to TRIGTIME]
Fluence
Peak Flux (peak 1 second)
Measured from: -0.335999965667725
to: 0.664000034332275 [s; relative to TRIGTIME]
Total Fluence
Measured from: 0.00400000810623169
to: 0.320000052452087 [s; relative to TRIGTIME]
Band 1 Band 2 Band 3 Band 4
15-25 25-50 50-100 100-350 keV
Total 0.050283 0.077143 0.076630 0.033084
0.006979 0.008371 0.009053 0.007701 [error]
Peak 0.053123 0.088663 0.076403 0.033673
0.011160 0.011890 0.011969 0.010707 [error]
[ fluence units of on-axis counts / fully illuminated detector ]
======================================================================
====== Table of the duration information =============================
Value tstart tstop
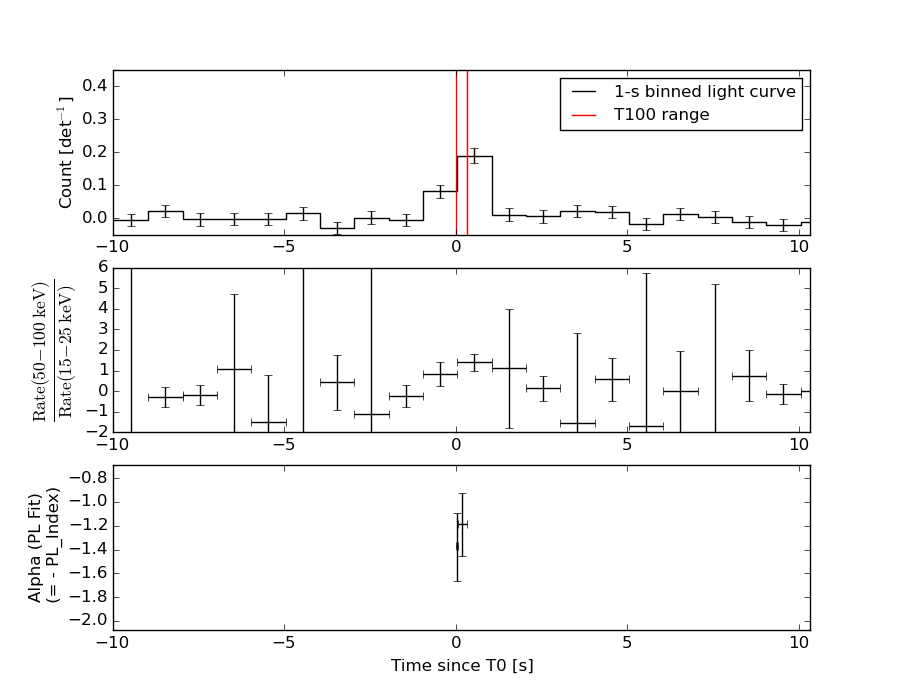
T100 0.316 0.004 0.320
T90 0.284 0.016 0.300
T50 0.208 0.040 0.248
Peak 1.000 -0.336 0.664
====== Spectral Analysis Summary =====================================
Model : spectral model: simple power-law (PL) and cutoff power-law (CPL)
Ph_index : photon index: E^{Ph_index}
Ph_90err : 90% error of the photon index
Epeak : Epeak in keV
Epeak_90err: 90% error of Epeak
Norm : normalization at 50 keV in both the PL model and CPL model
Nomr_90err : 90% error of the normalization
chi2 : Chi-Squared
dof : degree of freedo
=== Time-averaged spectral analysis ===
(Best model with acceptable fit: PL)
Model Ph_index Ph_90err_low Ph_90err_hi Epeak Epeak_90err_low Epeak_90err_hi Norm Nomr_90err_low Norm_90err_hi chi2 dof
PL -1.205 -0.195 0.195 - - - 5.46e-02 -5.98e-03 5.98e-03 46.510 57
CPL -1.156 -0.243 0.564 965.147 -965.147 -965.147 5.75e-02 N/A N/A 46.600 56
=== 1-s peak spectral analysis ===
(Best model with acceptable fit: PL)
Model Ph_index Ph_90err_low Ph_90err_hi Epeak Epeak_90err_low Epeak_90err_hi Norm Nomr_90err_low Norm_90err_hi chi2 dof
PL -1.268 -0.256 0.258 - - - 1.82e-02 -2.64e-03 2.64e-03 68.040 57
CPL -1.078 -1.006 -0.891 272.455 N/A N/A 2.22e-02 N/A N/A 67.900 56
=== Fluence/Peak Flux Summary ===
Model Band1 Band2 Band3 Band4 Band5 Total
15-25 25-50 50-100 100-350 15-150 15-350 keV
Fluence PL 1.67e-08 3.68e-08 6.39e-08 2.58e-07 1.75e-07 3.75e-07 erg/cm2
90%_error_low -3.36e-09 -4.59e-09 -8.62e-09 -7.01e-08 -2.16e-08 -7.65e-08 erg/cm2
90%_error_hi 3.58e-09 4.52e-09 8.48e-09 8.54e-08 2.17e-08 8.96e-08 erg/cm2
Peak flux PL 5.98e-01 6.91e-01 5.74e-01 8.02e-01 2.15e+00 2.67e+00 ph/cm2/s
90%_error_low -1.62e-01 -1.20e-01 -9.76e-02 -2.56e-01 -3.27e-01 -3.99e-01 ph/cm2/s
90%_error_hi 1.77e-01 1.18e-01 9.59e-02 3.21e-01 3.29e-01 4.04e-01 ph/cm2/s
Fluence CPL 1.67e-08 3.67e-08 6.31e-08 2.67e-07 1.75e-07 3.76e-07 erg/cm2
90%_error_low N/A N/A -1.03e-08 N/A -2.29e-08 -1.43e-07 erg/cm2
90%_error_hi N/A N/A 1.29e-08 N/A 2.24e-08 4.13e-08 erg/cm2
Peak flux CPL 5.71e-01 7.00e-01 5.88e-01 6.61e-01 2.14e+00 2.52e+00 ph/cm2/s
90%_error_low -1.97e-01 -1.26e-01 -1.08e-01 -3.87e-01 -3.36e-01 -5.45e-01 ph/cm2/s
90%_error_hi 1.74e-01 1.30e-01 1.17e-01 2.62e-01 3.37e-01 5.18e-01 ph/cm2/s
======================================================================
Image
Pre-slew 15.0-350.0 keV image (Event data)
#   RAcent    DECcent   POSerr    Theta     Phi              Peak Cts       SNR   Name
   47.6065    13.9984   0.0129    47.6792   -21.9723         0.2522194     14.908 TRIG_00570465

Foreground time interval of the image:
  0.004   0.320 (delta_t =   0.316 [sec])
Background time interval of the image:
-239.956   0.004 (delta_t = 239.960 [sec])
Light Curves
Note: The mask-weighted lightcurves have units of either count/det or counts/sec/det, where a det is 0.4 x 0.4 = 0.16 sq cm.
Full-time range; 1 s binning
Other quick-look light curves:
- 64 ms binning (zoomed)
- 16 ms binning (zoomed)
- 8 ms binning (zoomed)
- 2 ms binning (zoomed)
- SN=5 or 10 s binning (full-time range)
- Raw light curve
Spectra
- 64 ms binning (zoomed)
- 16 ms binning (zoomed)
- 8 ms binning (zoomed)
- 2 ms binning (zoomed)
- SN=5 or 10 s binning (full-time range)
- Raw light curve
Spectra
Notes:
- 1) The fitting includes the systematic errors.
- 2) When the burst includes telescope slew time periods, the fitting uses an average response file made from multiple 5-s response files through out the slew time plus single time preiod for the non-slew times, and weighted by the total counts in the corresponding time period using addrmf. An average response file is needed becuase a spectral fit using the pre-slew DRM will introduce some errors in both a spectral shape and a normalization if the PHA file contains a lot of the slew/post-slew time interval.
- 3) For fits to more complicated models (e.g. a power-law over a cutoff power-law), the BAT team has decided to require a chi-square improvement of more than 6 for each extra dof.
Time averaged spectrum fit using the average DRM
Power-law model
Time interval is from    0.004 sec. to    0.320 sec.

Spectral model in power-law:
------------------------------------------------------------
Parameters  : value       lower 90%   higher 90%
Photon index: -1.20452     ( -0.195473   0.19507 )
Norm@50keV  : 5.45680E-02    ( -0.00597822   0.00597635 )
------------------------------------------------------------
#Fit statistic : Chi-Squared =          46.51 using 59 PHA bins.
# Reduced chi-squared =         0.8160 for     57 degrees of freedom
# Null hypothesis probability =   8.380601e-01

Photon flux (15-150 keV)    in 0.316 sec: 6.40929 ( -0.71795  0.71915 ) ph/cm2/s
Energy fluence (15-150 keV)             : 1.74738e-07 ( -2.15773e-08  2.17008e-08 ) ergs/cm2
Cutoff power-law model

Time interval is from    0.004 sec. to    0.320 sec.
Spectral model in the cutoff power-law:
------------------------------------------------------------
Parameters  : value       lower 90%   higher 90%
Photon index: -1.20007     ( -0.243279   0.564312 )
Epeak [keV] : 1.00000E+04      ( -10000 -10000 )
Norm@50keV  : 5.48305E-02    (     )
------------------------------------------------------------
#Fit statistic : Chi-Squared =          46.52 using 59 PHA bins.
# Reduced chi-squared =         0.8307 for     56 degrees of freedom
# Null hypothesis probability =   8.127764e-01

Photon flux (15-150 keV)    in 0.316 sec: 6.43685 (    ) ph/cm2/s
Energy fluence (15-150 keV)             : 1.74992e-07 ( -2.28538e-08  2.23901e-08 ) ergs/cm2
1-s peak spectrum fit
Power-law model
Time interval is from   -0.336 sec. to    0.664 sec.

Spectral model in power-law:
------------------------------------------------------------
Parameters  : value       lower 90%   higher 90%
Photon index: -1.26773     ( -0.256151   0.258017 )
Norm@50keV  : 1.81503E-02    ( -0.00264424   0.00264421 )
------------------------------------------------------------
#Fit statistic : Chi-Squared =          68.04 using 59 PHA bins.
# Reduced chi-squared =          1.194 for     57 degrees of freedom
# Null hypothesis probability =   1.503185e-01

Photon flux (15-150 keV)    in 1 sec: 2.15305 ( -0.32715  0.32892 ) ph/cm2/s
Energy fluence (15-150 keV)             : 1.80834e-07 ( -2.86742e-08  2.88668e-08 ) ergs/cm2
Cutoff power-law model
Time interval is from   -0.336 sec. to    0.664 sec.
Spectral model in the cutoff power-law:
------------------------------------------------------------
Parameters  : value       lower 90%   higher 90%
Photon index: -2.07477     ( -0.00834442   0.10594 )
Epeak [keV] : 27.8869      (   )
Norm@50keV  : 4.21643E-03    (     )
------------------------------------------------------------
#Fit statistic : Chi-Squared =          66.88 using 59 PHA bins.
# Reduced chi-squared =          1.194 for     56 degrees of freedom
# Null hypothesis probability =   1.514097e-01

Photon flux (15-150 keV)    in 1 sec: 2.13552 ( -0.33622  0.33701 ) ph/cm2/s
Energy fluence (15-150 keV)             : 1.79382e-07 ( -2.98135e-08  2.95572e-08 ) ergs/cm2
Time-resolved spectra
Distribution
T90 vs. Hardness ratio plot
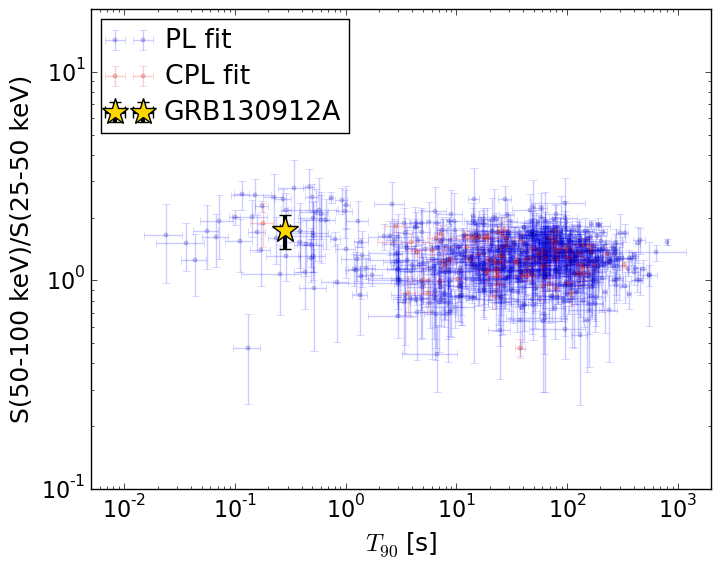
T90                                   = 0.2839999 sec.
Hardness ratio (energy fluence ratio) = 1.73568121771
S(15-50 keV) vs. S(50-150 keV) plot
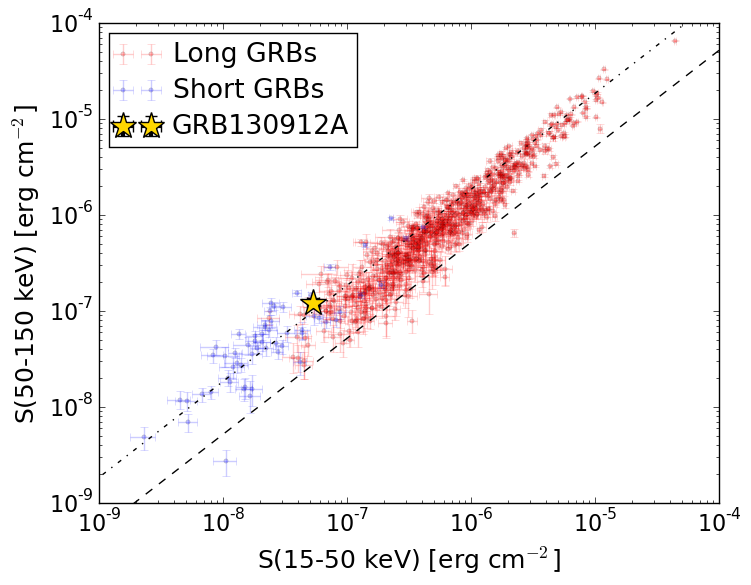
S(15-50 keV)  = 5.350581e-08
S(50-150 keV) = 1.2123416e-07
The dash-dotted line and the dashed line traces the fluences calculated from the Band function with Epeak = 15 and 150 keV, respectively. Both lines assume a canonical values of alpha = -1 and beta = -2.5.
Mask shadow pattern
IMX = 1.018415789227998E+00, IMY = 4.108947869760430E-01
Spacecraft aspect plot
Bright source in the pre-burst/pre-slew/post-slew images
Pre-burst image of 15-350 keV band
Time interval of the image:
-239.956000 0.004000

# RAcent  DECcent POSerr Theta    Phi  PeakCts   SNR AngSep     Name
#  [deg]    [deg]    ['] [deg]  [deg]                   [']
299.5537  35.2740    8.0  49.5  173.1   0.6405   1.4    4.7	Cyg X-1
308.1330  40.9129    1.7  42.2  179.9   2.0246   6.9    2.6	Cyg X-3
326.2038  38.1812    2.5  28.1  176.9   0.8727   4.5    8.6	Cyg X-2
324.6058  18.1346    2.3  33.0  137.8   1.4011   5.0 ------	UNKNOWN
 54.7380  36.1769    4.2  47.0  -53.5   2.4558   2.8 ------	UNKNOWN
Pre-slew background subtracted image of 15-350 keV band
Time interval of the image:
0.004000 0.320000

# RAcent  DECcent POSerr Theta    Phi  PeakCts   SNR AngSep     Name
#  [deg]    [deg]    ['] [deg]  [deg]                   [']
299.7066  35.1434   15.2  49.4  172.9  -0.0131  -0.8    6.7	Cyg X-1
307.9171  40.9037  102.2  42.4  179.9  -0.0013  -0.1    9.2	Cyg X-3
326.1715  38.3225  495.9  28.2  177.1   0.0002   0.0    0.1	Cyg X-2
300.0769  21.6199    2.3  52.9  156.0   0.1681   5.1 ------	UNKNOWN
 47.6066  13.9984    0.8  47.7  -22.0   0.2522  14.9 ------	UNKNOWN
 29.4651  47.7826    2.4  30.0  -76.3   0.0565   4.9 ------	UNKNOWN
 39.4607  37.6698    2.3  34.7  -54.6   0.0548   5.0 ------	UNKNOWN
Post-slew image of 15-350 keV band
Time interval of the image:
77.344590 962.164300

# RAcent  DECcent POSerr Theta    Phi  PeakCts   SNR AngSep     Name
#  [deg]    [deg]    ['] [deg]  [deg]                   [']
 83.6277  22.0012    0.4  35.1  -94.9  36.4178  32.5    0.9	Crab
 29.1837 -15.7740    3.8  34.9   45.7   2.4438   3.0 ------	UNKNOWN
 42.0512   1.4076    2.4  13.7   37.7   2.1599   4.7 ------	UNKNOWN
 56.8687 -40.6469    2.7  55.3    5.0   9.1436   4.3 ------	UNKNOWN
 71.1525 -32.3299    2.8  51.5  -12.0   4.3838   4.2 ------	UNKNOWN
 72.6838 -38.1858    2.9  57.2   -9.8   8.0378   4.0 ------	UNKNOWN
 87.9906 -27.1115    3.3  56.8  -30.0  10.0322   3.5 ------	UNKNOWN