Analysis Summary
Notes:
- 1) No attempt has been made to eliminate the non-significant decimal places.
- 2) This batgrbproduct analysis is done using the HEASARC data.
- 3) This batgrbproduct analysis is using the flight position for the mask-weighting calculation.
==========================================================================
BAT GROUND-DETECTED GRB DATA PROCESSING REPORT
Process Script Ver: batgrbproduct v2.46
Process Start Time: Tue Oct 6 19:32:14 EDT 2015
Host Name: bat1
Current Working Dir: /local/data/bat1/alien/Swift_3rdBATcatalog/event/ground_detect_bursts/scripts
======================================================================
Trigger: 00570531 Segment: 000
BAT Trigger Time: 400724908.8
UTC: 2013-09-13T00:28:17.775 [includes UTCF correction]
Where From?: Ground analysis (best_duration.txt)
NOTE: BAT trigger time for ground-detected burst is the T100 start time.
Analysis Position: [ source = GCN ]
RA: Dec: [deg; J2000]
Refined Position: [ source = BAT pre-slew image ]
RA: 341.983598004 Dec: 1.16774168935 [deg; J2000]
{ 22h 47m 56.1s , +01d 10' 03.9" }
+/- 4.77385009079 [arcmin] (estimated 90% radius based on SNR)
SNR: 3.26108905588
Angular difference between the analysis and refined position is 1083.177190 arcmin
Partial Coding Fraction: 0.9921875 [ including projection effects ]
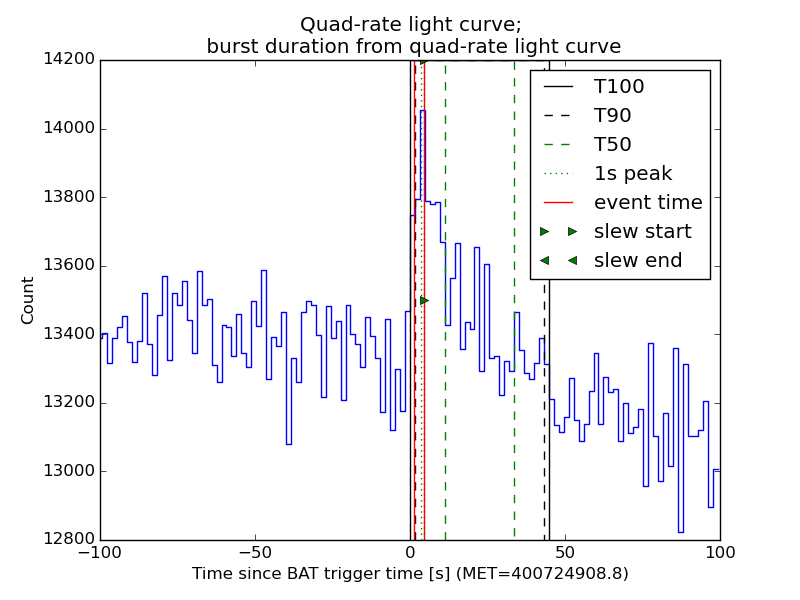
Duration
T90: 41.6000000238419 +/- 1.6
Measured from: 1.6
to: 43.2 [s; relative to TRIGTIME]
T50: 22.4000000357628 +/- 1.6
Measured from: 11.2
to: 33.6 [s; relative to TRIGTIME]
====== Table of the duration information =============================
Value tstart tstop
T100 44.800 0.000 44.800
T90 41.600 1.600 43.200
T50 22.400 11.200 33.600
Peak 1.000 3.500 4.500
====== Spectral Analysis Summary =====================================
Model : spectral model: simple power-law (PL) and cutoff power-law (CPL)
Ph_index : photon index: E^{Ph_index}
Ph_90err : 90% error of the photon index
Epeak : Epeak in keV
Epeak_90err: 90% error of Epeak
Norm : normalization at 50 keV in both the PL model and CPL model
Nomr_90err : 90% error of the normalization
chi2 : Chi-Squared
dof : degree of freedo
=== Time-averaged spectral analysis ===
(Best model with acceptable fit: PL)
Model Ph_index Ph_90err_low Ph_90err_hi Epeak Epeak_90err_low Epeak_90err_hi Norm Nomr_90err_low Norm_90err_hi chi2 dof
PL -0.863 -0.504 0.558 - - - 1.11e-03 -3.17e-04 3.07e-04 64.310 57
CPL -0.688 0.688 2.869 452.176 N/A N/A 1.31e-03 N/A N/A 64.290 56
=== 1-s peak spectral analysis ===
(Best model with acceptable fit: N/A)
Model Ph_index Ph_90err_low Ph_90err_hi Epeak Epeak_90err_low Epeak_90err_hi Norm Nomr_90err_low Norm_90err_hi chi2 dof
PL -0.297 -1.906 0.297 - - - 1.07e-03 -1.07e-03 1.07e-03 60.860 57
CPL -0.306 N/A N/A 9999.360 N/A N/A 1.09e-03 N/A N/A 60.860 56
=== Fluence/Peak Flux Summary ===
Model Band1 Band2 Band3 Band4 Band5 Total
15-25 25-50 50-100 100-350 15-150 15-350 keV
Fluence PL 7.82e-09 2.13e-08 4.68e-08 2.71e-07 1.26e-07 3.47e-07 erg/cm2
90%_error_low -4.18e-09 -7.72e-09 -1.42e-08 -1.51e-07 -3.74e-08 -1.61e-07 erg/cm2
90%_error_hi 5.22e-09 7.36e-09 1.38e-08 2.66e-07 3.81e-08 2.66e-07 erg/cm2
Peak flux PL 1.41e-02 2.94e-02 4.79e-02 1.75e-01 1.32e-01 2.67e-01 ph/cm2/s
90%_error_low -1.41e-02 -2.94e-02 -4.79e-02 -1.75e-01 -1.32e-01 -2.67e-01 ph/cm2/s
90%_error_hi 5.77e-02 4.54e-02 3.63e-02 1.09e+00 1.14e-01 7.72e-01 ph/cm2/s
Fluence CPL 7.44e-09 2.15e-08 4.77e-08 2.16e-07 1.25e-07 2.93e-07 erg/cm2
90%_error_low -4.11e-09 -7.85e-09 -1.49e-08 N/A -4.03e-08 -1.97e-07 erg/cm2
90%_error_hi 6.16e-09 8.13e-09 1.79e-08 N/A 3.89e-08 1.79e-07 erg/cm2
Peak flux CPL 1.86e-02 3.14e-02 4.79e-02 1.72e-01 1.33e-01 2.78e-01 ph/cm2/s
90%_error_low N/A N/A N/A N/A N/A N/A ph/cm2/s
90%_error_hi N/A N/A N/A N/A N/A N/A ph/cm2/s
======================================================================
Image
15.0-350.0 keV image (Event data)
#RAcent DECcent POSerr Theta  Phi  Peak_Cts  SNR Name
341.913 1.245 0.051 13.664 -134.912 0.067 3.780 TRIG_00570531

Image time interval: 1.200 to 4.501 [sec]
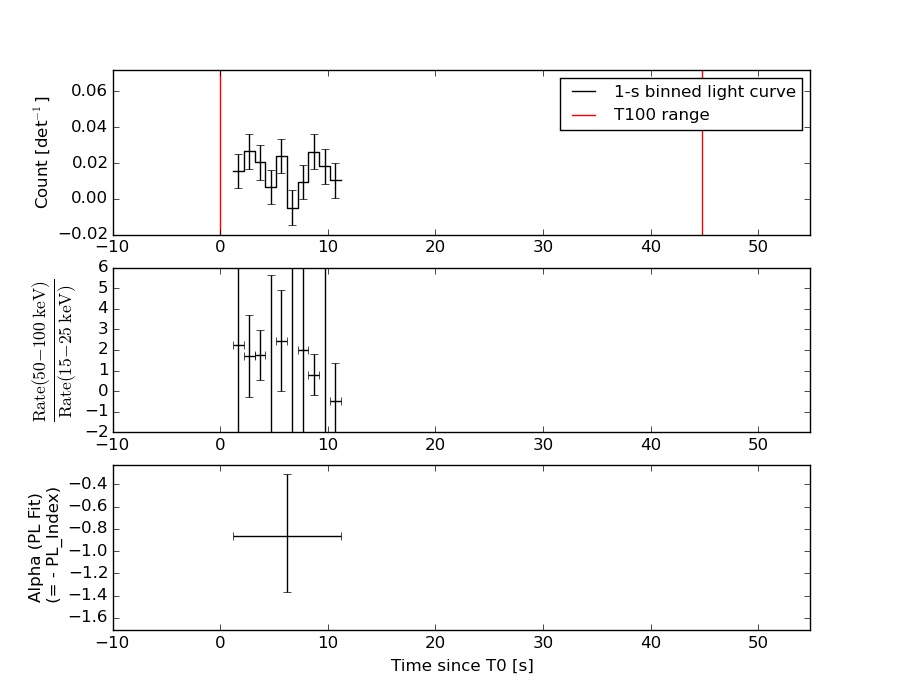
Light Curves
Note: The mask-weighted lightcurves have units of either count/det or counts/sec/det, where a det is 0.4 x 0.4 = 0.16 sq cm.
Best duration plot
Full-time range; 1 s binning
Other quick-look light curves:
Spectra
Notes:
- 1) The fitting includes the systematic errors.
- 2) When the burst includes telescope slew time periods, the fitting uses an average response file made from multiple 5-s response files through out the slew time plus single time preiod for the non-slew times, and weighted by the total counts in the corresponding time period using addrmf. An average response file is needed becuase a spectral fit using the pre-slew DRM will introduce some errors in both a spectral shape and a normalization if the PHA file contains a lot of the slew/post-slew time interval.
- 3) For fits to more complicated models (e.g. a power-law over a cutoff power-law), the BAT team has decided to require a chi-square improvement of more than 6 for each extra dof.
Time averaged spectrum fit using the average DRM
Power-law model

Time interval is from    1.200 sec. to   11.221 sec.

Spectral model in power-law:
------------------------------------------------------------
Parameters  : value       lower 90%   higher 90%
Photon index: -0.862707     ( -0.503938   0.558231 )
Norm@50keV  : 1.10659E-03    ( -0.000316498   0.000307457 )
------------------------------------------------------------
#Fit statistic : Chi-Squared =          64.31 using 59 PHA bins.
# Reduced chi-squared =          1.128 for     57 degrees of freedom
# Null hypothesis probability =   2.358804e-01

Photon flux (15-150 keV)    in 10.02 sec: 0.127009 ( -0.0352652  0.035507 ) ph/cm2/s
Energy fluence (15-150 keV)             : 1.26292e-07 ( -3.73643e-08  3.81026e-08 ) ergs/cm2
Cutoff power-law model
Time interval is from    1.200 sec. to   11.221 sec.
Spectral model in the cutoff power-law:
------------------------------------------------------------
Parameters  : value       lower 90%   higher 90%
Photon index: -2.64909     ( 2.64911   4.83008 )
Epeak [keV] : 189.216      (   )
Norm@50keV  : 6.36961E-05    (     )
------------------------------------------------------------
#Fit statistic : Chi-Squared =          64.17 using 59 PHA bins.
# Reduced chi-squared =          1.146 for     56 degrees of freedom
# Null hypothesis probability =   2.119910e-01

Photon flux (15-150 keV)    in 10.02 sec: 0.125930 ( -0.0378316  0.036276 ) ph/cm2/s
Energy fluence (15-150 keV)             : 1.25241e-07 ( -4.02979e-08  3.88776e-08 ) ergs/cm2
1-s peak spectrum fit
Power-law model
Time interval is from    3.500 sec. to    4.500 sec.

Spectral model in power-law:
------------------------------------------------------------
Parameters  : value       lower 90%   higher 90%
Photon index: -0.29718     ( -1.90679   0.296506 )
Norm@50keV  : 1.07190E-03    ( -0.0010715   0.00107013 )
------------------------------------------------------------
#Fit statistic : Chi-Squared =          60.86 using 59 PHA bins.
# Reduced chi-squared =          1.068 for     57 degrees of freedom
# Null hypothesis probability =   3.388716e-01

Photon flux (15-150 keV)    in 1 sec: 0.132305 ( -0.132305  0.113569 ) ph/cm2/s
Energy fluence (15-150 keV)             : 1.60483e-08 ( -1.24072e-08  1.25316e-08 ) ergs/cm2
Cutoff power-law model
Time interval is from    3.500 sec. to    4.500 sec.
Spectral model in the cutoff power-law:
------------------------------------------------------------
Parameters  : value       lower 90%   higher 90%
Photon index: -0.305803     (       )
Epeak [keV] : 9999.36      (   )
Norm@50keV  : 1.09185E-03    (     )
------------------------------------------------------------
#Fit statistic : Chi-Squared =          60.86 using 59 PHA bins.
# Reduced chi-squared =          1.087 for     56 degrees of freedom
# Null hypothesis probability =   3.053295e-01

Photon flux (15-150 keV)    in 1 sec: 0.132762 (    ) ph/cm2/s
Energy fluence (15-150 keV)             : 1.57203e-08 ( -1.57199e-08  1.30935e-08 ) ergs/cm2
Time-resolved spectra
Distribution
T90 vs. Hardness ratio plot
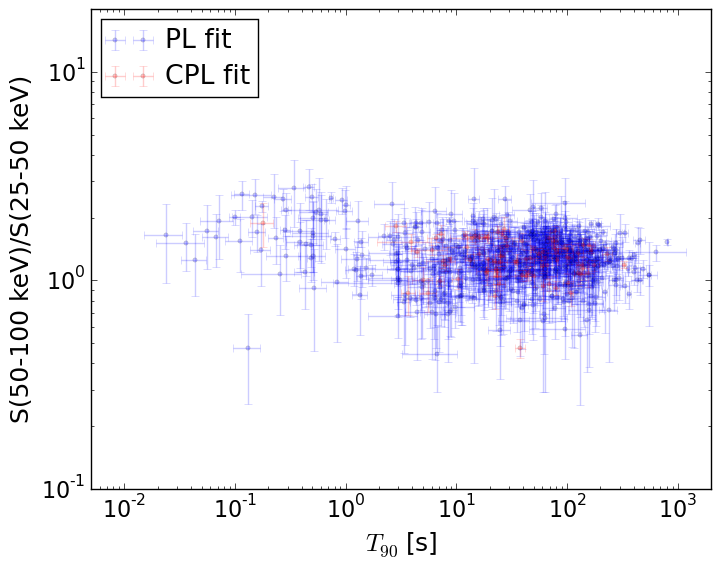
T90                                   = N/A sec.
Hardness ratio (energy fluence ratio) = N/A
S(15-50 keV) vs. S(50-150 keV) plot
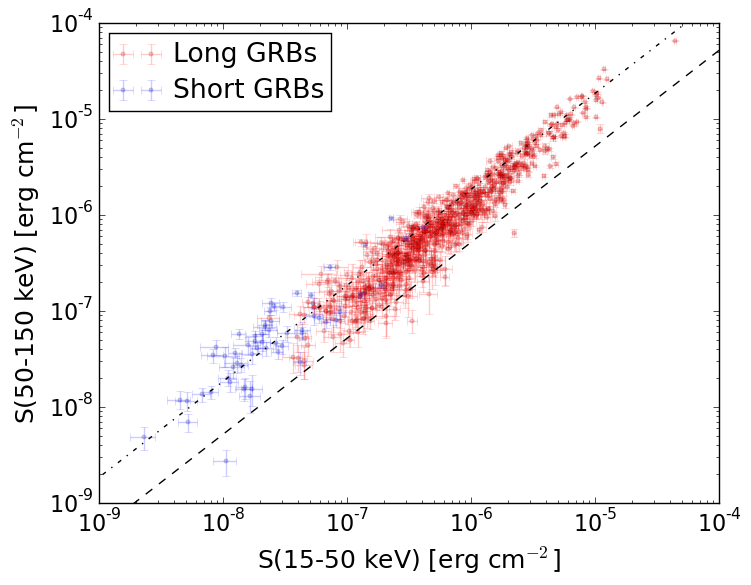
S(15-50 keV)  = N/A
S(50-150 keV) = N/A
The dash-dotted line and the dashed line traces the fluences calculated from the Band function with Epeak = 15 and 150 keV, respectively. Both lines assume a canonical values of alpha = -1 and beta = -2.5.
Mask shadow pattern
IMX = -0.171635734287, IMY = 0.17216615615
Spacecraft aspect plot
Bright source in the event data image
Event data image of 15-350 keV band
Time interval of the image:
1.200000 4.500590

# RAcent  DECcent POSerr Theta    Phi  PeakCts   SNR AngSep     Name
#  [deg]    [deg]    ['] [deg]  [deg]                   [']
Webpage updated on:
Sun Jun 21 01:05:23 EDT 2015