Analysis Summary
Notes:
- 1) No attempt has been made to eliminate the non-significant decimal places.
- 2) This batgrbproduct analysis is done using the HEASARC data.
- 3) This batgrbproduct analysis is using the flight position for the mask-weighting calculation.
======================================================================
BAT GRB EVENT DATA PROCESSING REPORT
Process Script Ver: batgrbproduct v2.46
Process Start Time: Sat Jan 11 23:11:22 EST 2014
Host Name: batevent1
Current Working Dir: /local/data/batevent/batevent_reproc/trigger571271
======================================================================
Trigger: 00571271 Segment: 000
BAT Trigger Time: 401281656 [s; MET]
Trigger Stop: 401281720 [s; MET]
UTC: 2013-09-19T11:07:24.949420 [includes UTCF correction]
Where From?: TDRSS position message
BAT
RA: 207.28832904434 Dec: -10.3555440490979 [deg; J2000]
Catalogged Source?: NO
Point Source?: YES
GRB Indicated?: YES [ by BAT flight software ]
Image S/N Ratio: 14.9
Image Trigger?: YES
Rate S/N Ratio: 0 [ if not an image trigger ]
Image S/N Ratio: 14.9
Analysis Position: [ source = BAT ]
RA: 207.28832904434 Dec: -10.3555440490979 [deg; J2000]
Refined Position: [ source = BAT pre-slew burst ]
RA: 207.280583588002 Dec: -10.3541576041001 [deg; J2000]
{ 13h 49m 07.3s , -10d 21' 15.0" }
+/- 1.55965233067255 [arcmin] (estimated 90% radius based on SNR)
+/- 0.604999490326629 [arcmin] (formal 1-sigma fit error)
SNR: 16.1199756727995
Angular difference between the analysis and refined position is 0.464665 arcmin
Partial Coding Fraction: 0.7734375 [ including projection effects ]
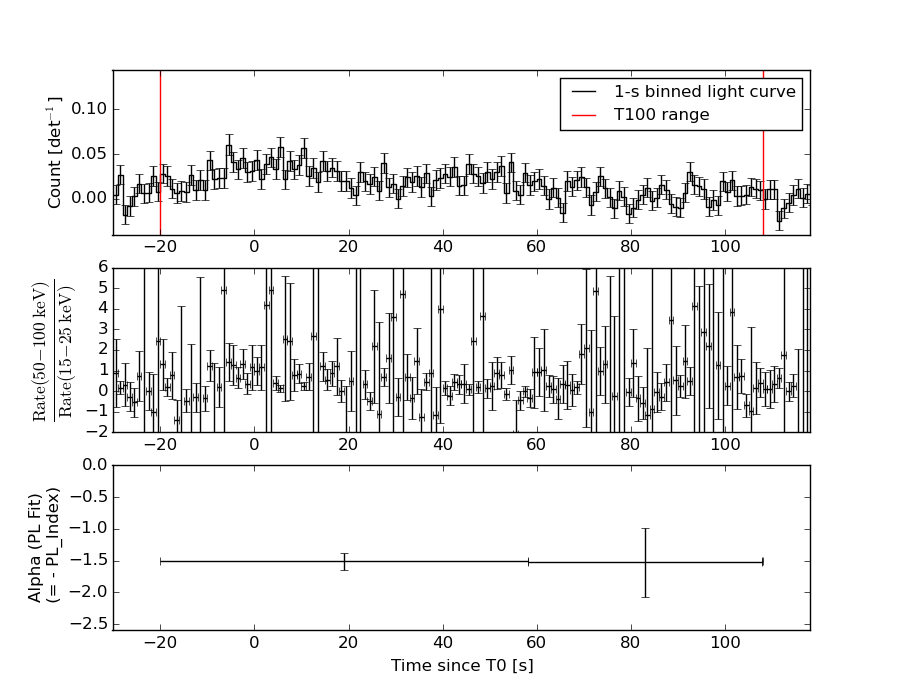
Duration
T90: 99.6839999556541 +/- 26.0280581649074
Measured from: -7.17599999904633
to: 92.5079999566078 [s; relative to TRIGTIME]
T50: 45.2559999227524 +/- 6.26075144841554
Measured from: 1.88800001144409
to: 47.1439999341965 [s; relative to TRIGTIME]
Fluence
Peak Flux (peak 1 second)
Measured from: -6.34399998188019
to: -5.34399998188019 [s; relative to TRIGTIME]
Total Fluence
Measured from: -20.1520000100136
to: 108.068000018597 [s; relative to TRIGTIME]
Band 1 Band 2 Band 3 Band 4
15-25 25-50 50-100 100-350 keV
Total 0.597518 0.999203 0.635618 0.121001
0.067616 0.066135 0.058546 0.052887 [error]
Peak 0.014789 0.032682 0.017828 0.005848
0.006227 0.006071 0.005411 0.004811 [error]
[ fluence units of on-axis counts / fully illuminated detector ]
======================================================================
====== Table of the duration information =============================
Value tstart tstop
T100 128.220 -20.152 108.068
T90 99.684 -7.176 92.508
T50 45.256 1.888 47.144
Peak 1.000 -6.344 -5.344
====== Spectral Analysis Summary =====================================
Model : spectral model: simple power-law (PL) and cutoff power-law (CPL)
Ph_index : photon index: E^{Ph_index}
Ph_90err : 90% error of the photon index
Epeak : Epeak in keV
Epeak_90err: 90% error of Epeak
Norm : normalization at 50 keV in both the PL model and CPL model
Nomr_90err : 90% error of the normalization
chi2 : Chi-Squared
dof : degree of freedo
=== Time-averaged spectral analysis ===
(Best model with acceptable fit: CPL)
Model Ph_index Ph_90err_low Ph_90err_hi Epeak Epeak_90err_low Epeak_90err_hi Norm Nomr_90err_low Norm_90err_hi chi2 dof
PL -1.514 -0.139 0.138 - - - 1.24e-03 -1.03e-04 1.02e-04 57.190 57
CPL -0.392 -0.681 0.814 68.543 -11.948 34.371 4.72e-03 -2.59e-03 7.55e-03 48.520 56
=== 1-s peak spectral analysis ===
(Best model with acceptable fit: PL)
Model Ph_index Ph_90err_low Ph_90err_hi Epeak Epeak_90err_low Epeak_90err_hi Norm Nomr_90err_low Norm_90err_hi chi2 dof
PL -1.313 -0.422 0.438 - - - 4.66e-03 -1.16e-03 1.16e-03 63.830 57
CPL -0.508 -0.973 4.632 85.589 N/A N/A 1.27e-02 N/A N/A 63.440 56
=== Fluence/Peak Flux Summary ===
Model Band1 Band2 Band3 Band4 Band5 Total
15-25 25-50 50-100 100-350 15-150 15-350 keV
Fluence PL 2.06e-07 3.75e-07 5.25e-07 1.54e-06 1.51e-06 2.65e-06 erg/cm2
90%_error_low -2.69e-08 -3.10e-08 -5.66e-08 -3.24e-07 -1.36e-07 -3.75e-07 erg/cm2
90%_error_hi 2.79e-08 3.09e-08 5.66e-08 3.79e-07 1.38e-07 4.20e-07 erg/cm2
Peak flux PL 1.60e-01 1.80e-01 1.45e-01 1.94e-01 5.58e-01 6.81e-01 ph/cm2/s
90%_error_low -6.69e-02 -5.07e-02 -4.35e-02 -9.70e-02 -1.41e-01 -1.73e-01 ph/cm2/s
90%_error_hi 7.54e-02 4.94e-02 4.29e-02 1.47e-01 1.41e-01 1.79e-01 ph/cm2/s
Fluence CPL 1.73e-07 4.17e-07 5.40e-07 3.69e-07 1.36e-06 1.50e-06 erg/cm2
90%_error_low -3.31e-08 -4.05e-08 -6.59e-08 -1.94e-07 -1.55e-07 -2.45e-07 erg/cm2
90%_error_hi 3.38e-08 4.18e-08 6.51e-08 4.36e-07 1.60e-07 4.48e-07 erg/cm2
Peak flux CPL 1.44e-01 1.98e-01 1.50e-01 7.34e-02 5.39e-01 5.64e-01 ph/cm2/s
90%_error_low -8.11e-02 -6.39e-02 -3.69e-02 -7.34e-02 -1.58e-01 -1.83e-01 ph/cm2/s
90%_error_hi 8.54e-02 8.31e-02 4.96e-02 1.55e-01 1.50e-01 2.19e-01 ph/cm2/s
======================================================================
Image
Pre-slew 15.0-350.0 keV image (Event data)
#   RAcent    DECcent   POSerr    Theta     Phi              Peak Cts       SNR   Name
  207.2806   -10.3542   0.0119    18.8778   -97.5897         2.2520415     16.120 TRIG_00571271

Foreground time interval of the image:
-11.699 108.068 (delta_t = 119.767 [sec])
Background time interval of the image:
Light Curves
Note: The mask-weighted lightcurves have units of either count/det or counts/sec/det, where a det is 0.4 x 0.4 = 0.16 sq cm.
Full-time range; 1 s binning
Other quick-look light curves:
- 64 ms binning (zoomed)
- 16 ms binning (zoomed)
- 8 ms binning (zoomed)
- 2 ms binning (zoomed)
- SN=5 or 10 s binning (full-time range)
- Raw light curve
Spectra
- 64 ms binning (zoomed)
- 16 ms binning (zoomed)
- 8 ms binning (zoomed)
- 2 ms binning (zoomed)
- SN=5 or 10 s binning (full-time range)
- Raw light curve
Spectra
Notes:
- 1) The fitting includes the systematic errors.
- 2) When the burst includes telescope slew time periods, the fitting uses an average response file made from multiple 5-s response files through out the slew time plus single time preiod for the non-slew times, and weighted by the total counts in the corresponding time period using addrmf. An average response file is needed becuase a spectral fit using the pre-slew DRM will introduce some errors in both a spectral shape and a normalization if the PHA file contains a lot of the slew/post-slew time interval.
- 3) For fits to more complicated models (e.g. a power-law over a cutoff power-law), the BAT team has decided to require a chi-square improvement of more than 6 for each extra dof.
Time averaged spectrum fit using the average DRM
Power-law model
Time interval is from  -20.152 sec. to  108.068 sec.

Spectral model in power-law:
------------------------------------------------------------
Parameters  : value       lower 90%   higher 90%
Photon index: -1.51393     ( -0.139084   0.137736 )
Norm@50keV  : 1.24130E-03    ( -0.000102755   0.000102267 )
------------------------------------------------------------
#Fit statistic : Chi-Squared =          57.19 using 59 PHA bins.
# Reduced chi-squared =          1.003 for     57 degrees of freedom
# Null hypothesis probability =   4.680098e-01

Photon flux (15-150 keV)    in 128.2 sec: 0.155554 ( -0.012577  0.012594 ) ph/cm2/s
Energy fluence (15-150 keV)             : 1.50647e-06 ( -1.36032e-07  1.37671e-07 ) ergs/cm2
Cutoff power-law model
Time interval is from  -20.152 sec. to  108.068 sec.
Spectral model in the cutoff power-law:
------------------------------------------------------------
Parameters  : value       lower 90%   higher 90%
Photon index: -0.392274     ( -0.681208   0.814045 )
Epeak [keV] : 68.5429      ( -11.9474 34.3716 )
Norm@50keV  : 4.71599E-03    ( -0.00258556   0.00754538 )
------------------------------------------------------------
#Fit statistic : Chi-Squared =          48.52 using 59 PHA bins.
# Reduced chi-squared =         0.8664 for     56 degrees of freedom
# Null hypothesis probability =   7.509824e-01

Photon flux (15-150 keV)    in 128.2 sec: 0.147118 ( -0.01355  0.01353 ) ph/cm2/s
Energy fluence (15-150 keV)             : 1.36228e-06 ( -1.54666e-07  1.59908e-07 ) ergs/cm2
1-s peak spectrum fit
Power-law model
Time interval is from   -6.344 sec. to   -5.344 sec.

Spectral model in power-law:
------------------------------------------------------------
Parameters  : value       lower 90%   higher 90%
Photon index: -1.3132     ( -0.422148   0.438344 )
Norm@50keV  : 4.66254E-03    ( -0.00116195   0.0011587 )
------------------------------------------------------------
#Fit statistic : Chi-Squared =          63.83 using 59 PHA bins.
# Reduced chi-squared =          1.120 for     57 degrees of freedom
# Null hypothesis probability =   2.490832e-01

Photon flux (15-150 keV)    in 1 sec: 0.557637 ( -0.140699  0.14126 ) ph/cm2/s
Energy fluence (15-150 keV)             : 4.59335e-08 ( -1.25609e-08  1.28912e-08 ) ergs/cm2
Cutoff power-law model
Time interval is from   -6.344 sec. to   -5.344 sec.
Spectral model in the cutoff power-law:
------------------------------------------------------------
Parameters  : value       lower 90%   higher 90%
Photon index: -0.50842     ( -0.973328   4.63181 )
Epeak [keV] : 85.5886      (   )
Norm@50keV  : 1.26733E-02    (     )
------------------------------------------------------------
#Fit statistic : Chi-Squared =          63.44 using 59 PHA bins.
# Reduced chi-squared =          1.133 for     56 degrees of freedom
# Null hypothesis probability =   2.307825e-01

Photon flux (15-150 keV)    in 1 sec: 0.539226 ( -0.157798  0.149862 ) ph/cm2/s
Energy fluence (15-150 keV)             : 4.18341e-08 ( -1.69879e-08  1.57881e-08 ) ergs/cm2
Time-resolved spectra
Distribution
T90 vs. Hardness ratio plot
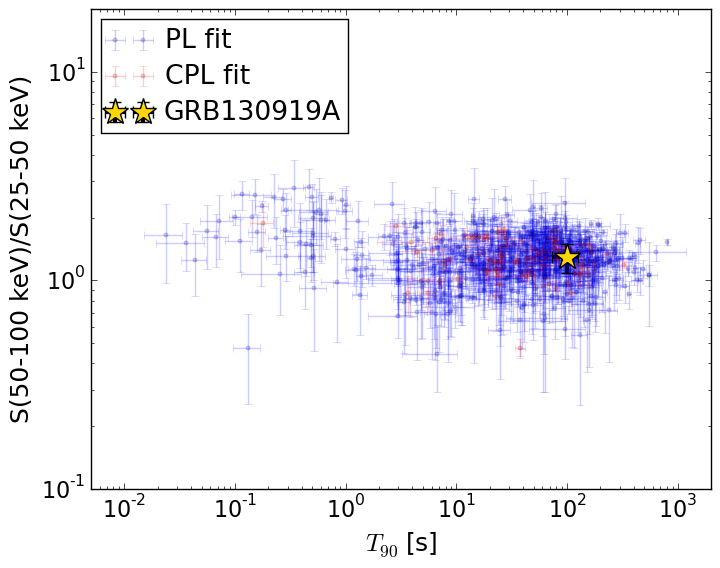
T90                                   = 99.684 sec.
Hardness ratio (energy fluence ratio) = 1.29330216091
S(15-50 keV) vs. S(50-150 keV) plot
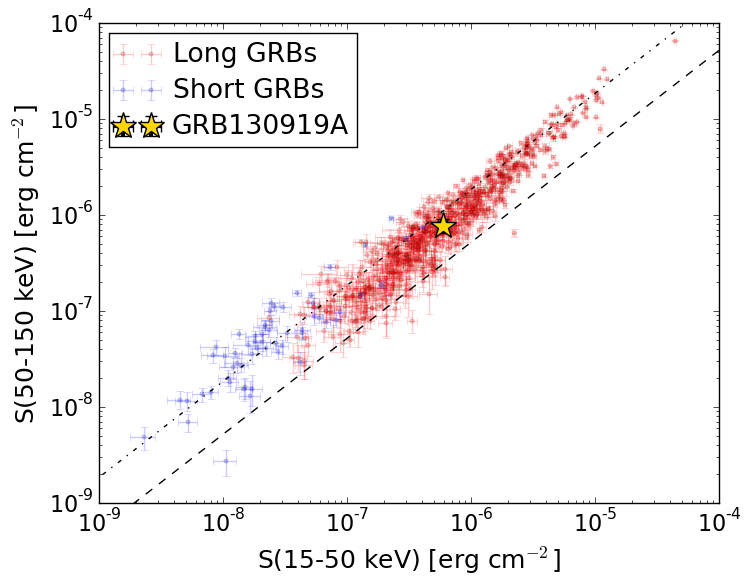
S(15-50 keV)  = 5.899943e-07
S(50-150 keV) = 7.722907e-07
The dash-dotted line and the dashed line traces the fluences calculated from the Band function with Epeak = 15 and 150 keV, respectively. Both lines assume a canonical values of alpha = -1 and beta = -2.5.
Mask shadow pattern
IMX = -4.516322321979809E-02, IMY = 3.389476216050898E-01
Spacecraft aspect plot
Bright source in the pre-burst/pre-slew/post-slew images
Pre-burst image of 15-350 keV band
Time interval of the image:
Pre-slew background subtracted image of 15-350 keV band
Time interval of the image:
-11.699410 108.068000

# RAcent  DECcent POSerr Theta    Phi  PeakCts   SNR AngSep     Name
#  [deg]    [deg]    ['] [deg]  [deg]                   [']
186.5758 -62.6874    9.4  54.4  179.3   0.6001   1.2    5.4	GX 301-2
245.0115 -15.6393    0.4  18.4   71.0   4.1755  29.4    1.9	Sco X-1
255.9531 -37.9712    7.4  34.6  114.4   0.4501   1.6    7.8	4U 1700-377
256.4014 -36.3115   23.2  34.1  111.5  -0.1453  -0.5    6.9	GX 349+2
262.8265 -24.8437    0.0  35.7   89.4   0.5910   1.6   11.6	GX 1+4
262.9191 -33.9532    8.0  38.0  104.1  -0.5720  -1.4    7.9	GX 354-0
207.2806 -10.3542    0.7  18.9  -97.6   2.2522  16.1 ------	UNKNOWN
186.1468  -3.1626    4.6  41.0  -98.0   1.7536   2.5 ------	UNKNOWN
Post-slew image of 15-350 keV band
Time interval of the image:
245.500590 963.024700

# RAcent  DECcent POSerr Theta    Phi  PeakCts   SNR AngSep     Name
#  [deg]    [deg]    ['] [deg]  [deg]                   [']
254.5427  35.4163   38.8  30.8  125.3  -0.1917  -0.3    6.1	Her X-1
270.0039  64.6450    3.7  34.8   67.3   2.6769   3.2 ------	UNKNOWN
249.3149  81.7758    2.2  37.7   37.2   3.8239   5.4 ------	UNKNOWN
219.4395  59.2324    3.3  13.8   37.6   1.3775   3.5 ------	UNKNOWN
206.0229  34.1020    2.4  13.7 -113.8   2.0069   4.9 ------	UNKNOWN
152.3323  58.3089    2.3  39.4  -17.9   2.5641   5.0 ------	UNKNOWN
125.3286  47.2132    2.6  58.6  -22.9  13.1775   4.3 ------	UNKNOWN
147.4179  36.8007    3.6  50.6  -44.6   7.0849   3.2 ------	UNKNOWN