Analysis Summary
Notes:
- 1) No attempt has been made to eliminate the non-significant decimal places.
- 2) This batgrbproduct analysis is done using the HEASARC data.
- 3) This batgrbproduct analysis is using the flight position for the mask-weighting calculation.
======================================================================
BAT GRB EVENT DATA PROCESSING REPORT
Process Script Ver: batgrbproduct v2.46
Process Start Time: Sun May 10 03:54:25 EDT 2015
Host Name: bat1
Current Working Dir: /local/data/bat1/alien/Swift_3rdBATcatalog/event/batevent_reproc/trigger571830
======================================================================
Trigger: 00571830 Segment: 000
BAT Trigger Time: 401775096 [s; MET]
Trigger Stop: 401775160 [s; MET]
UTC: 2013-09-25T04:11:24.926960 [includes UTCF correction]
Where From?: TDRSS position message
BAT
RA: 41.1834870565618 Dec: -26.1344446281341 [deg; J2000]
Catalogged Source?: NO
Point Source?: YES
GRB Indicated?: YES [ by BAT flight software ]
Image S/N Ratio: 23.15
Image Trigger?: YES
Rate S/N Ratio: 0 [ if not an image trigger ]
Image S/N Ratio: 23.15
Analysis Position: [ source = BAT ]
RA: 41.1834870565618 Dec: -26.1344446281341 [deg; J2000]
Refined Position: [ source = BAT pre-slew burst ]
RA: 41.1851660595169 Dec: -26.1463580863318 [deg; J2000]
{ 02h 44m 44.4s , -26d 08' 46.9" }
+/- 0.987240952572084 [arcmin] (estimated 90% radius based on SNR)
+/- 0.291158824595208 [arcmin] (formal 1-sigma fit error)
SNR: 30.9802765937543
Angular difference between the analysis and refined position is 0.720506 arcmin
Partial Coding Fraction: 0.09960938 [ including projection effects ]
Duration
T90: 160.29599994421 +/- 3.39040768844924
Measured from: -48.8920000195503
to: 111.40399992466 [s; relative to TRIGTIME]
T50: 83.3959999084473 +/- 2.23230823015722
Measured from: -28.5799999833107
to: 54.8159999251366 [s; relative to TRIGTIME]
Fluence
Peak Flux (peak 1 second)
Measured from: -35.6359999775887
to: -34.6359999775887 [s; relative to TRIGTIME]
Total Fluence
Measured from: -59.0320000052452
to: 903.952000021935 [s; relative to TRIGTIME]
Band 1 Band 2 Band 3 Band 4
15-25 25-50 50-100 100-350 keV
Total 25.746554 27.571896 15.137053 2.878093
0.281395 0.292809 0.246229 0.193475 [error]
Peak 0.261260 0.274742 0.212050 0.056038
0.021574 0.022620 0.019639 0.013822 [error]
[ fluence units of on-axis counts / fully illuminated detector ]
======================================================================
====== Table of the duration information =============================
Value tstart tstop
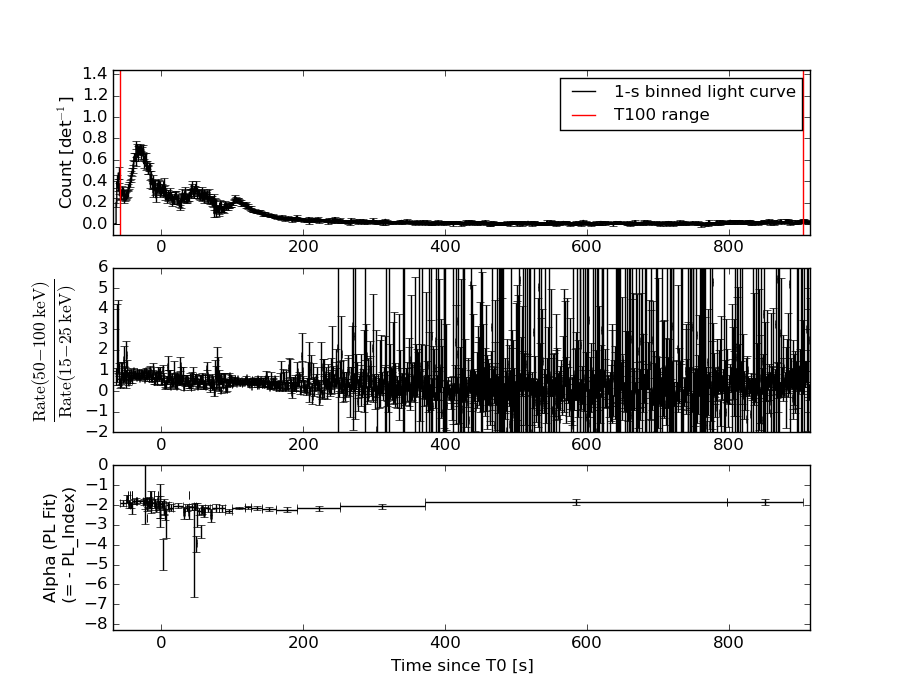
T100 962.984 -59.032 903.952
T90 160.296 -48.892 111.404
T50 83.396 -28.580 54.816
Peak 1.000 -35.636 -34.636
====== Spectral Analysis Summary =====================================
Model : spectral model: simple power-law (PL) and cutoff power-law (CPL)
Ph_index : photon index: E^{Ph_index}
Ph_90err : 90% error of the photon index
Epeak : Epeak in keV
Epeak_90err: 90% error of Epeak
Norm : normalization at 50 keV in both the PL model and CPL model
Nomr_90err : 90% error of the normalization
chi2 : Chi-Squared
dof : degree of freedo
=== Time-averaged spectral analysis ===
(Best model with acceptable fit: PL)
Model Ph_index Ph_90err_low Ph_90err_hi Epeak Epeak_90err_low Epeak_90err_hi Norm Nomr_90err_low Norm_90err_hi chi2 dof
PL -2.053 -0.038 0.038 - - - 4.52e-03 -8.48e-05 8.48e-05 43.930 57
CPL -1.847 -0.152 0.157 39.703 -35.075 10.557 5.63e-03 -8.18e-04 9.95e-04 38.500 56
=== 1-s peak spectral analysis ===
(Best model with acceptable fit: PL)
Model Ph_index Ph_90err_low Ph_90err_hi Epeak Epeak_90err_low Epeak_90err_hi Norm Nomr_90err_low Norm_90err_hi chi2 dof
PL -1.909 -0.158 0.152 - - - 5.09e-02 -4.86e-03 4.78e-03 49.970 57
CPL -1.766 -0.529 0.594 80.605 N/A N/A 6.03e-02 N/A N/A 49.770 56
=== Fluence/Peak Flux Summary ===
Model Band1 Band2 Band3 Band4 Band5 Total
15-25 25-50 50-100 100-350 15-150 15-350 keV
Fluence PL 9.38e-06 1.23e-05 1.19e-05 2.04e-05 4.03e-05 5.40e-05 erg/cm2
90%_error_low -3.56e-07 -2.64e-07 -2.89e-07 -1.11e-06 -7.48e-07 -1.28e-06 erg/cm2
90%_error_hi 3.62e-07 2.63e-07 2.89e-07 1.16e-06 7.48e-07 1.30e-06 erg/cm2
Peak flux PL 3.11e+00 2.46e+00 1.31e+00 1.01e+00 7.33e+00 7.89e+00 ph/cm2/s
90%_error_low -4.11e-01 -2.10e-01 -1.63e-01 -2.31e-01 -6.35e-01 -6.61e-01 ph/cm2/s
90%_error_hi 4.27e-01 2.09e-01 1.62e-01 2.66e-01 6.37e-01 6.61e-01 ph/cm2/s
Fluence CPL N/A N/A N/A N/A N/A N/A erg/cm2
90%_error_low -3.56e-07 -2.64e-07 -2.89e-07 -1.11e-06 -7.48e-07 -1.28e-06 erg/cm2
90%_error_hi 3.62e-07 2.63e-07 2.89e-07 1.16e-06 7.48e-07 1.30e-06 erg/cm2
Peak flux CPL 3.03e+00 2.49e+00 1.33e+00 8.61e-01 7.29e+00 7.71e+00 ph/cm2/s
90%_error_low -4.96e-01 -2.37e-01 -2.39e-01 -4.03e-01 -6.60e-01 -8.23e-01 ph/cm2/s
90%_error_hi 5.00e-01 2.51e-01 1.79e-01 2.18e-01 6.60e-01 8.50e-01 ph/cm2/s
======================================================================
Image
Pre-slew 15.0-350.0 keV image (Event data)
#   RAcent    DECcent   POSerr    Theta     Phi              Peak Cts       SNR   Name
   41.1852   -26.1464   0.0062    40.7866   123.1865        24.7388090     30.980 TRIG_00571830

Foreground time interval of the image:
-13.299  72.701 (delta_t =  86.000 [sec])
Background time interval of the image:
Light Curves
Note: The mask-weighted lightcurves have units of either count/det or counts/sec/det, where a det is 0.4 x 0.4 = 0.16 sq cm.
Full-time range; 1 s binning
Other quick-look light curves:
- 64 ms binning (zoomed)
- 16 ms binning (zoomed)
- 8 ms binning (zoomed)
- 2 ms binning (zoomed)
- SN=5 or 10 s binning (full-time range)
- Raw light curve
Spectra
- 64 ms binning (zoomed)
- 16 ms binning (zoomed)
- 8 ms binning (zoomed)
- 2 ms binning (zoomed)
- SN=5 or 10 s binning (full-time range)
- Raw light curve
Spectra
Notes:
- 1) The fitting includes the systematic errors.
- 2) When the burst includes telescope slew time periods, the fitting uses an average response file made from multiple 5-s response files through out the slew time plus single time preiod for the non-slew times, and weighted by the total counts in the corresponding time period using addrmf. An average response file is needed becuase a spectral fit using the pre-slew DRM will introduce some errors in both a spectral shape and a normalization if the PHA file contains a lot of the slew/post-slew time interval.
- 3) For fits to more complicated models (e.g. a power-law over a cutoff power-law), the BAT team has decided to require a chi-square improvement of more than 6 for each extra dof.
Time averaged spectrum fit using the average DRM
Power-law model
Time interval is from  -59.032 sec. to  903.952 sec.

Spectral model in power-law:
------------------------------------------------------------
Parameters  : value       lower 90%   higher 90%
Photon index: -2.05332     ( -0.0380728   0.0379478 )
Norm@50keV  : 4.52397E-03    ( -8.47953e-05   8.47627e-05 )
------------------------------------------------------------
#Fit statistic : Chi-Squared =          43.93 using 59 PHA bins.
# Reduced chi-squared =         0.7708 for     57 degrees of freedom
# Null hypothesis probability =   8.976539e-01

Photon flux (15-150 keV)    in 963 sec: 0.695832 ( -0.016775  0.016895 ) ph/cm2/s
Energy fluence (15-150 keV)             : 4.03215e-05 ( -7.47818e-07  7.4772e-07 ) ergs/cm2
Cutoff power-law model
Time interval is from  -59.032 sec. to  903.952 sec.
Spectral model in the cutoff power-law:
------------------------------------------------------------
Parameters  : value       lower 90%   higher 90%
Photon index: -1.84657     ( -0.151857   0.157038 )
Epeak [keV] : 39.7030      ( -35.0752 10.5571 )
Norm@50keV  : 5.63430E-03    ( -0.000817796   0.000995475 )
------------------------------------------------------------
#Fit statistic : Chi-Squared =          38.50 using 59 PHA bins.
# Reduced chi-squared =         0.6875 for     56 degrees of freedom
# Null hypothesis probability =   9.642015e-01

Photon flux (15-150 keV)    in 963 sec: 0.679406 ( -0.020165  0.020384 ) ph/cm2/s
Energy fluence (15-150 keV)             : 0 ( 0  0 ) ergs/cm2
1-s peak spectrum fit
Power-law model
Time interval is from  -35.636 sec. to  -34.636 sec.

Spectral model in power-law:
------------------------------------------------------------
Parameters  : value       lower 90%   higher 90%
Photon index: -1.90913     ( -0.158267   0.152048 )
Norm@50keV  : 5.09016E-02    ( -0.00486028   0.00477799 )
------------------------------------------------------------
#Fit statistic : Chi-Squared =          49.97 using 59 PHA bins.
# Reduced chi-squared =         0.8766 for     57 degrees of freedom
# Null hypothesis probability =   7.339862e-01

Photon flux (15-150 keV)    in 1 sec: 7.33383 ( -0.63536  0.637 ) ph/cm2/s
Energy fluence (15-150 keV)             : 4.68091e-07 ( -4.36376e-08  4.39798e-08 ) ergs/cm2
Cutoff power-law model
Time interval is from  -35.636 sec. to  -34.636 sec.
Spectral model in the cutoff power-law:
------------------------------------------------------------
Parameters  : value       lower 90%   higher 90%
Photon index: -1.76648     ( -0.529418   0.593997 )
Epeak [keV] : 80.6051      (   )
Norm@50keV  : 6.03154E-02    (     )
------------------------------------------------------------
#Fit statistic : Chi-Squared =          49.77 using 59 PHA bins.
# Reduced chi-squared =         0.8887 for     56 degrees of freedom
# Null hypothesis probability =   7.084519e-01

Photon flux (15-150 keV)    in 1 sec: 7.28626 ( -0.66031  0.66007 ) ph/cm2/s
Energy fluence (15-150 keV)             : 0 ( 0  0 ) ergs/cm2
Time-resolved spectra
Distribution
T90 vs. Hardness ratio plot
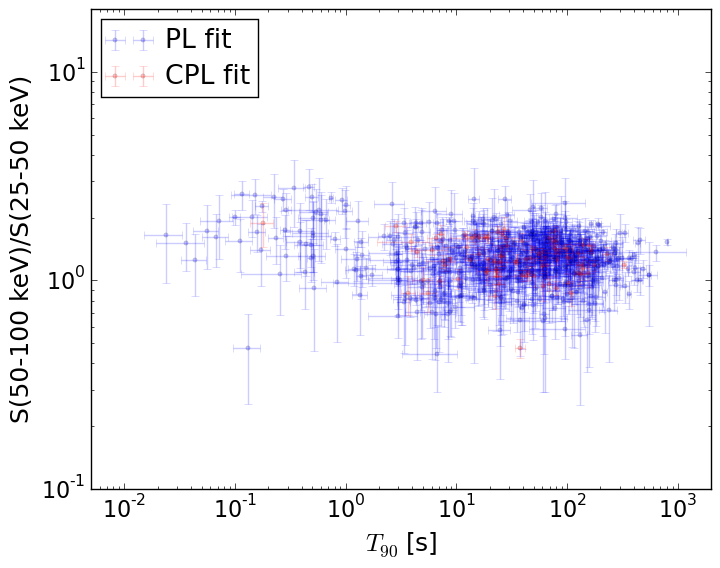
T90                                   = N/A sec.
Hardness ratio (energy fluence ratio) = N/A
S(15-50 keV) vs. S(50-150 keV) plot
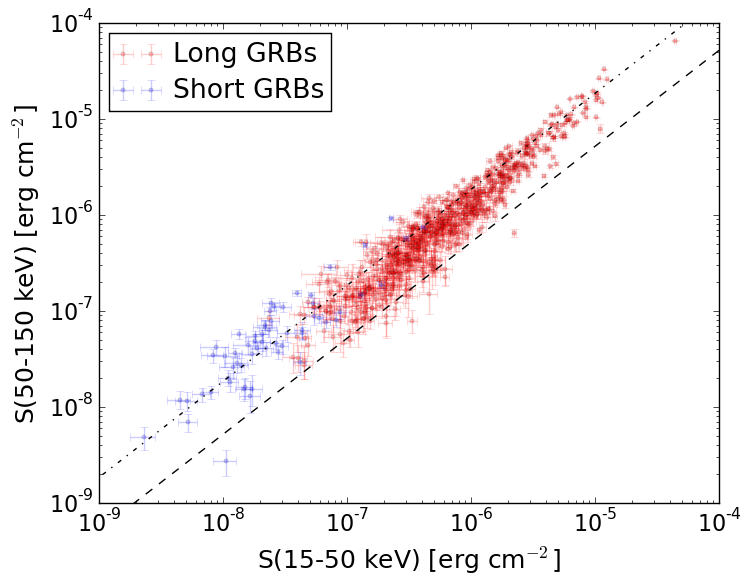
S(15-50 keV)  = N/A
S(50-150 keV) = N/A
The dash-dotted line and the dashed line traces the fluences calculated from the Band function with Epeak = 15 and 150 keV, respectively. Both lines assume a canonical values of alpha = -1 and beta = -2.5.
Mask shadow pattern
IMX = -4.722510683243020E-01, IMY = -7.220460645994012E-01
Spacecraft aspect plot
Bright source in the pre-burst/pre-slew/post-slew images
Pre-burst image of 15-350 keV band
Time interval of the image:
Pre-slew background subtracted image of 15-350 keV band
Time interval of the image:
-13.299400 72.700600

# RAcent  DECcent POSerr Theta    Phi  PeakCts   SNR AngSep     Name
#  [deg]    [deg]    ['] [deg]  [deg]                   [']
 41.1852 -26.1464    0.4  40.8  123.2  24.7382  31.0 ------	UNKNOWN
317.0833 -57.7250    2.3  39.9   10.9   1.0885   4.9 ------	UNKNOWN
 98.8426 -63.7567    2.7  20.4 -120.1   0.4426   4.3 ------	UNKNOWN
230.9158 -62.7054    2.9  50.7  -44.5   2.2333   4.0 ------	UNKNOWN
146.6582 -58.1969    2.7  41.1  -98.1   2.5133   4.3 ------	UNKNOWN
124.9709 -40.2923    2.6  48.0 -129.1   2.1125   4.5 ------	UNKNOWN
Post-slew image of 15-350 keV band
Time interval of the image:
136.100600 963.032900

# RAcent  DECcent POSerr Theta    Phi  PeakCts   SNR AngSep     Name
#  [deg]    [deg]    ['] [deg]  [deg]                   [']
 41.1782 -26.1471    0.3   0.0   98.6  16.0190  37.1 ------	UNKNOWN
 57.6093   1.8315    2.4  32.2 -177.2   2.1914   4.7 ------	UNKNOWN
 15.7950 -56.0738    3.3  35.1   -4.6   1.8538   3.5 ------	UNKNOWN