Analysis Summary
Notes:
- 1) No attempt has been made to eliminate the non-significant decimal places.
- 2) This batgrbproduct analysis is done using the HEASARC data.
- 3) This batgrbproduct analysis is using the flight position for the mask-weighting calculation.
======================================================================
BAT GRB EVENT DATA PROCESSING REPORT
Process Script Ver: batgrbproduct v2.46
Process Start Time: Sat Jan 11 23:01:18 EST 2014
Host Name: batevent1
Current Working Dir: /local/data/batevent/batevent_reproc/trigger572308
======================================================================
Trigger: 00572308 Segment: 000
BAT Trigger Time: 402140204.224 [s; MET]
Trigger Stop: 402140205.248 [s; MET]
UTC: 2013-09-29T09:36:33.134240 [includes UTCF correction]
Where From?: TDRSS position message
BAT
RA: 135.069036940592 Dec: -47.5650235881594 [deg; J2000]
Catalogged Source?: NO
Point Source?: YES
GRB Indicated?: YES [ by BAT flight software ]
Image S/N Ratio: 7.91
Image Trigger?: NO
Rate S/N Ratio: 11.916375287813 [ if not an image trigger ]
Image S/N Ratio: 7.91
Analysis Position: [ source = BAT ]
RA: 135.069036940592 Dec: -47.5650235881594 [deg; J2000]
Refined Position: [ source = BAT pre-slew burst ]
RA: 135.024383867106 Dec: -47.5563355147385 [deg; J2000]
{ 09h 00m 05.9s , -47d 33' 22.8" }
+/- 1.64196610130637 [arcmin] (estimated 90% radius based on SNR)
+/- 0.723140109240809 [arcmin] (formal 1-sigma fit error)
SNR: 14.9780493096766
Angular difference between the analysis and refined position is 1.881589 arcmin
Partial Coding Fraction: 0.4453125 [ including projection effects ]
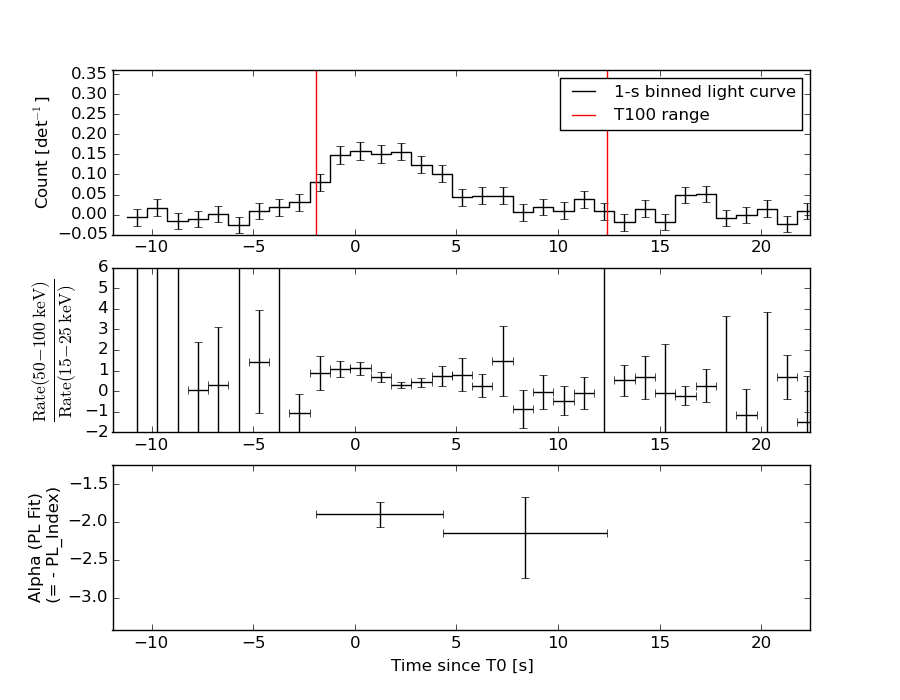
Duration
T90: 12.2400000095367 +/- 4.05928065016228
Measured from: -1.47999995946884
to: 10.7600000500679 [s; relative to TRIGTIME]
T50: 4.04800003767014 +/- 1.11670942199236
Measured from: 0.136000037193298
to: 4.18400007486343 [s; relative to TRIGTIME]
Fluence
Peak Flux (peak 1 second)
Measured from: 1.32400000095367
to: 2.32400000095367 [s; relative to TRIGTIME]
Total Fluence
Measured from: -1.92799997329712
to: 12.4080000519753 [s; relative to TRIGTIME]
Band 1 Band 2 Band 3 Band 4
15-25 25-50 50-100 100-350 keV
Total 0.388187 0.528107 0.258728 -0.022028
0.037468 0.041196 0.039912 0.042177 [error]
Peak 0.074948 0.062017 0.037513 0.013495
0.010389 0.011578 0.011049 0.010855 [error]
[ fluence units of on-axis counts / fully illuminated detector ]
======================================================================
====== Table of the duration information =============================
Value tstart tstop
T100 14.336 -1.928 12.408
T90 12.240 -1.480 10.760
T50 4.048 0.136 4.184
Peak 1.000 1.324 2.324
====== Spectral Analysis Summary =====================================
Model : spectral model: simple power-law (PL) and cutoff power-law (CPL)
Ph_index : photon index: E^{Ph_index}
Ph_90err : 90% error of the photon index
Epeak : Epeak in keV
Epeak_90err: 90% error of Epeak
Norm : normalization at 50 keV in both the PL model and CPL model
Nomr_90err : 90% error of the normalization
chi2 : Chi-Squared
dof : degree of freedo
=== Time-averaged spectral analysis ===
(Best model with acceptable fit: PL)
Model Ph_index Ph_90err_low Ph_90err_hi Epeak Epeak_90err_low Epeak_90err_hi Norm Nomr_90err_low Norm_90err_hi chi2 dof
PL -1.965 -0.190 0.180 - - - 5.36e-03 -6.76e-04 6.62e-04 51.640 57
CPL -0.968 -0.779 0.950 43.847 -11.331 17.937 1.98e-02 -1.25e-02 4.94e-02 46.630 56
=== 1-s peak spectral analysis ===
(Best model with acceptable fit: N/A)
Model Ph_index Ph_90err_low Ph_90err_hi Epeak Epeak_90err_low Epeak_90err_hi Norm Nomr_90err_low Norm_90err_hi chi2 dof
PL -2.059 -0.392 0.347 - - - 1.10e-02 -2.84e-03 2.70e-03 76.400 57
CPL -1.999 -0.237 0.998 4.907 N/A N/A 1.14e-02 N/A N/A 76.470 56
=== Fluence/Peak Flux Summary ===
Model Band1 Band2 Band3 Band4 Band5 Total
15-25 25-50 50-100 100-350 15-150 15-350 keV
Fluence PL 1.52e-07 2.11e-07 2.16e-07 4.04e-07 7.08e-07 9.83e-07 erg/cm2
90%_error_low -2.08e-08 -2.09e-08 -3.67e-08 -1.21e-07 -8.44e-08 -1.65e-07 erg/cm2
90%_error_hi 2.13e-08 2.09e-08 3.74e-08 1.51e-07 8.62e-08 1.89e-07 erg/cm2
Peak flux PL 7.73e-01 5.60e-01 2.69e-01 1.82e-01 1.69e+00 1.78e+00 ph/cm2/s
90%_error_low -1.86e-01 -1.02e-01 -8.90e-02 -9.40e-02 -2.98e-01 -3.23e-01 ph/cm2/s
90%_error_hi 1.92e-01 1.01e-01 9.29e-02 1.41e-01 2.98e-01 3.26e-01 ph/cm2/s
Fluence CPL 1.38e-07 2.36e-07 2.08e-07 9.45e-08 6.47e-07 6.76e-07 erg/cm2
90%_error_low -2.41e-08 -2.83e-08 -4.51e-08 -6.35e-08 -8.92e-08 -1.12e-07 erg/cm2
90%_error_hi 2.42e-08 2.92e-08 4.32e-08 1.84e-07 9.54e-08 2.01e-07 erg/cm2
Peak flux CPL 7.81e-01 5.54e-01 2.69e-01 N/A 1.66e+00 1.79e+00 ph/cm2/s
90%_error_low -2.29e-01 N/A N/A -9.40e-02 N/A N/A ph/cm2/s
90%_error_hi 1.86e-01 N/A N/A 1.41e-01 N/A N/A ph/cm2/s
======================================================================
Image
Pre-slew 15.0-350.0 keV image (Event data)
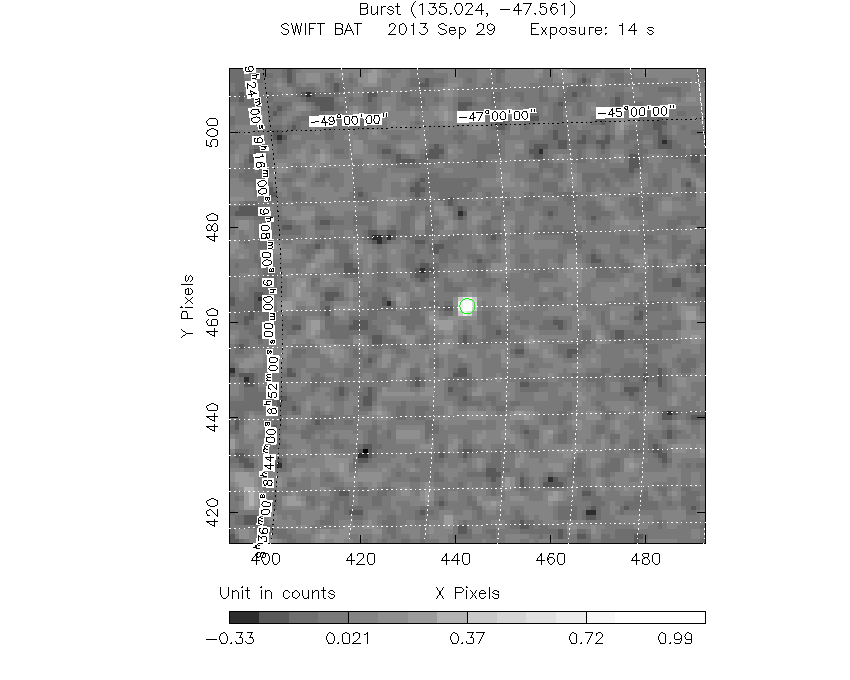
#   RAcent    DECcent   POSerr    Theta     Phi              Peak Cts       SNR   Name
  135.0244   -47.5563   0.0128    42.5817     1.7264         1.2461214     14.978 TRIG_00572308

Foreground time interval of the image:
 -1.928  12.408 (delta_t =  14.336 [sec])
Background time interval of the image:
-119.224  -1.928 (delta_t = 117.296 [sec])
Light Curves
Note: The mask-weighted lightcurves have units of either count/det or counts/sec/det, where a det is 0.4 x 0.4 = 0.16 sq cm.
Full-time range; 1 s binning
Other quick-look light curves:
- 64 ms binning (zoomed)
- 16 ms binning (zoomed)
- 8 ms binning (zoomed)
- 2 ms binning (zoomed)
- SN=5 or 10 s binning (full-time range)
- Raw light curve
Spectra
- 64 ms binning (zoomed)
- 16 ms binning (zoomed)
- 8 ms binning (zoomed)
- 2 ms binning (zoomed)
- SN=5 or 10 s binning (full-time range)
- Raw light curve
Spectra
Notes:
- 1) The fitting includes the systematic errors.
- 2) When the burst includes telescope slew time periods, the fitting uses an average response file made from multiple 5-s response files through out the slew time plus single time preiod for the non-slew times, and weighted by the total counts in the corresponding time period using addrmf. An average response file is needed becuase a spectral fit using the pre-slew DRM will introduce some errors in both a spectral shape and a normalization if the PHA file contains a lot of the slew/post-slew time interval.
- 3) For fits to more complicated models (e.g. a power-law over a cutoff power-law), the BAT team has decided to require a chi-square improvement of more than 6 for each extra dof.
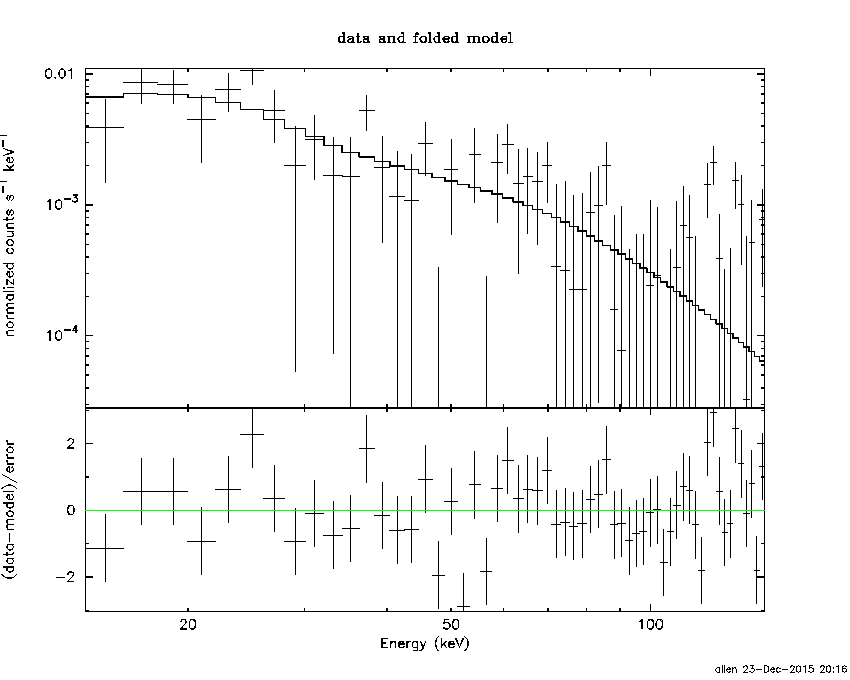
Time averaged spectrum fit using the average DRM
Power-law model
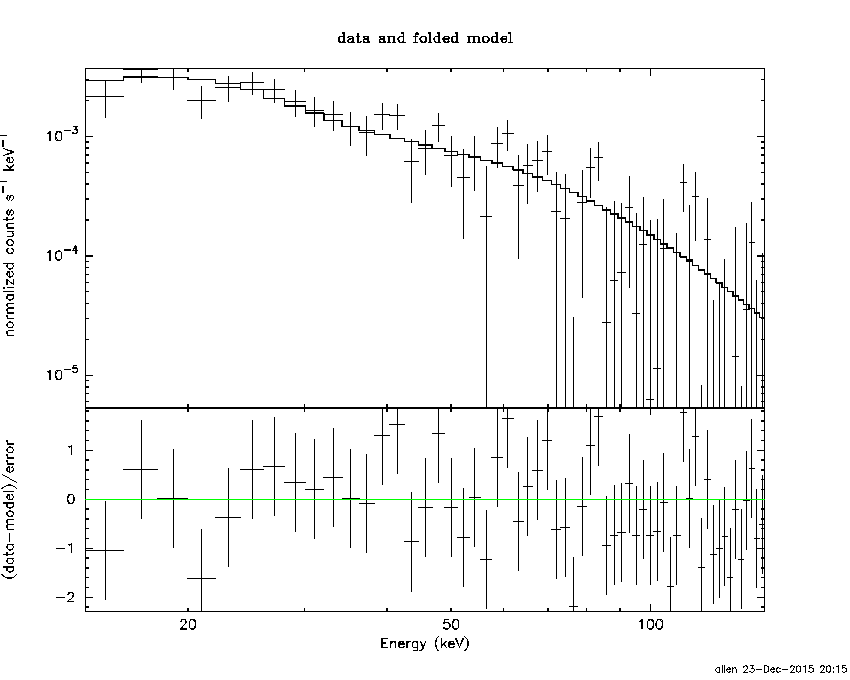
Time interval is from   -1.928 sec. to   12.408 sec.

Spectral model in power-law:
------------------------------------------------------------
Parameters  : value       lower 90%   higher 90%
Photon index: -1.9646     ( -0.190435   0.179694 )
Norm@50keV  : 5.35846E-03    ( -0.000675567   0.000661932 )
------------------------------------------------------------
#Fit statistic : Chi-Squared =          51.64 using 59 PHA bins.
# Reduced chi-squared =         0.9059 for     57 degrees of freedom
# Null hypothesis probability =   6.758036e-01

Photon flux (15-150 keV)    in 14.34 sec: 0.791020 ( -0.07782  0.077833 ) ph/cm2/s
Energy fluence (15-150 keV)             : 7.07619e-07 ( -8.43876e-08  8.62324e-08 ) ergs/cm2
Cutoff power-law model
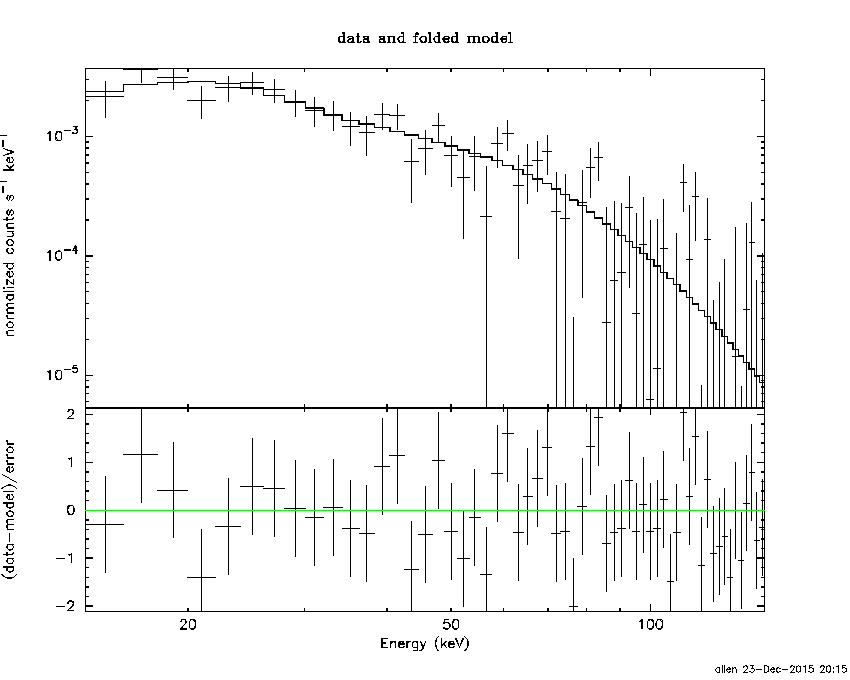
Time interval is from   -1.928 sec. to   12.408 sec.
Spectral model in the cutoff power-law:
------------------------------------------------------------
Parameters  : value       lower 90%   higher 90%
Photon index: -0.968204     ( -0.778717   0.950282 )
Epeak [keV] : 43.8469      ( -11.3306 17.9375 )
Norm@50keV  : 1.97697E-02    ( -0.0124904   0.0494408 )
------------------------------------------------------------
#Fit statistic : Chi-Squared =          46.63 using 59 PHA bins.
# Reduced chi-squared =         0.8327 for     56 degrees of freedom
# Null hypothesis probability =   8.095638e-01

Photon flux (15-150 keV)    in 14.34 sec: 0.761208 ( -0.080586  0.080798 ) ph/cm2/s
Energy fluence (15-150 keV)             : 6.46918e-07 ( -8.92066e-08  9.53819e-08 ) ergs/cm2
1-s peak spectrum fit
Power-law model
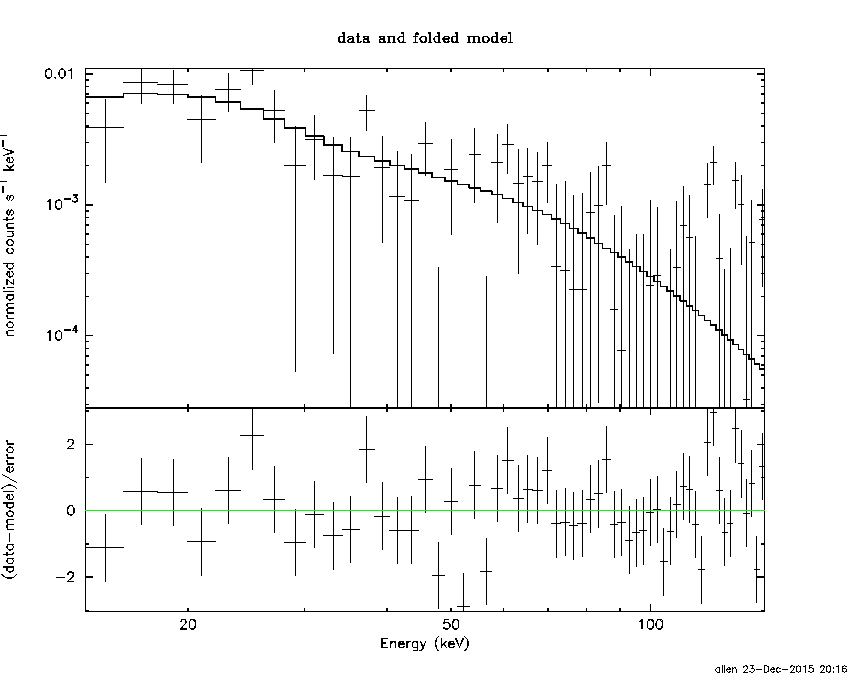
Time interval is from    1.324 sec. to    2.324 sec.

Spectral model in power-law:
------------------------------------------------------------
Parameters  : value       lower 90%   higher 90%
Photon index: -2.05878     ( -0.392056   0.347403 )
Norm@50keV  : 1.09533E-02    ( -0.00284461   0.00270444 )
------------------------------------------------------------
#Fit statistic : Chi-Squared =          76.40 using 59 PHA bins.
# Reduced chi-squared =          1.340 for     57 degrees of freedom
# Null hypothesis probability =   4.413103e-02

Photon flux (15-150 keV)    in 1 sec: 1.68915 ( -0.29768  0.29771 ) ph/cm2/s
Energy fluence (15-150 keV)             : 1.01419e-07 ( -2.30508e-08  2.41724e-08 ) ergs/cm2
Cutoff power-law model
Time interval is from    1.324 sec. to    2.324 sec.
Spectral model in the cutoff power-law:
------------------------------------------------------------
Parameters  : value       lower 90%   higher 90%
Photon index: -2.12806     ( -0.108793   1.12594 )
Epeak [keV] : 66.5778      (   )
Norm@50keV  : 9.85687E-03    (     )
------------------------------------------------------------
#Fit statistic : Chi-Squared =          76.28 using 59 PHA bins.
# Reduced chi-squared =          1.362 for     56 degrees of freedom
# Null hypothesis probability =   3.708749e-02

Photon flux (15-150 keV)    in 1 sec: 1.66472 (    ) ph/cm2/s
Energy fluence (15-150 keV)             : 0 ( 0  0 ) ergs/cm2
Time-resolved spectra
Distribution
T90 vs. Hardness ratio plot
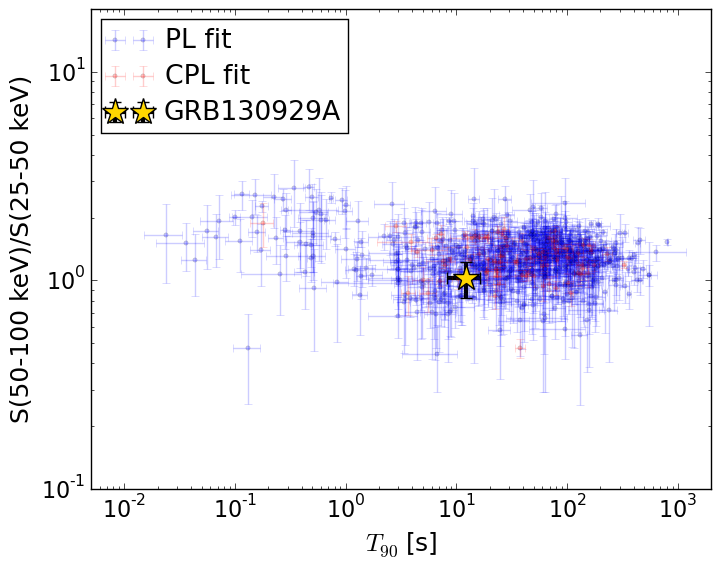
T90                                   = 12.24 sec.
Hardness ratio (energy fluence ratio) = 1.02489680701
S(15-50 keV) vs. S(50-150 keV) plot

S(15-50 keV)  = 3.628004e-07
S(50-150 keV) = 3.448205e-07
The dash-dotted line and the dashed line traces the fluences calculated from the Band function with Epeak = 15 and 150 keV, respectively. Both lines assume a canonical values of alpha = -1 and beta = -2.5.
Mask shadow pattern
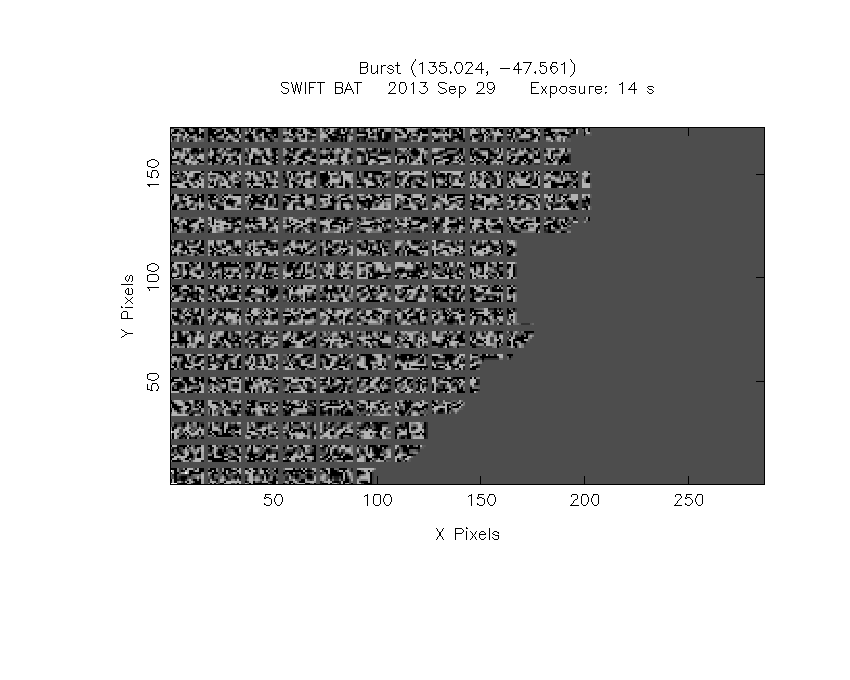
IMX = 9.185392598813594E-01, IMY = -2.768482040946642E-02
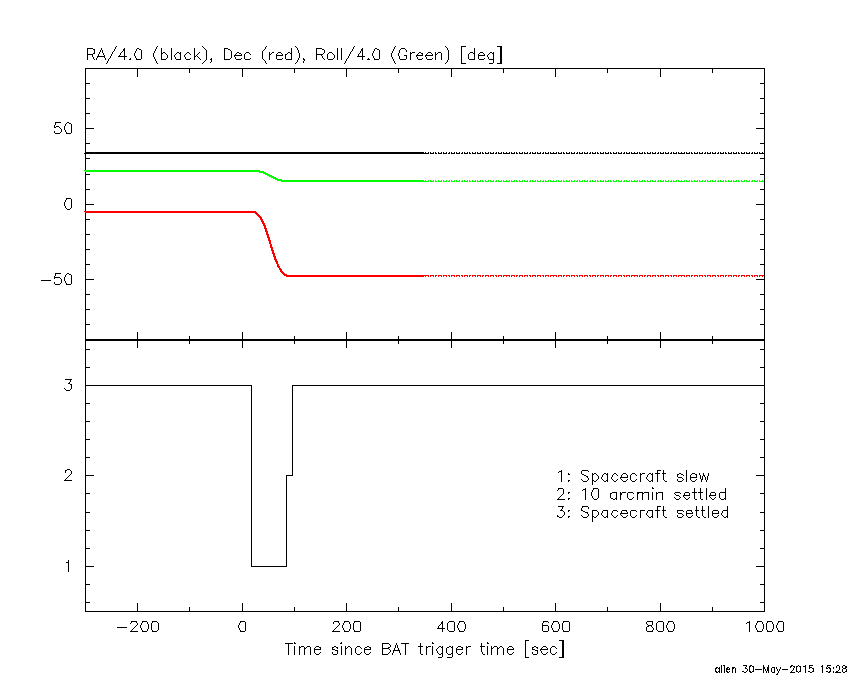
Spacecraft aspect plot
Bright source in the pre-burst/pre-slew/post-slew images
Pre-burst image of 15-350 keV band
Time interval of the image:
-119.224000 -1.928000

# RAcent  DECcent POSerr Theta    Phi  PeakCts   SNR AngSep     Name
#  [deg]    [deg]    ['] [deg]  [deg]                   [']
135.4880 -40.5509    1.9  35.6    1.3   1.2795   6.1    1.9	Vela X-1
108.4441 -25.5352    3.3  33.1   50.0   0.9178   3.5 ------	UNKNOWN
139.4625  51.8505    2.7  56.9 -175.8   3.6857   4.2 ------	UNKNOWN
167.7385 -51.3737    2.4  53.6  -23.2   2.2314   4.9 ------	UNKNOWN
176.0594 -23.8025    2.6  43.4  -58.9   2.2979   4.4 ------	UNKNOWN
Pre-slew background subtracted image of 15-350 keV band
Time interval of the image:
-1.928000 12.408000

# RAcent  DECcent POSerr Theta    Phi  PeakCts   SNR AngSep     Name
#  [deg]    [deg]    ['] [deg]  [deg]                   [']
135.6875 -40.5099    5.2  35.5    1.0   0.1502   2.2    7.7	Vela X-1
 98.1733 -31.0731    2.1  43.6   50.0   1.1027   5.5 ------	UNKNOWN
135.0243 -47.5563    0.8  42.6    1.7   1.2462  15.0 ------	UNKNOWN
159.5894  45.0508    2.3  54.5 -157.9   0.8349   5.1 ------	UNKNOWN
Post-slew image of 15-350 keV band
Time interval of the image:
85.076600 962.851800

# RAcent  DECcent POSerr Theta    Phi  PeakCts   SNR AngSep     Name
#  [deg]    [deg]    ['] [deg]  [deg]                   [']
135.5137 -40.5664    0.7   7.0 -147.9   9.2105  17.3    1.0	Vela X-1
170.3609 -60.6703    3.2  24.0  -14.4   2.1024   3.5    3.1	Cen X-3
186.6389 -62.7529    0.8  32.0  -13.0   9.8017  15.2    1.2	GX 301-2
 88.5375 -63.4385    3.1  29.8   70.4   3.8067   3.8 ------	UNKNOWN
183.8679 -73.8103    2.1  33.6    7.3   3.4426   5.5 ------	UNKNOWN
205.1560 -37.5882    3.4  50.7  -44.5  11.0295   4.0 ------	UNKNOWN
204.8634 -37.4823    5.3  50.6  -44.8   8.4985   3.0 ------	UNKNOWN