Analysis Summary
Notes:
- 1) No attempt has been made to eliminate the non-significant decimal places.
- 2) This batgrbproduct analysis is done using the HEASARC data.
- 3) This batgrbproduct analysis is using the flight position for the mask-weighting calculation.
======================================================================
BAT GRB EVENT DATA PROCESSING REPORT
Process Script Ver: batgrbproduct v2.46
Process Start Time: Sat Jan 11 22:47:52 EST 2014
Host Name: batevent1
Current Working Dir: /local/data/batevent/batevent_reproc/trigger573190
======================================================================
Trigger: 00573190 Segment: 000
BAT Trigger Time: 402615674.8 [s; MET]
Trigger Stop: 402615674.864 [s; MET]
UTC: 2013-10-04T21:41:03.688480 [includes UTCF correction]
Where From?: (*SHORT BURST*) TDRSS scaled map message
BAT
RA: 296.151463967544 Dec: -2.96000761369023 [deg; J2000]
Catalogged Source?: NO
Point Source?: YES
GRB Indicated?: YES [ by BAT flight software ]
Image S/N Ratio: 10.17
Image Trigger?: NO
Rate S/N Ratio: 25.7293606605372 [ if not an image trigger ]
Image S/N Ratio: 10.17
Analysis Position: [ source = BAT ]
RA: 296.151463967544 Dec: -2.96000761369023 [deg; J2000]
Refined Position: [ source = BAT pre-slew burst ]
RA: 296.108143486919 Dec: -2.95169898499796 [deg; J2000]
{ 19h 44m 26.0s , -02d 57' 06.1" }
+/- 1.09377478658263 [arcmin] (estimated 90% radius based on SNR)
+/- 0.397901487930913 [arcmin] (formal 1-sigma fit error)
SNR: 26.7612923824161
Angular difference between the analysis and refined position is 2.643207 arcmin
Partial Coding Fraction: 0.734375 [ including projection effects ]
Duration
T90: 1.53600001335144 +/- 0.326337243913619
Measured from: -0.184000015258789
to: 1.35199999809265 [s; relative to TRIGTIME]
T50: 0.51199996471405 +/- 0.0905096828275688
Measured from: 0.00800001621246338
to: 0.519999980926514 [s; relative to TRIGTIME]
Fluence
Peak Flux (peak 1 second)
Measured from: -0.26800000667572
to: 0.73199999332428 [s; relative to TRIGTIME]
Total Fluence
Measured from: -0.248000025749207
to: 1.80000001192093 [s; relative to TRIGTIME]
Band 1 Band 2 Band 3 Band 4
15-25 25-50 50-100 100-350 keV
Total 0.166058 0.201325 0.110951 0.014493
0.010369 0.010640 0.008919 0.006667 [error]
Peak 0.122672 0.171885 0.099673 0.013350
0.007931 0.008530 0.007006 0.004770 [error]
[ fluence units of on-axis counts / fully illuminated detector ]
======================================================================
====== Table of the duration information =============================
Value tstart tstop
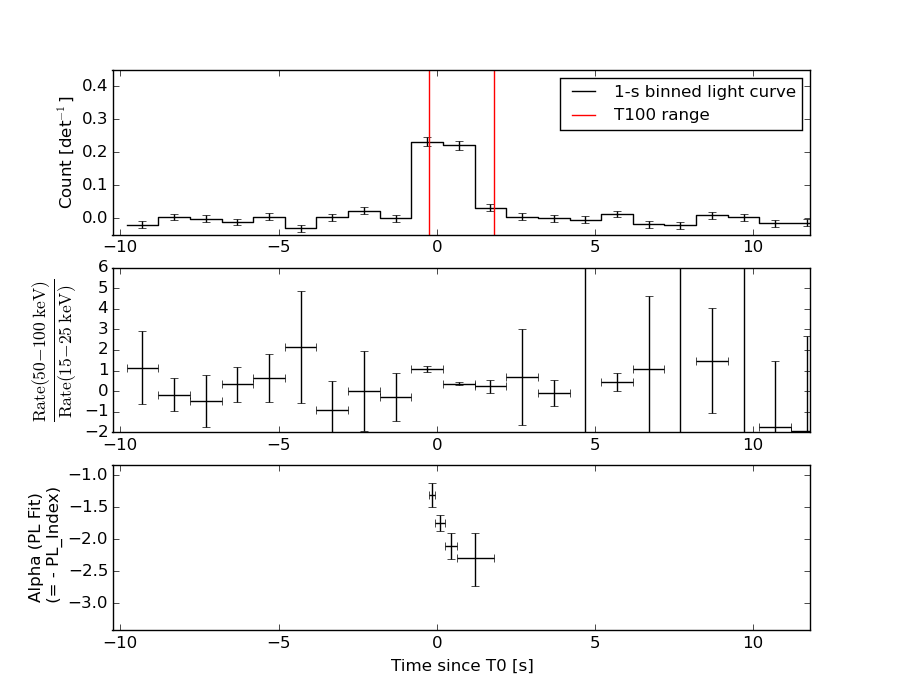
T100 2.048 -0.248 1.800
T90 1.536 -0.184 1.352
T50 0.512 0.008 0.520
Peak 1.000 -0.268 0.732
====== Spectral Analysis Summary =====================================
Model : spectral model: simple power-law (PL) and cutoff power-law (CPL)
Ph_index : photon index: E^{Ph_index}
Ph_90err : 90% error of the photon index
Epeak : Epeak in keV
Epeak_90err: 90% error of Epeak
Norm : normalization at 50 keV in both the PL model and CPL model
Nomr_90err : 90% error of the normalization
chi2 : Chi-Squared
dof : degree of freedo
=== Time-averaged spectral analysis ===
(Best model with acceptable fit: PL)
Model Ph_index Ph_90err_low Ph_90err_hi Epeak Epeak_90err_low Epeak_90err_hi Norm Nomr_90err_low Norm_90err_hi chi2 dof
PL -1.805 -0.115 0.113 - - - 1.46e-02 -1.05e-03 1.04e-03 67.730 57
CPL -1.231 -0.469 0.538 60.678 -12.126 64.776 3.01e-02 -1.31e-02 2.87e-02 63.250 56
=== 1-s peak spectral analysis ===
(Best model with acceptable fit: CPL)
Model Ph_index Ph_90err_low Ph_90err_hi Epeak Epeak_90err_low Epeak_90err_hi Norm Nomr_90err_low Norm_90err_hi chi2 dof
PL -1.702 -0.102 0.101 - - - 2.53e-02 -1.64e-03 1.63e-03 81.190 57
CPL -0.852 -0.447 0.506 63.374 -9.489 21.163 7.18e-02 -2.98e-02 6.11e-02 69.540 56
=== Fluence/Peak Flux Summary ===
Model Band1 Band2 Band3 Band4 Band5 Total
15-25 25-50 50-100 100-350 15-150 15-350 keV
Fluence PL 5.10e-08 7.78e-08 8.90e-08 1.95e-07 2.76e-07 4.13e-07 erg/cm2
90%_error_low -4.99e-09 -4.99e-09 -8.52e-09 -3.57e-08 -2.00e-08 -4.44e-08 erg/cm2
90%_error_hi 5.11e-09 4.99e-09 8.56e-09 4.06e-08 2.02e-08 4.81e-08 erg/cm2
Peak flux PL 1.27e+00 1.13e+00 6.95e-01 6.49e-01 3.37e+00 3.74e+00 ph/cm2/s
90%_error_low -1.21e-01 -7.06e-02 -5.69e-02 -9.86e-02 -2.08e-01 -2.27e-01 ph/cm2/s
90%_error_hi 1.23e-01 7.04e-02 5.67e-02 1.08e-01 2.08e-01 2.27e-01 ph/cm2/s
Fluence CPL N/A N/A N/A N/A N/A N/A erg/cm2
90%_error_low -4.99e-09 -4.99e-09 -8.52e-09 -3.57e-08 -2.00e-08 -4.44e-08 erg/cm2
90%_error_hi 5.11e-09 4.99e-09 8.56e-09 4.06e-08 2.02e-08 4.81e-08 erg/cm2
Peak flux CPL 1.12e+00 1.24e+00 7.28e-01 2.64e-01 3.27e+00 3.35e+00 ph/cm2/s
90%_error_low -1.42e-01 -9.01e-02 -6.48e-02 -9.89e-02 -2.15e-01 -2.40e-01 ph/cm2/s
90%_error_hi 1.44e-01 9.25e-02 6.51e-02 1.50e-01 2.15e-01 2.53e-01 ph/cm2/s
======================================================================
Image
Pre-slew 15.0-350.0 keV image (Event data)
#   RAcent    DECcent   POSerr    Theta     Phi              Peak Cts       SNR   Name
  296.1081    -2.9517   0.0071    20.9280   -74.2895         0.5256219     26.761 TRIG_00573190

Foreground time interval of the image:
 -0.248   1.800 (delta_t =   2.048 [sec])
Background time interval of the image:
-239.800  -0.248 (delta_t = 239.552 [sec])
Light Curves
Note: The mask-weighted lightcurves have units of either count/det or counts/sec/det, where a det is 0.4 x 0.4 = 0.16 sq cm.
Full-time range; 1 s binning
Other quick-look light curves:
- 64 ms binning (zoomed)
- 16 ms binning (zoomed)
- 8 ms binning (zoomed)
- 2 ms binning (zoomed)
- SN=5 or 10 s binning (full-time range)
- Raw light curve
Spectra
- 64 ms binning (zoomed)
- 16 ms binning (zoomed)
- 8 ms binning (zoomed)
- 2 ms binning (zoomed)
- SN=5 or 10 s binning (full-time range)
- Raw light curve
Spectra
Notes:
- 1) The fitting includes the systematic errors.
- 2) When the burst includes telescope slew time periods, the fitting uses an average response file made from multiple 5-s response files through out the slew time plus single time preiod for the non-slew times, and weighted by the total counts in the corresponding time period using addrmf. An average response file is needed becuase a spectral fit using the pre-slew DRM will introduce some errors in both a spectral shape and a normalization if the PHA file contains a lot of the slew/post-slew time interval.
- 3) For fits to more complicated models (e.g. a power-law over a cutoff power-law), the BAT team has decided to require a chi-square improvement of more than 6 for each extra dof.
Time averaged spectrum fit using the average DRM
Power-law model
Time interval is from   -0.248 sec. to    1.800 sec.

Spectral model in power-law:
------------------------------------------------------------
Parameters  : value       lower 90%   higher 90%
Photon index: -1.80518     ( -0.115307   0.112994 )
Norm@50keV  : 1.46266E-02    ( -0.00104532   0.00103521 )
------------------------------------------------------------
#Fit statistic : Chi-Squared =          67.73 using 59 PHA bins.
# Reduced chi-squared =          1.188 for     57 degrees of freedom
# Null hypothesis probability =   1.562711e-01

Photon flux (15-150 keV)    in 2.048 sec: 2.01969 ( -0.13126  0.13138 ) ph/cm2/s
Energy fluence (15-150 keV)             : 2.75759e-07 ( -1.9983e-08  2.01647e-08 ) ergs/cm2
Cutoff power-law model
Time interval is from   -0.248 sec. to    1.800 sec.
Spectral model in the cutoff power-law:
------------------------------------------------------------
Parameters  : value       lower 90%   higher 90%
Photon index: -1.23067     ( -0.469467   0.538403 )
Epeak [keV] : 60.6780      ( -12.126 64.7764 )
Norm@50keV  : 3.00793E-02    ( -0.0131428   0.0287025 )
------------------------------------------------------------
#Fit statistic : Chi-Squared =          63.25 using 59 PHA bins.
# Reduced chi-squared =          1.129 for     56 degrees of freedom
# Null hypothesis probability =   2.357580e-01

Photon flux (15-150 keV)    in 2.048 sec: 1.97099 ( -0.13742  0.13718 ) ph/cm2/s
Energy fluence (15-150 keV)             : 0 ( 0  0 ) ergs/cm2
1-s peak spectrum fit
Power-law model
Time interval is from   -0.268 sec. to    0.732 sec.

Spectral model in power-law:
------------------------------------------------------------
Parameters  : value       lower 90%   higher 90%
Photon index: -1.70178     ( -0.102466   0.100997 )
Norm@50keV  : 2.53259E-02    ( -0.00164061   0.00163117 )
------------------------------------------------------------
#Fit statistic : Chi-Squared =          81.19 using 59 PHA bins.
# Reduced chi-squared =          1.424 for     57 degrees of freedom
# Null hypothesis probability =   1.934430e-02

Photon flux (15-150 keV)    in 1 sec: 3.36579 ( -0.20792  0.2081 ) ph/cm2/s
Energy fluence (15-150 keV)             : 2.34488e-07 ( -1.58327e-08  1.59326e-08 ) ergs/cm2
Cutoff power-law model
Time interval is from   -0.268 sec. to    0.732 sec.
Spectral model in the cutoff power-law:
------------------------------------------------------------
Parameters  : value       lower 90%   higher 90%
Photon index: -0.851597     ( -0.446728   0.506437 )
Epeak [keV] : 63.3739      ( -9.4893 21.1633 )
Norm@50keV  : 7.18192E-02    ( -0.0298188   0.061063 )
------------------------------------------------------------
#Fit statistic : Chi-Squared =          69.54 using 59 PHA bins.
# Reduced chi-squared =          1.242 for     56 degrees of freedom
# Null hypothesis probability =   1.055964e-01

Photon flux (15-150 keV)    in 1 sec: 3.26501 ( -0.21468  0.21461 ) ph/cm2/s
Energy fluence (15-150 keV)             : 2.20511e-07 ( -1.73735e-08  1.75016e-08 ) ergs/cm2
Time-resolved spectra
Distribution
T90 vs. Hardness ratio plot
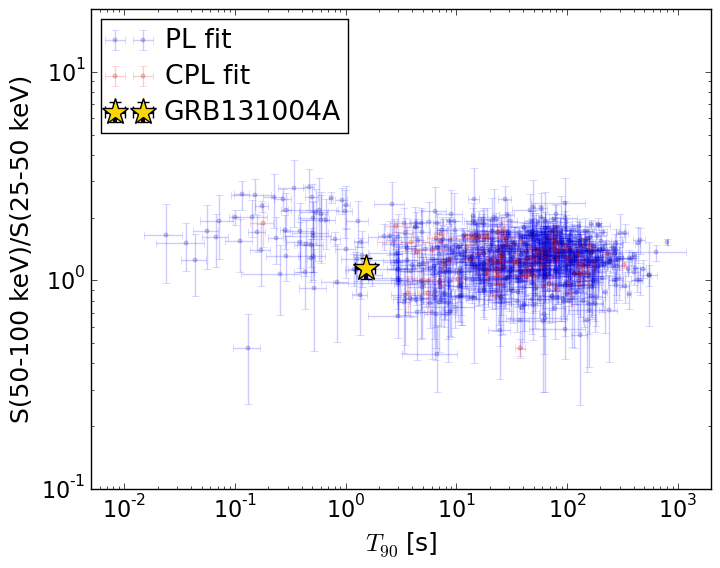
T90                                   = 1.536 sec.
Hardness ratio (energy fluence ratio) = 1.14459008605
S(15-50 keV) vs. S(50-150 keV) plot
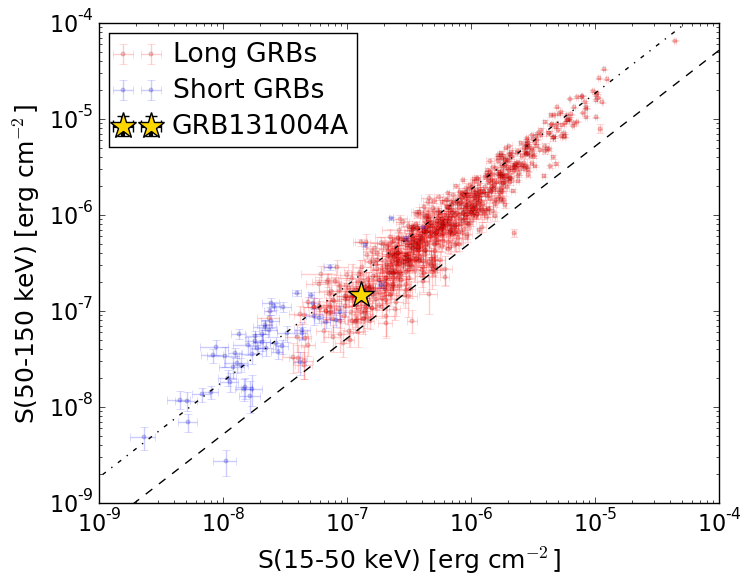
S(15-50 keV)  = 1.2877478e-07
S(50-150 keV) = 1.4698866e-07
The dash-dotted line and the dashed line traces the fluences calculated from the Band function with Epeak = 15 and 150 keV, respectively. Both lines assume a canonical values of alpha = -1 and beta = -2.5.
Mask shadow pattern
IMX = 1.035513442390058E-01, IMY = 3.681357784116517E-01
Spacecraft aspect plot
Bright source in the pre-burst/pre-slew/post-slew images
Pre-burst image of 15-350 keV band
Time interval of the image:
-239.800000 -0.248000

# RAcent  DECcent POSerr Theta    Phi  PeakCts   SNR AngSep     Name
#  [deg]    [deg]    ['] [deg]  [deg]                   [']
285.1395 -25.0538   16.0  36.4 -116.1  -0.2259  -0.7    9.8	HT1900.1-2455
288.7965  10.9710    1.1  32.4  -49.7   2.4964  11.0    1.5	GRS 1915+105
299.6895  35.2180    2.3  43.6  -10.4   1.3602   5.1    5.0	Cyg X-1
308.0930  40.9911    3.1  47.0    1.0   1.2147   3.8    2.4	Cyg X-3
326.3039  38.3729   10.0  44.5   20.6   0.3901   1.1    6.9	Cyg X-2
335.8663 -60.3777    4.6  56.9  179.2   3.2623   2.5 ------	UNKNOWN
291.8865  47.8651    3.0  57.5   -9.5   3.2433   3.9 ------	UNKNOWN
297.5492 -19.4153    2.5  23.6 -118.3   0.8537   4.7 ------	UNKNOWN
293.0792 -15.8992    2.3  25.7 -106.1   1.0907   5.1 ------	UNKNOWN
Pre-slew background subtracted image of 15-350 keV band
Time interval of the image:
-0.248000 1.800000

# RAcent  DECcent POSerr Theta    Phi  PeakCts   SNR AngSep     Name
#  [deg]    [deg]    ['] [deg]  [deg]                   [']
284.8869 -25.0199    8.2  36.5 -115.9  -0.0476  -1.4   10.1	HT1900.1-2455
288.7549  11.0470    4.2  32.5  -49.6   0.0611   2.8    6.6	GRS 1915+105
299.4308  35.2941    5.6  43.8  -10.6  -0.0517  -2.1    9.6	Cyg X-1
307.9653  40.9698    5.9  47.0    0.9   0.0653   2.0    6.7	Cyg X-3
326.1769  38.3311    4.4  44.4   20.5  -0.0837  -2.7    0.6	Cyg X-2
296.1082  -2.9517    0.4  20.9  -74.3   0.5255  26.8 ------	UNKNOWN
Post-slew image of 15-350 keV band
Time interval of the image:
54.100600 962.275400

# RAcent  DECcent POSerr Theta    Phi  PeakCts   SNR AngSep     Name
#  [deg]    [deg]    ['] [deg]  [deg]                   [']
254.4795  35.5088    3.8  54.8  -35.7  -7.7444  -3.1   10.0	Her X-1
263.0096 -24.7159    3.6  38.7 -121.4   3.0488   3.2    1.8	GX 1+4
264.9105 -44.4798   10.2  49.8 -145.2  -1.6089  -1.1    7.4	4U 1735-44
268.4206  -1.3134    5.8  27.8  -81.4   1.3166   2.0    8.9	SW J1753.5-0127
270.4398 -25.0715    9.0  33.2 -128.2   0.9007   1.3    8.5	GX 5-1
270.3044 -25.7701    3.2  33.7 -129.1   2.4862   3.6    1.6	GRS 1758-258
274.0319 -14.0458    3.0  24.5 -112.3   2.2031   3.8    1.6	GX 17+2
275.8939 -30.3689    4.3  33.5 -141.3   1.6292   2.7    1.6	H1820-303
285.1755 -24.7719    0.0  24.3 -149.2   0.6732   1.4   11.7	HT1900.1-2455
288.7936  10.9580    0.6  15.7  -21.9   9.5103  19.7    0.8	GRS 1915+105
299.6123  35.1988    1.0  38.3   10.4   7.8207  12.0    1.1	Cyg X-1
308.1024  40.9821    2.3  45.3   18.5   4.8443   5.0    1.8	Cyg X-3
326.0294  38.3853   20.9  49.7   36.6  -1.5222  -0.6    7.7	Cyg X-2
262.9991 -33.7704    4.8  43.7 -132.9   2.6760   2.4    3.9	GX 354-0
330.6182   9.8104    3.4  36.6   75.0   4.4252   3.4 ------	UNKNOWN
332.9271 -26.6415    3.5  42.4  133.4   5.4084   3.3 ------	UNKNOWN
312.6406 -39.2305    2.3  39.2  165.5   4.0839   5.1 ------	UNKNOWN
305.9855   0.3803    2.9  10.4   77.2   1.6693   4.0 ------	UNKNOWN
292.5562  46.6571    2.8  49.7    2.6   4.4986   4.2 ------	UNKNOWN
291.8105   5.3655    3.9   9.4  -21.8   1.3197   2.9 ------	UNKNOWN
298.0071 -56.3643    3.0  53.4 -175.4   5.6867   3.9 ------	UNKNOWN
	UNKNOWN
	UNKNOWN
	UNKNOWN