Analysis Summary
Notes:
- 1) No attempt has been made to eliminate the non-significant decimal places.
- 2) This batgrbproduct analysis is done using the HEASARC data.
- 3) This batgrbproduct analysis is using the flight position for the mask-weighting calculation.
======================================================================
                  BAT GRB EVENT DATA PROCESSING REPORT
    Process Script Ver: batgrbproduct v2.46
    Process Start Time: Sat Jan 11 22:44:42 EST 2014
             Host Name: batevent1
   Current Working Dir: /local/data/batevent/batevent_reproc/trigger574935
======================================================================

  Trigger: 00574935      Segment: 000

  BAT Trigger Time: 403793280   [s; MET]
      Trigger Stop: 403793344   [s; MET]
               UTC: 2013-10-18T12:47:48.834540    [includes UTCF correction]
       Where From?: TDRSS position message

  BAT
    RA: 98.4618116856018   Dec: -19.8820304441863  [deg; J2000]

     Catalogged Source?: NO
     Point Source?:      YES
     GRB Indicated?:     YES    [ by BAT flight software ]
     Image S/N Ratio:    16.77
     Image Trigger?:     YES
     Rate S/N Ratio:     0  [ if not an image trigger ]
     Image S/N Ratio:    16.77

  Analysis Position:   [ source = BAT ]
    RA: 98.4618116856018   Dec: -19.8820304441863  [deg; J2000]

  Refined Position:   [ source = BAT pre-slew burst ]
    RA: 98.4685450877152   Dec: -19.8994638741002  [deg; J2000]
        { 06h 33m 52.5s , -19d 53' 58.1" }
         +/- 1.27550544202634 [arcmin] (estimated 90% radius based on SNR)
         +/- 0.552306285333286 [arcmin] (formal 1-sigma fit error)
    SNR: 21.4854098701745

  Angular difference between the analysis and refined position is 1.112858 arcmin

  Partial Coding Fraction: 1.015625    [ including projection effects ]

  Duration
     T90: 73.2159999608994 +/- 18.9734095686505
        Measured from: 24.8080000281334
                   to: 98.0239999890327     [s; relative to TRIGTIME]
     T50: 31.2960000038147 +/- 5.21393821144733
        Measured from: 39.3360000252724
                   to: 70.6320000290871     [s; relative to TRIGTIME]


  Fluence
     Peak Flux  (peak 1 second)
        Measured from: 59.4120000004768
                   to: 60.4120000004768     [s; relative to TRIGTIME]
     Total Fluence
        Measured from: 21.0960000157356
                   to: 117.736000001431     [s; relative to TRIGTIME]

             Band 1     Band 2     Band 3     Band 4
              15-25      25-50     50-100    100-350     keV
 Total     0.989807   0.908741   0.358349   0.040430
           0.049879   0.050775   0.043518   0.037216 [error]
 Peak      0.023897   0.025402   0.011467   0.008017
           0.005045   0.005297   0.004479   0.003797 [error]

     [ fluence units of on-axis counts / fully illuminated detector ]

======================================================================


====== Table of the duration information =============================

        Value   tstart    tstop
T100   96.640   21.096  117.736
T90    73.216   24.808   98.024
T50    31.296   39.336   70.632
Peak    1.000   59.412   60.412


====== Spectral Analysis Summary =====================================

Model      : spectral model: simple power-law (PL) and cutoff power-law (CPL)
Ph_index   : photon index: E^{Ph_index}
Ph_90err   : 90% error of the photon index
Epeak      : Epeak in keV
Epeak_90err: 90% error of Epeak
Norm       : normalization at 50 keV in both the PL model and CPL model
Nomr_90err : 90% error of the normalization
chi2       : Chi-Squared
dof        : degree of freedo

=== Time-averaged spectral analysis ===
(Best model with acceptable fit: PL)

Model Ph_index Ph_90err_low Ph_90err_hi  Epeak  Epeak_90err_low  Epeak_90err_hi  Norm       Nomr_90err_low    Norm_90err_hi    chi2    dof
PL      -2.245    -0.143      0.137       -           -               -         1.19e-03     -1.14e-04          1.12e-04      57.470   57
CPL     -1.712    -0.286      0.668       20.756     -19.670        12.470      2.50e-03     -9.99e-04          3.86e-03      54.940   56


=== 1-s peak spectral analysis ===
(Best model with acceptable fit: N/A)

Model Ph_index Ph_90err_low Ph_90err_hi  Epeak  Epeak_90err_low  Epeak_90err_hi  Norm       Nomr_90err_low    Norm_90err_hi    chi2    dof
PL      -1.836     -0.464     0.417       -           -               -         3.44e-03     -1.05e-03          1.00e-03      75.130   57
CPL     -1.354     -0.843     2.453       55.126      N/A           N/A         6.64e-03        N/A               N/A         74.920   56


=== Fluence/Peak Flux Summary ===

              Model    Band1     Band2     Band3     Band4     Band5     Total
                       15-25     25-50    50-100    100-350    15-150    15-350    keV
Fluence         PL   2.98e-07  3.49e-07  2.95e-07  4.21e-07  1.09e-06  1.36e-06   erg/cm2
      90%_error_low -2.77e-08 -2.41e-08 -3.84e-08 -9.82e-08 -8.71e-08 -1.47e-07   erg/cm2
      90%_error_hi   2.82e-08  2.41e-08  3.95e-08  1.18e-07  8.87e-08  1.61e-07   erg/cm2
Peak flux       PL   1.96e-01  1.62e-01  9.05e-02  7.49e-02  4.81e-01  5.23e-01   ph/cm2/s
      90%_error_low -6.44e-02 -3.90e-02 -3.45e-02 -4.33e-02 -1.16e-01 -1.30e-01   ph/cm2/s
      90%_error_hi   6.75e-02  3.90e-02  3.55e-02  6.85e-02  1.16e-01  1.32e-01   ph/cm2/s

Fluence        CPL   2.87e-07  3.69e-07  2.76e-07  1.54e-07  1.03e-06  1.09e-06   erg/cm2
      90%_error_low -3.07e-08 -3.10e-08 -5.00e-08 -9.81e-08 -1.05e-07 -1.50e-07   erg/cm2
      90%_error_hi   3.04e-08  3.26e-08  4.65e-08  2.10e-07  1.11e-07  2.48e-07   erg/cm2
Peak flux      CPL   1.89e-01  1.72e-01  8.98e-02  3.69e-02  4.75e-01  4.88e-01   ph/cm2/s
      90%_error_low -7.27e-02     N/A       N/A   -3.69e-02 -1.18e-01 -1.29e-01   ph/cm2/s
      90%_error_hi   7.13e-02     N/A       N/A    5.15e-02  1.18e-01  7.75e-02   ph/cm2/s

======================================================================
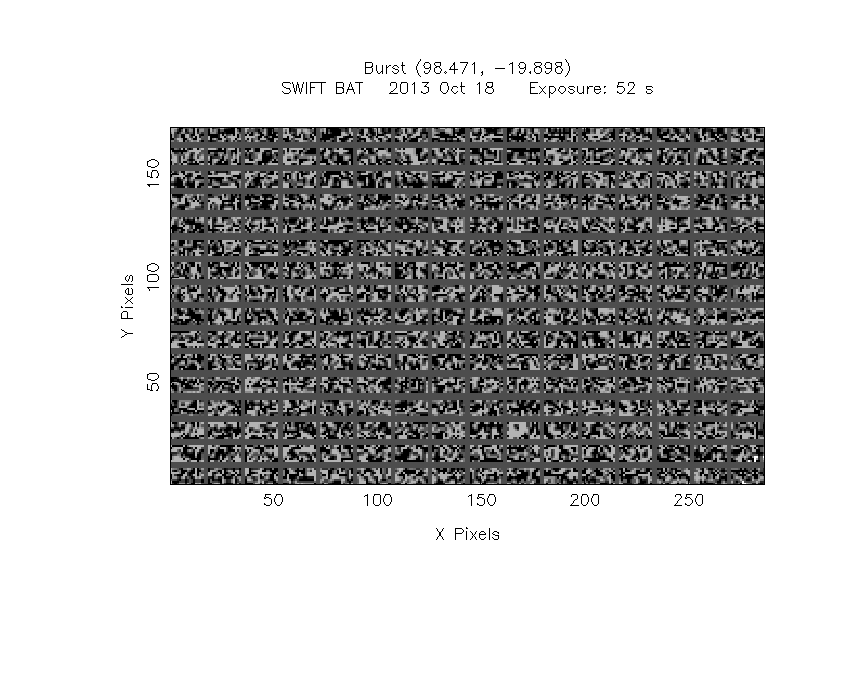
Image
Pre-slew 15.0-350.0 keV image (Event data)
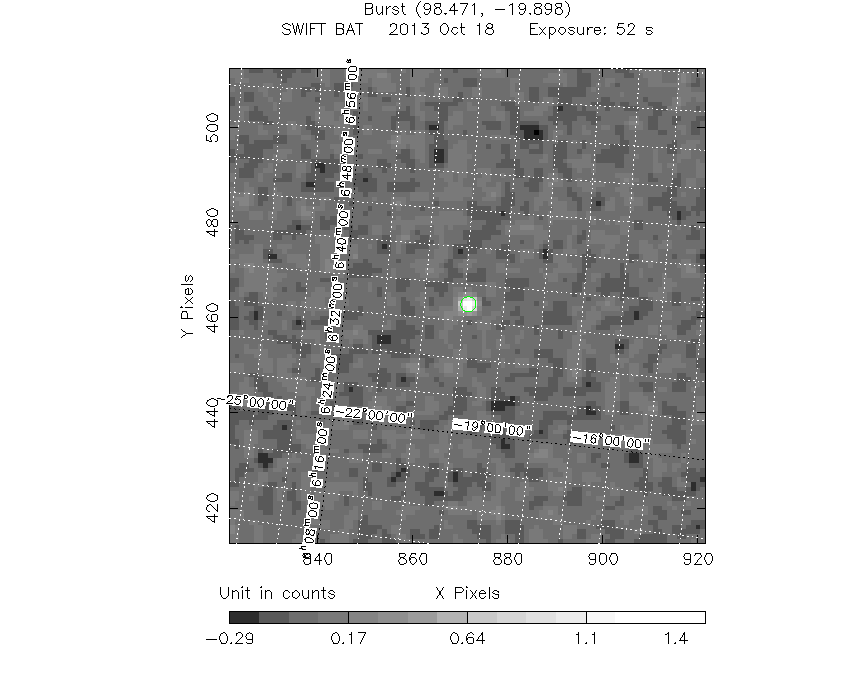
#   RAcent    DECcent   POSerr    Theta     Phi              Peak Cts       SNR   Name
   98.4685   -19.8995   0.0090     1.9149    59.9138         1.5992914     21.485 TRIG_00574935

Foreground time interval of the image:
 21.096  72.901 (delta_t =  51.805 [sec])
Background time interval of the image:
-239.000  21.096 (delta_t = 260.096 [sec])
Light Curves
Note: The mask-weighted lightcurves have units of either count/det or counts/sec/det, where a det is 0.4 x 0.4 = 0.16 sq cm.
Full-time range; 1 s binning
Other quick-look light curves:
- 64 ms binning (zoomed)
- 16 ms binning (zoomed)
- 8 ms binning (zoomed)
- 2 ms binning (zoomed)
- SN=5 or 10 s binning (full-time range)
- Raw light curve
Spectra
- 64 ms binning (zoomed)
- 16 ms binning (zoomed)
- 8 ms binning (zoomed)
- 2 ms binning (zoomed)
- SN=5 or 10 s binning (full-time range)
- Raw light curve
Spectra
Notes:
- 1) The fitting includes the systematic errors.
- 2) When the burst includes telescope slew time periods, the fitting uses an average response file made from multiple 5-s response files through out the slew time plus single time preiod for the non-slew times, and weighted by the total counts in the corresponding time period using addrmf. An average response file is needed becuase a spectral fit using the pre-slew DRM will introduce some errors in both a spectral shape and a normalization if the PHA file contains a lot of the slew/post-slew time interval.
- 3) For fits to more complicated models (e.g. a power-law over a cutoff power-law), the BAT team has decided to require a chi-square improvement of more than 6 for each extra dof.
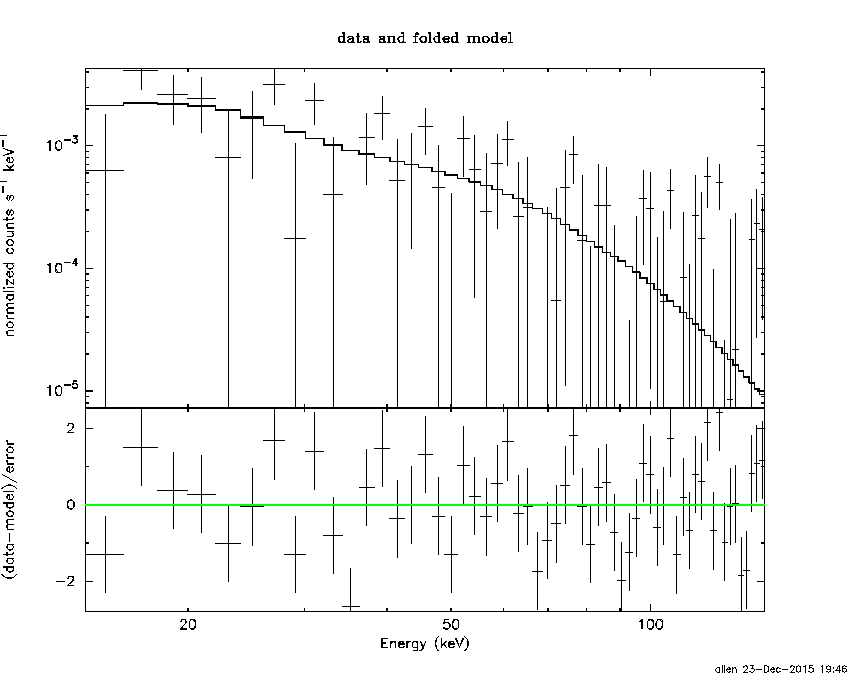
Time averaged spectrum fit using the average DRM
Power-law model
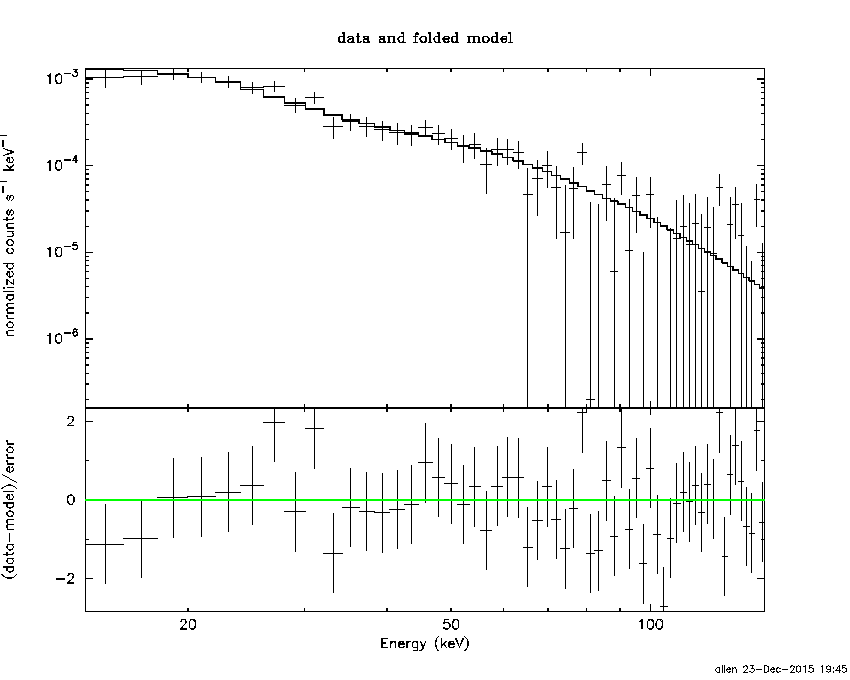
Time interval is from   21.096 sec. to  117.736 sec.

Spectral model in power-law:
------------------------------------------------------------
Parameters  : value       lower 90%   higher 90%
Photon index: -2.24462     ( -0.142607   0.136883 )
Norm@50keV  : 1.19428E-03    ( -0.000113898   0.000112442 )
------------------------------------------------------------
#Fit statistic : Chi-Squared =          57.47 using 59 PHA bins.
# Reduced chi-squared =          1.008 for     57 degrees of freedom
# Null hypothesis probability =   4.577727e-01

Photon flux (15-150 keV)    in 96.64 sec: 0.202495 ( -0.013616  0.013622 ) ph/cm2/s
Energy fluence (15-150 keV)             : 1.09269e-06 ( -8.70853e-08  8.86563e-08 ) ergs/cm2
Cutoff power-law model
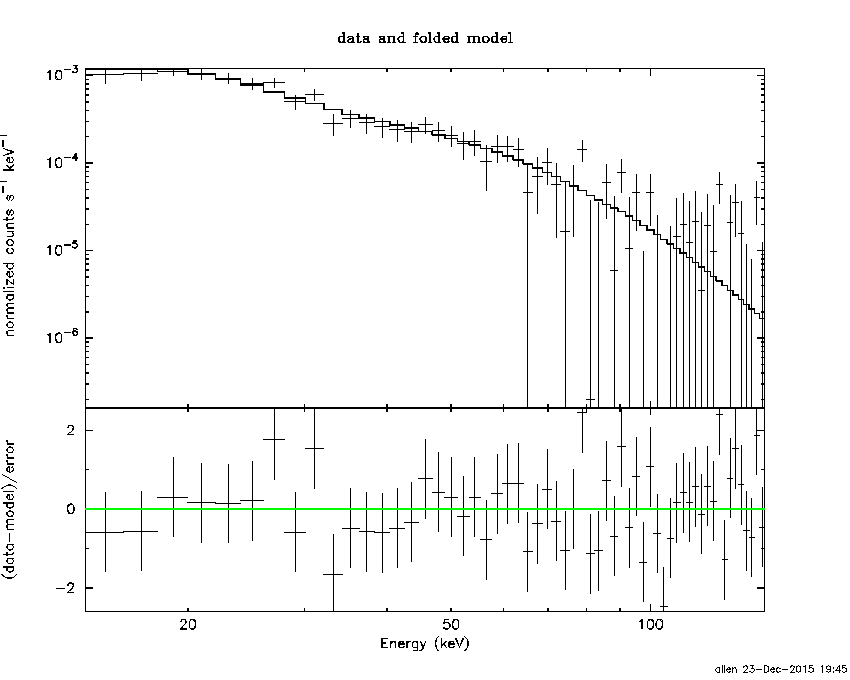
Time interval is from   21.096 sec. to  117.736 sec.
Spectral model in the cutoff power-law:
------------------------------------------------------------
Parameters  : value       lower 90%   higher 90%
Photon index: -1.71238     ( -0.285744   0.668133 )
Epeak [keV] : 20.7564      ( -19.6721 12.4673 )
Norm@50keV  : 2.50301E-03    ( -0.000999333   0.00385774 )
------------------------------------------------------------
#Fit statistic : Chi-Squared =          54.94 using 59 PHA bins.
# Reduced chi-squared =         0.9811 for     56 degrees of freedom
# Null hypothesis probability =   5.148766e-01

Photon flux (15-150 keV)    in 96.64 sec: 0.202476 ( -0.013674  0.013728 ) ph/cm2/s
Energy fluence (15-150 keV)             : 1.02536e-06 ( -1.04875e-07  1.11107e-07 ) ergs/cm2
1-s peak spectrum fit
Power-law model
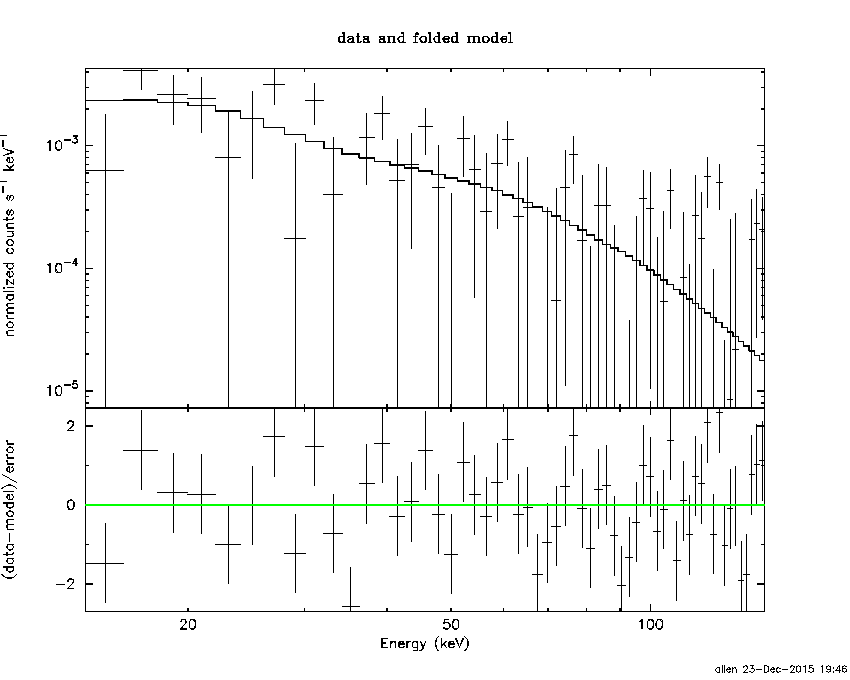
Time interval is from   59.412 sec. to   60.412 sec.

Spectral model in power-law:
------------------------------------------------------------
Parameters  : value       lower 90%   higher 90%
Photon index: -1.83598     ( -0.46419   0.417389 )
Norm@50keV  : 3.44213E-03    ( -0.00105243   0.00100201 )
------------------------------------------------------------
#Fit statistic : Chi-Squared =          75.13 using 59 PHA bins.
# Reduced chi-squared =          1.318 for     57 degrees of freedom
# Null hypothesis probability =   5.406302e-02

Photon flux (15-150 keV)    in 1 sec: 0.481125 ( -0.115912  0.115913 ) ph/cm2/s
Energy fluence (15-150 keV)             : 3.16621e-08 ( -9.30888e-09  9.7598e-09 ) ergs/cm2
Cutoff power-law model
Time interval is from   59.412 sec. to   60.412 sec.
Spectral model in the cutoff power-law:
------------------------------------------------------------
Parameters  : value       lower 90%   higher 90%
Photon index: -1.35373     ( -0.843789   2.45181 )
Epeak [keV] : 55.1262      (   )
Norm@50keV  : 6.63619E-03    (     )
------------------------------------------------------------
#Fit statistic : Chi-Squared =          74.92 using 59 PHA bins.
# Reduced chi-squared =          1.338 for     56 degrees of freedom
# Null hypothesis probability =   4.648465e-02

Photon flux (15-150 keV)    in 1 sec: 0.474922 ( -0.117945  0.118033 ) ph/cm2/s
Energy fluence (15-150 keV)             : 2.9964e-08 ( -1.00623e-08  9.32672e-09 ) ergs/cm2
Time-resolved spectra
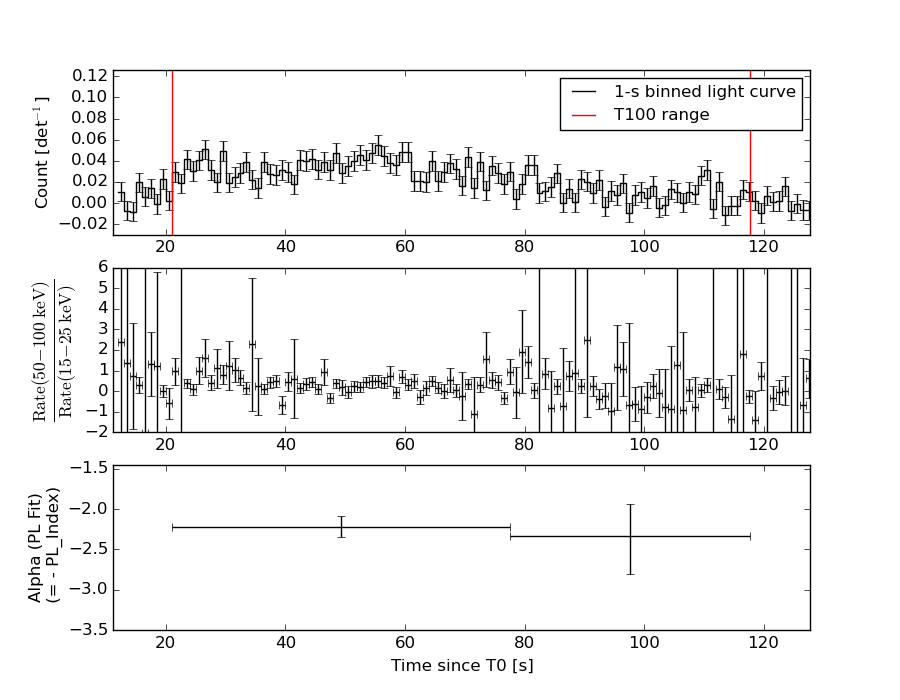
Distribution
T90 vs. Hardness ratio plot
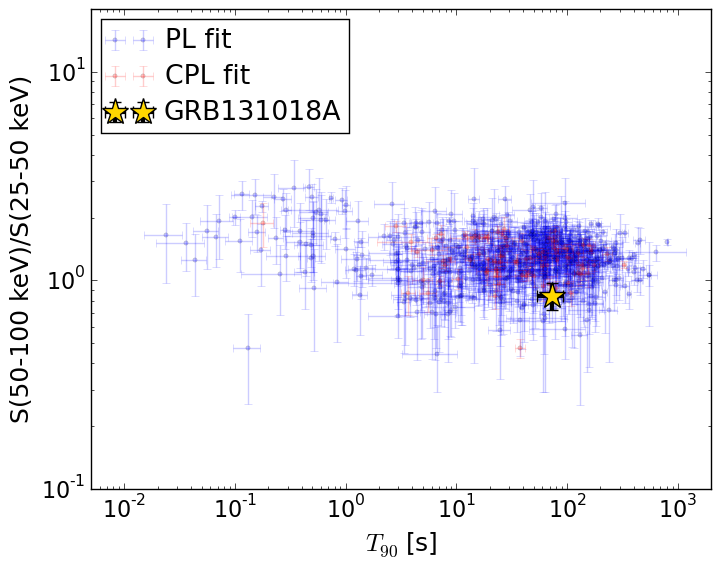
T90                                   = 73.216 sec.
Hardness ratio (energy fluence ratio) = 0.844073026573
S(15-50 keV) vs. S(50-150 keV) plot
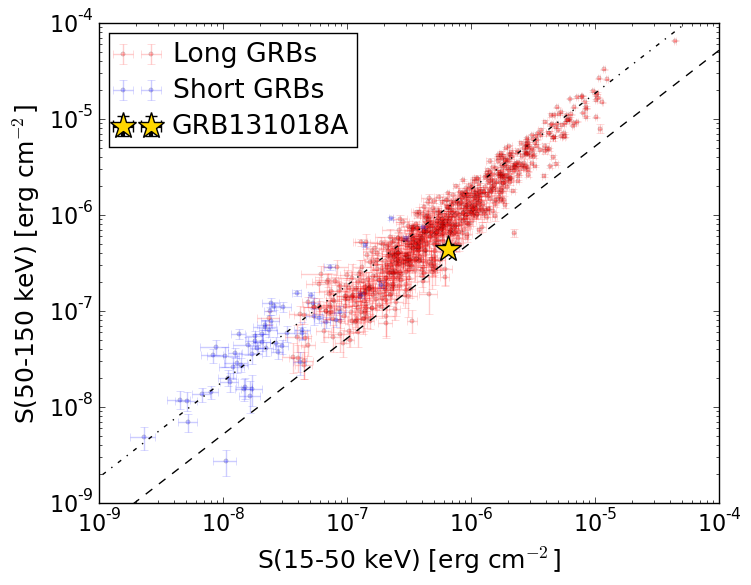
S(15-50 keV)  = 6.472954e-07
S(50-150 keV) = 4.454009e-07
The dash-dotted line and the dashed line traces the fluences calculated from the Band function with Epeak = 15 and 150 keV, respectively. Both lines assume a canonical values of alpha = -1 and beta = -2.5.
Mask shadow pattern
IMX = 1.676086241716447E-02, IMY = -2.893002242861716E-02
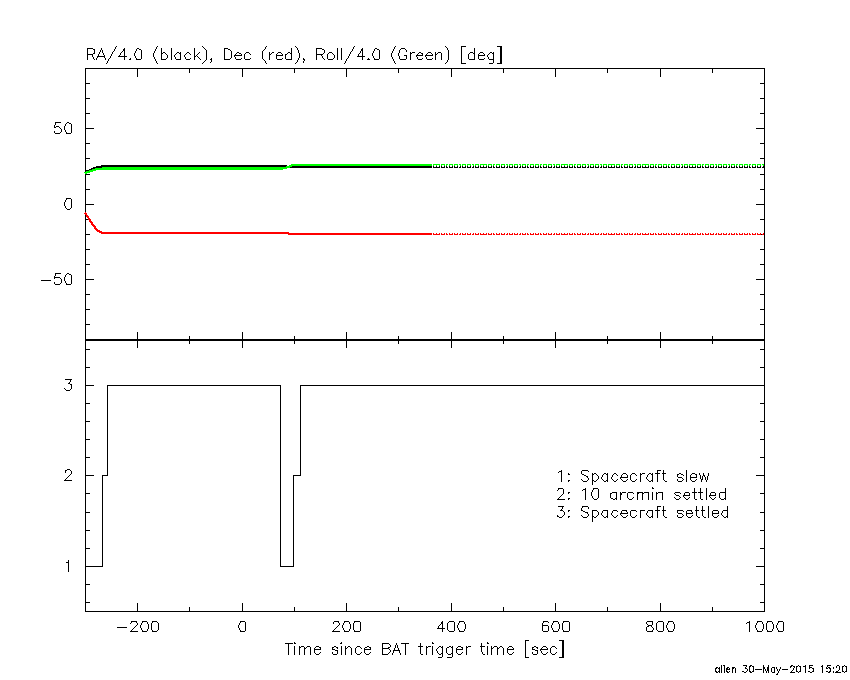
Spacecraft aspect plot
Bright source in the pre-burst/pre-slew/post-slew images
Pre-burst image of 15-350 keV band
Time interval of the image:
-239.000000 21.096000

# RAcent  DECcent POSerr Theta    Phi  PeakCts   SNR AngSep     Name
#  [deg]    [deg]    ['] [deg]  [deg]                   [']
 83.6423  22.0215    0.6  44.2  153.2  10.7513  18.8    0.7	Crab
135.5930 -40.5239    1.8  37.0  -51.3   1.9653   6.5    3.5	Vela X-1
 64.4819   2.7856    2.7  41.5  113.5   3.3406   4.3 ------	UNKNOWN
 76.8144 -58.0095    2.4  42.6   13.7   1.6351   4.8 ------	UNKNOWN
 83.7341 -59.1164    2.9  41.8    8.2   1.2475   3.9 ------	UNKNOWN
 92.4763 -40.7359    2.5  22.7   11.1   0.9097   4.7 ------	UNKNOWN
107.4238 -38.7993    2.6  20.7  -20.3   0.8678   4.5 ------	UNKNOWN
110.9571 -39.2946    2.2  22.2  -26.7   0.9997   5.4 ------	UNKNOWN
119.5836  -8.9615    2.5  21.2 -120.2   0.9266   4.7 ------	UNKNOWN
129.7111  21.4686    3.2  49.7 -147.6   1.8640   3.6 ------	UNKNOWN
139.3189   7.1541    2.3  46.5 -125.1   4.4598   4.9 ------	UNKNOWN
Pre-slew background subtracted image of 15-350 keV band
Time interval of the image:
21.096000 72.900600

# RAcent  DECcent POSerr Theta    Phi  PeakCts   SNR AngSep     Name
#  [deg]    [deg]    ['] [deg]  [deg]                   [']
 83.5141  22.0594   16.7  44.3  153.0   0.1303   0.7    7.2	Crab
135.5557 -40.6032   10.4  37.0  -51.2  -0.1413  -1.1    3.2	Vela X-1
 88.0494  -9.1935    2.1  15.4  123.7   0.4175   5.5 ------	UNKNOWN
 98.4686 -19.8995    0.5   1.9   59.9   1.5989  21.5 ------	UNKNOWN
116.8525 -33.9556    2.3  20.9  -45.8   0.3908   5.0 ------	UNKNOWN
Post-slew image of 15-350 keV band
Time interval of the image:
97.700600 963.157200

# RAcent  DECcent POSerr Theta    Phi  PeakCts   SNR AngSep     Name
#  [deg]    [deg]    ['] [deg]  [deg]                   [']
 83.6363  22.0199    0.5  44.3  145.9  35.3048  22.6    0.4	Crab
135.5422 -40.5441    2.0  37.7  -62.8   7.0128   5.7    0.9	Vela X-1
 61.8123 -59.8268    3.4  47.7    9.6   3.3336   3.4 ------	UNKNOWN
107.4301  19.4387    2.5  40.3  178.8   3.1086   4.6 ------	UNKNOWN
112.5538  31.5532    3.1  53.2 -179.3   5.7331   3.7 ------	UNKNOWN
114.3916 -41.6078    2.8  25.6  -42.7   1.9926   4.1 ------	UNKNOWN
135.1635 -75.6264    3.8  58.9  -24.3  10.8253   3.0 ------	UNKNOWN
142.1600 -18.9200    4.7  41.1  -98.0   7.6233   2.5 ------	UNKNOWN
141.2322   0.3896    2.6  46.5 -125.0  10.2383   4.4 ------	UNKNOWN
141.0129   3.6796    2.9  48.0 -129.0   8.7098   3.9 ------	UNKNOWN