Analysis Summary
Notes:
- 1) No attempt has been made to eliminate the non-significant decimal places.
- 2) This batgrbproduct analysis is done using the HEASARC data.
- 3) This batgrbproduct analysis is using the flight position for the mask-weighting calculation.
======================================================================
                  BAT GRB EVENT DATA PROCESSING REPORT
    Process Script Ver: batgrbproduct v2.46
    Process Start Time: Sat Jan 11 22:40:30 EST 2014
             Host Name: batevent1
   Current Working Dir: /local/data/batevent/batevent_reproc/trigger575707
======================================================================

  Trigger: 00575707      Segment: 000

  BAT Trigger Time: 404310392   [s; MET]
      Trigger Stop: 404310456   [s; MET]
               UTC: 2013-10-24T12:26:20.810860    [includes UTCF correction]
       Where From?: TDRSS position message

  BAT
    RA: 290.4635354555   Dec: -64.6025301330274  [deg; J2000]

     Catalogged Source?: NO
     Point Source?:      YES
     GRB Indicated?:     YES    [ by BAT flight software ]
     Image S/N Ratio:    8.5
     Image Trigger?:     YES
     Rate S/N Ratio:     0  [ if not an image trigger ]
     Image S/N Ratio:    8.5

  Analysis Position:   [ source = BAT ]
    RA: 290.4635354555   Dec: -64.6025301330274  [deg; J2000]

  Refined Position:   [ source = BAT pre-slew burst ]
    RA: 290.543133345152   Dec: -64.600337499205  [deg; J2000]
        { 19h 22m 10.4s , -64d 36' 01.2" }
         +/- 2.02864175216739 [arcmin] (estimated 90% radius based on SNR)
         +/- 0.940369747907372 [arcmin] (formal 1-sigma fit error)
    SNR: 11.0727012009984

  Angular difference between the analysis and refined position is 2.052652 arcmin

  Partial Coding Fraction: 0.7890625    [ including projection effects ]

  Duration
     T90: 112 +/- 35.7770876399966
        Measured from: -111
                   to: 1     [s; relative to TRIGTIME]
     T50: 64 +/- 16
        Measured from: -79
                   to: -15     [s; relative to TRIGTIME]


  Fluence
     Peak Flux  (peak 1 second)
        Measured from: -55.5
                   to: -54.5     [s; relative to TRIGTIME]
     Total Fluence
        Measured from: -111
                   to: 17     [s; relative to TRIGTIME]

             Band 1     Band 2     Band 3     Band 4
              15-25      25-50     50-100    100-350     keV
 Total     0.707696   0.905778   0.485687   0.081794
           0.076199   0.073545   0.062543   0.055162 [error]
 Peak      0.000625   0.020909   0.008247  -0.001232
           0.005697   0.005550   0.004716   0.004007 [error]

     [ fluence units of on-axis counts / fully illuminated detector ]

======================================================================


====== Table of the duration information =============================

        Value   tstart    tstop
T100  128.000 -111.000   17.000
T90   112.000 -111.000    1.000
T50    64.000  -79.000  -15.000
Peak    1.000  -55.500  -54.500


====== Spectral Analysis Summary =====================================

Model      : spectral model: simple power-law (PL) and cutoff power-law (CPL)
Ph_index   : photon index: E^{Ph_index}
Ph_90err   : 90% error of the photon index
Epeak      : Epeak in keV
Epeak_90err: 90% error of Epeak
Norm       : normalization at 50 keV in both the PL model and CPL model
Nomr_90err : 90% error of the normalization
chi2       : Chi-Squared
dof        : degree of freedo

=== Time-averaged spectral analysis ===
(Best model with acceptable fit: PL)

Model Ph_index Ph_90err_low Ph_90err_hi  Epeak  Epeak_90err_low  Epeak_90err_hi  Norm       Nomr_90err_low    Norm_90err_hi    chi2    dof
PL      -1.842    -0.184      0.177       -           -               -         1.03e-03     -1.18e-04          1.16e-04      53.700   57
CPL     -1.436    -0.697      0.857       59.202     -21.644       -59.202      1.75e-03     -8.09e-04          3.67e-03      52.750   56


=== 1-s peak spectral analysis ===
(Best model with acceptable fit: N/A)

Model Ph_index Ph_90err_low Ph_90err_hi  Epeak  Epeak_90err_low  Epeak_90err_hi  Norm       Nomr_90err_low    Norm_90err_hi    chi2    dof
PL      -1.175     -0.703     0.807       -           -               -         2.13e-03     -1.00e-03          9.98e-04      60.440   57
CPL      2.053     -1.278    -2.053       56.812     -21.958        12.856      1.09e-01     -1.09e-01          4.86e+04      57.850   56


=== Fluence/Peak Flux Summary ===

              Model    Band1     Band2     Band3     Band4     Band5     Total
                       15-25     25-50    50-100    100-350    15-150    15-350    keV
Fluence         PL   2.32e-07  3.46e-07  3.86e-07  8.14e-07  1.21e-06  1.78e-06   erg/cm2
      90%_error_low -3.34e-08 -3.34e-08 -6.00e-08 -2.31e-07 -1.38e-07 -2.96e-07   erg/cm2
      90%_error_hi   3.43e-08  3.34e-08  6.08e-08  2.87e-07  1.41e-07  3.40e-07   erg/cm2
Peak flux       PL   6.37e-02  7.81e-02  6.96e-02  1.07e-01  2.49e-01  3.18e-01   ph/cm2/s
      90%_error_low -4.44e-02 -4.24e-02 -3.55e-02 -1.07e-01 -1.17e-01 -1.52e-01   ph/cm2/s
      90%_error_hi   5.84e-02  4.21e-02  3.55e-02  1.49e-01  1.21e-01  1.61e-01   ph/cm2/s

Fluence        CPL   2.23e-07  3.63e-07  3.81e-07  3.92e-07  1.15e-06  1.36e-06   erg/cm2
      90%_error_low -3.72e-08 -4.38e-08 -6.92e-08 -2.76e-07 -1.67e-07 -3.32e-07   erg/cm2
      90%_error_hi   3.74e-08  4.65e-08  6.50e-08  4.96e-07  1.70e-07  5.47e-07   erg/cm2
Peak flux      CPL   2.31e-02  1.64e-01  2.56e-02  1.03e-05  1.98e-01  1.98e-01   ph/cm2/s
      90%_error_low -2.31e-02 -7.58e-02 -2.56e-02 -1.03e-05 -7.25e-02 -7.24e-02   ph/cm2/s
      90%_error_hi   4.58e-02  5.85e-02  7.38e-02  2.32e-02  1.03e-01  1.03e-01   ph/cm2/s

======================================================================
Image
Pre-slew 15.0-350.0 keV image (Event data)
#   RAcent    DECcent   POSerr    Theta     Phi              Peak Cts       SNR   Name
  290.5431   -64.6003   0.0174    21.2058   -58.5979         0.6764293     11.073 TRIG_00575707

Foreground time interval of the image:
-13.499  17.000 (delta_t =  30.499 [sec])
Background time interval of the image:
Light Curves
Note: The mask-weighted lightcurves have units of either count/det or counts/sec/det, where a det is 0.4 x 0.4 = 0.16 sq cm.
Full-time range; 1 s binning
Other quick-look light curves:
- 64 ms binning (zoomed)
- 16 ms binning (zoomed)
- 8 ms binning (zoomed)
- 2 ms binning (zoomed)
- SN=5 or 10 s binning (full-time range)
- Raw light curve
Spectra
- 64 ms binning (zoomed)
- 16 ms binning (zoomed)
- 8 ms binning (zoomed)
- 2 ms binning (zoomed)
- SN=5 or 10 s binning (full-time range)
- Raw light curve
Spectra
Notes:
- 1) The fitting includes the systematic errors.
- 2) When the burst includes telescope slew time periods, the fitting uses an average response file made from multiple 5-s response files through out the slew time plus single time preiod for the non-slew times, and weighted by the total counts in the corresponding time period using addrmf. An average response file is needed becuase a spectral fit using the pre-slew DRM will introduce some errors in both a spectral shape and a normalization if the PHA file contains a lot of the slew/post-slew time interval.
- 3) For fits to more complicated models (e.g. a power-law over a cutoff power-law), the BAT team has decided to require a chi-square improvement of more than 6 for each extra dof.
Time averaged spectrum fit using the average DRM
Power-law model
Time interval is from -111.000 sec. to   17.000 sec.

Spectral model in power-law:
------------------------------------------------------------
Parameters  : value       lower 90%   higher 90%
Photon index: -1.84237     ( -0.183502   0.177414 )
Norm@50keV  : 1.02773E-03    ( -0.000118106   0.000115936 )
------------------------------------------------------------
#Fit statistic : Chi-Squared =          53.70 using 59 PHA bins.
# Reduced chi-squared =         0.9420 for     57 degrees of freedom
# Null hypothesis probability =   5.998148e-01

Photon flux (15-150 keV)    in 128 sec: 0.144022 ( -0.014019  0.014026 ) ph/cm2/s
Energy fluence (15-150 keV)             : 1.2099e-06 ( -1.38282e-07  1.40803e-07 ) ergs/cm2
Cutoff power-law model
Time interval is from -111.000 sec. to   17.000 sec.
Spectral model in the cutoff power-law:
------------------------------------------------------------
Parameters  : value       lower 90%   higher 90%
Photon index: -1.43617     ( -0.696678   0.85655 )
Epeak [keV] : 59.2018      ( -21.6448 -59.2022 )
Norm@50keV  : 1.75042E-03    ( -0.000809404   0.00366974 )
------------------------------------------------------------
#Fit statistic : Chi-Squared =          52.75 using 59 PHA bins.
# Reduced chi-squared =         0.9419 for     56 degrees of freedom
# Null hypothesis probability =   5.987559e-01

Photon flux (15-150 keV)    in 128 sec: 0.141447 ( -0.014741  0.014704 ) ph/cm2/s
Energy fluence (15-150 keV)             : 1.15383e-06 ( -1.66501e-07  1.69632e-07 ) ergs/cm2
1-s peak spectrum fit
Power-law model
Time interval is from  -55.500 sec. to  -54.500 sec.

Spectral model in power-law:
------------------------------------------------------------
Parameters  : value       lower 90%   higher 90%
Photon index: -1.17453     ( -0.712817   0.796575 )
Norm@50keV  : 2.12742E-03    ( -0.00100097   0.000998274 )
------------------------------------------------------------
#Fit statistic : Chi-Squared =          60.44 using 59 PHA bins.
# Reduced chi-squared =          1.060 for     57 degrees of freedom
# Null hypothesis probability =   3.528376e-01

Photon flux (15-150 keV)    in 1 sec: 0.248563 ( -0.116949  0.120765 ) ph/cm2/s
Energy fluence (15-150 keV)             : 2.17796e-08 ( -1.06648e-08  1.10382e-08 ) ergs/cm2
Cutoff power-law model
Time interval is from  -55.500 sec. to  -54.500 sec.
Spectral model in the cutoff power-law:
------------------------------------------------------------
Parameters  : value       lower 90%   higher 90%
Photon index: 10     ( -9.22575   -10 )
Epeak [keV] : 40.9902      ( -6.13757 28.676 )
Norm@50keV  : 7726.88    ( -7723.39   40907.8 )
------------------------------------------------------------
#Fit statistic : Chi-Squared =          55.54 using 59 PHA bins.
# Reduced chi-squared =         0.9918 for     56 degrees of freedom
# Null hypothesis probability =   4.921770e-01

Photon flux (15-150 keV)    in 1 sec: 0.198287 ( -0.072465  0.102736 ) ph/cm2/s
Energy fluence (15-150 keV)             : 1.20343e-08 ( -4.41649e-09  9.58492e-09 ) ergs/cm2
Time-resolved spectra
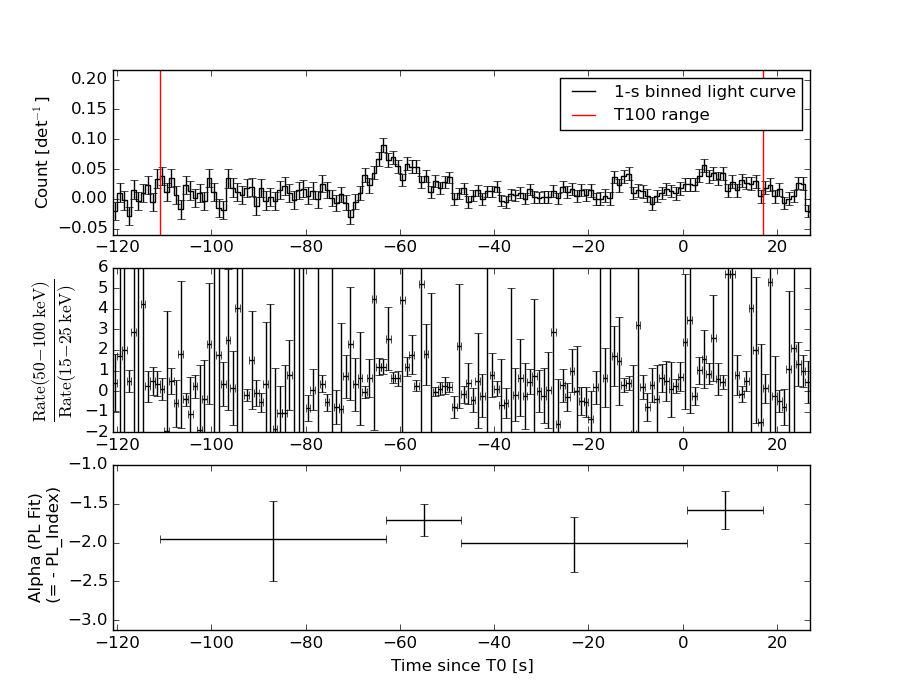
Distribution
T90 vs. Hardness ratio plot
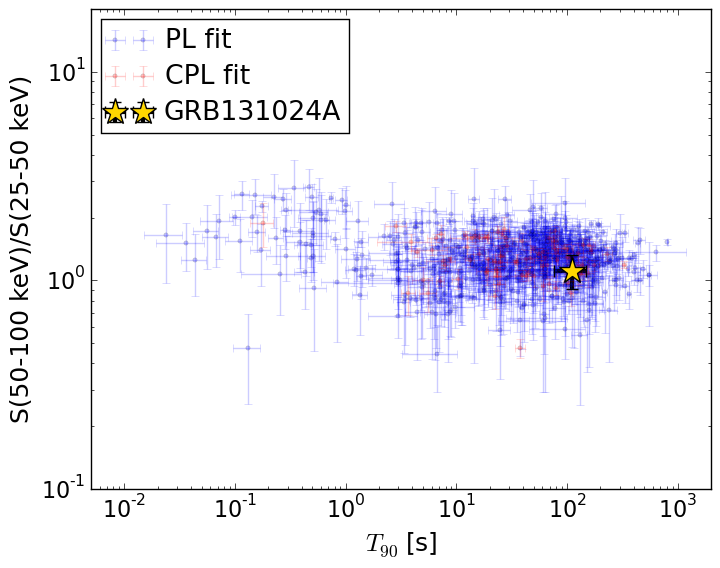
T90                                   = 112.0 sec.
Hardness ratio (energy fluence ratio) = 1.11547562379
S(15-50 keV) vs. S(50-150 keV) plot
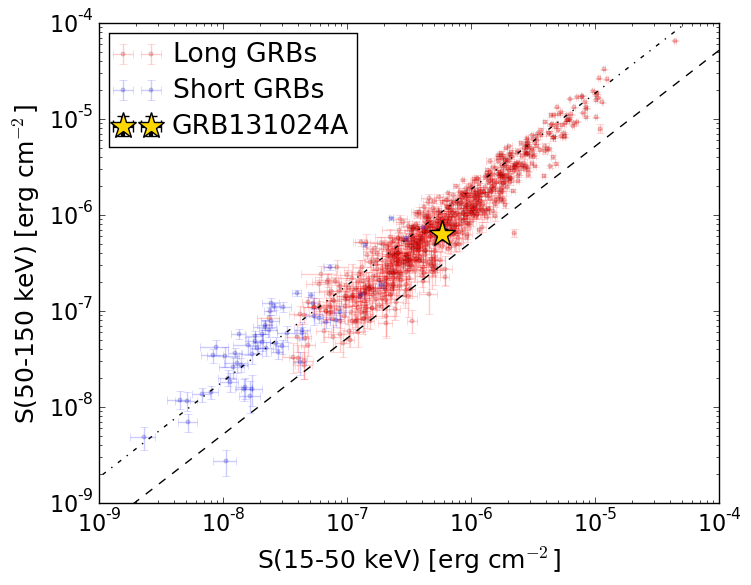
S(15-50 keV)  = 5.77868e-07
S(50-150 keV) = 6.320482e-07
The dash-dotted line and the dashed line traces the fluences calculated from the Band function with Epeak = 15 and 150 keV, respectively. Both lines assume a canonical values of alpha = -1 and beta = -2.5.
Mask shadow pattern
IMX = 2.021591177065915E-01, IMY = 3.311626777814657E-01
Spacecraft aspect plot
Bright source in the pre-burst/pre-slew/post-slew images
Pre-burst image of 15-350 keV band
Time interval of the image:
Pre-slew background subtracted image of 15-350 keV band
Time interval of the image:
-13.499370 17.000000

# RAcent  DECcent POSerr Theta    Phi  PeakCts   SNR AngSep     Name
#  [deg]    [deg]    ['] [deg]  [deg]                   [']
264.7285 -44.4868    3.5  45.4  -48.5  -0.5296  -3.4    2.3	4U 1735-44
275.9577 -30.2676   15.5  52.7  -28.4   0.1423   0.7    6.2	H1820-303
285.1157 -24.8337    5.3  53.8  -16.3  -0.3317  -2.2    6.8	HT1900.1-2455
290.5431 -64.6003    1.0  21.2  -58.6   0.6764  11.1 ------	UNKNOWN
136.8990 -73.0535    1.9  40.9 -137.0   0.6201   6.2 ------	UNKNOWN
Post-slew image of 15-350 keV band
Time interval of the image:
117.500580 963.104500

# RAcent  DECcent POSerr Theta    Phi  PeakCts   SNR AngSep     Name
#  [deg]    [deg]    ['] [deg]  [deg]                   [']
170.3283 -60.6230   10.2  47.1 -147.0  -1.5124  -1.1    0.4	Cen X-3
186.7058 -62.8382    2.9  40.8 -139.7   3.8424   3.9    4.3	GX 301-2
255.9826 -37.8334    1.6  33.6  -56.4   6.1469   7.2    0.7	4U 1700-377
256.5008 -36.5927    7.6  34.5  -54.8   1.3472   1.5   10.7	GX 349+2
263.1345 -24.7628    6.2  43.6  -39.7   1.7945   1.9    6.9	GX 1+4
264.5424 -44.4131    5.7  24.8  -50.6   1.2479   2.0    8.9	4U 1735-44
270.3234 -25.0655    3.4  41.6  -30.5   2.9060   3.5    2.3	GX 5-1
270.2706 -25.7615    3.1  41.0  -30.8   2.9405   3.7    2.1	GRS 1758-258
273.8255 -14.1622    0.0  51.7  -23.2  -0.3939  -0.3   12.9	GX 17+2
275.8392 -30.4105    3.4  35.4  -24.5   2.4012   3.4    5.2	H1820-303
285.1378 -25.0766    0.0  39.7  -10.0  -0.1396  -0.2   10.9	HT1900.1-2455
263.0287 -33.7009    6.7  35.1  -44.2   1.2792   1.7    8.3	GX 354-0
 12.7092 -87.7282    3.7  25.2  172.3   2.0682   3.2 ------	UNKNOWN
284.4920  -7.5570    3.7  57.2   -9.5   7.3270   3.1 ------	UNKNOWN
137.5530 -63.2217    3.1  50.6 -167.0   5.6863   3.7 ------	UNKNOWN
259.0799 -20.5949    2.4  48.7  -42.9   8.4299   4.8 ------	UNKNOWN