Analysis Summary
Notes:
- 1) No attempt has been made to eliminate the non-significant decimal places.
- 2) This batgrbproduct analysis is done using the HEASARC data.
- 3) This batgrbproduct analysis is using the flight position for the mask-weighting calculation.
======================================================================
BAT GRB EVENT DATA PROCESSING REPORT
Process Script Ver: batgrbproduct v2.46
Process Start Time: Wed Jun 10 12:46:02 EDT 2015
Host Name: bat1
Current Working Dir: /local/data/bat1/alien/Swift_3rdBATcatalog/event/batevent_reproc/trigger575754
======================================================================
Trigger: 00575754 Segment: 000
BAT Trigger Time: 404343342.592 [s; MET]
Trigger Stop: 404343346.688 [s; MET]
UTC: 2013-10-24T21:35:31.401340 [includes UTCF correction]
Where From?: TDRSS position message
BAT
RA: 144.402931552422 Dec: 44.2397294748877 [deg; J2000]
Catalogged Source?: NO
Point Source?: YES
GRB Indicated?: YES [ by BAT flight software ]
Image S/N Ratio: 6.93
Image Trigger?: NO
Rate S/N Ratio: 10.770329614269 [ if not an image trigger ]
Image S/N Ratio: 6.93
Analysis Position: [ source = BAT ]
RA: 144.402931552422 Dec: 44.2397294748877 [deg; J2000]
Refined Position: [ source = BAT pre-slew burst ]
RA: 144.473118827521 Dec: 44.2621641391518 [deg; J2000]
{ 09h 37m 53.5s , +44d 15' 43.8" }
+/- 1.84302642275172 [arcmin] (estimated 90% radius based on SNR)
+/- 0.756252295468365 [arcmin] (formal 1-sigma fit error)
SNR: 12.6995279353668
Angular difference between the analysis and refined position is 3.303182 arcmin
Partial Coding Fraction: 0.40625 [ including projection effects ]
Duration
T90: 96.8160000443459 +/- 27.4064459345517
Measured from: -4.77600002288818
to: 92.0400000214577 [s; relative to TRIGTIME]
T50: 41.0239999890327 +/- 13.3243236463996
Measured from: 4.88800001144409
to: 45.9120000004768 [s; relative to TRIGTIME]
Fluence
Peak Flux (peak 1 second)
Measured from: 1.03600001335144
to: 2.03600001335144 [s; relative to TRIGTIME]
Total Fluence
Measured from: -8.28000003099442
to: 101.01599997282 [s; relative to TRIGTIME]
Band 1 Band 2 Band 3 Band 4
15-25 25-50 50-100 100-350 keV
Total 0.460638 0.456605 0.849941 0.249252
0.077233 0.081109 0.073533 0.068567 [error]
Peak 0.008705 0.022576 0.056342 0.017323
0.008394 0.008888 0.008918 0.007983 [error]
[ fluence units of on-axis counts / fully illuminated detector ]
======================================================================
====== Table of the duration information =============================
Value tstart tstop
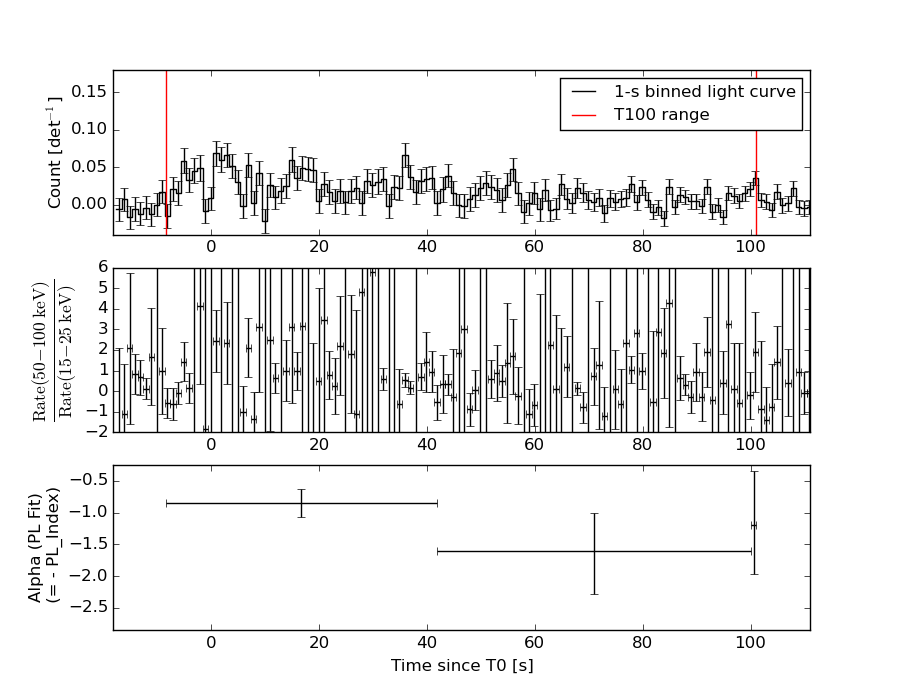
T100 109.296 -8.280 101.016
T90 96.816 -4.776 92.040
T50 41.024 4.888 45.912
Peak 1.000 1.036 2.036
====== Spectral Analysis Summary =====================================
Model : spectral model: simple power-law (PL) and cutoff power-law (CPL)
Ph_index : photon index: E^{Ph_index}
Ph_90err : 90% error of the photon index
Epeak : Epeak in keV
Epeak_90err: 90% error of Epeak
Norm : normalization at 50 keV in both the PL model and CPL model
Nomr_90err : 90% error of the normalization
chi2 : Chi-Squared
dof : degree of freedo
=== Time-averaged spectral analysis ===
(Best model with acceptable fit: PL)
Model Ph_index Ph_90err_low Ph_90err_hi Epeak Epeak_90err_low Epeak_90err_hi Norm Nomr_90err_low Norm_90err_hi chi2 dof
PL -0.998 -0.214 0.222 - - - 1.23e-03 -1.47e-04 1.46e-04 64.080 57
CPL -0.865 -0.329 1.022 513.471 -513.471 -513.471 1.40e-03 -2.82e-04 1.21e-03 64.010 56
=== 1-s peak spectral analysis ===
(Best model with acceptable fit: N/A)
Model Ph_index Ph_90err_low Ph_90err_hi Epeak Epeak_90err_low Epeak_90err_hi Norm Nomr_90err_low Norm_90err_hi chi2 dof
PL -0.570 -0.393 0.446 - - - 6.69e-03 -1.90e-03 1.85e-03 73.270 57
CPL 3.756 -2.575 -3.756 91.671 -19.486 32.676 1.85e-01 -1.85e-01 1.94e+01 65.580 56
=== Fluence/Peak Flux Summary ===
Model Band1 Band2 Band3 Band4 Band5 Total
15-25 25-50 50-100 100-350 15-150 15-350 keV
Fluence PL 1.08e-07 2.70e-07 5.40e-07 2.71e-06 1.46e-06 3.62e-06 erg/cm2
90%_error_low -2.63e-08 -4.08e-08 -6.96e-08 -7.43e-07 -1.82e-07 -7.81e-07 erg/cm2
90%_error_hi 2.88e-08 3.99e-08 6.87e-08 9.35e-07 1.83e-07 9.50e-07 erg/cm2
Peak flux PL 1.14e-01 2.00e-01 2.70e-01 7.48e-01 7.83e-01 1.33e+00 ph/cm2/s
90%_error_low -5.67e-02 -7.19e-02 -6.47e-02 -3.07e-01 -1.98e-01 -3.55e-01 ph/cm2/s
90%_error_hi 7.44e-02 7.43e-02 6.47e-02 4.31e-01 2.02e-01 4.07e-01 ph/cm2/s
Fluence CPL 1.04e-07 2.71e-07 5.48e-07 2.29e-06 1.45e-06 3.20e-06 erg/cm2
90%_error_low -3.69e-08 -4.16e-08 -7.65e-08 -1.44e-06 -1.91e-07 -1.42e-06 erg/cm2
90%_error_hi 2.54e-08 4.24e-08 8.85e-08 9.33e-07 1.85e-07 9.25e-07 erg/cm2
Peak flux CPL 7.72e-03 1.27e-01 4.06e-01 1.15e-01 6.46e-01 6.56e-01 ph/cm2/s
90%_error_low -7.72e-03 -7.51e-02 -1.04e-01 -1.15e-01 -1.74e-01 -1.83e-01 ph/cm2/s
90%_error_hi 6.03e-02 1.14e-01 1.04e-01 1.93e-01 2.06e-01 2.63e-01 ph/cm2/s
======================================================================
Image
Pre-slew 15.0-350.0 keV image (Event data)
#   RAcent    DECcent   POSerr    Theta     Phi              Peak Cts       SNR   Name
  144.4731    44.2622   0.0151    28.2521    82.6909         1.7513642     12.700 TRIG_00575754

Foreground time interval of the image:
 -8.280  49.909 (delta_t =  58.189 [sec])
Background time interval of the image:
-239.592  -8.280 (delta_t = 231.312 [sec])
Light Curves
Note: The mask-weighted lightcurves have units of either count/det or counts/sec/det, where a det is 0.4 x 0.4 = 0.16 sq cm.
Full-time range; 1 s binning
Other quick-look light curves:
- 64 ms binning (zoomed)
- 16 ms binning (zoomed)
- 8 ms binning (zoomed)
- 2 ms binning (zoomed)
- SN=5 or 10 s binning (full-time range)
- Raw light curve
Spectra
- 64 ms binning (zoomed)
- 16 ms binning (zoomed)
- 8 ms binning (zoomed)
- 2 ms binning (zoomed)
- SN=5 or 10 s binning (full-time range)
- Raw light curve
Spectra
Notes:
- 1) The fitting includes the systematic errors.
- 2) When the burst includes telescope slew time periods, the fitting uses an average response file made from multiple 5-s response files through out the slew time plus single time preiod for the non-slew times, and weighted by the total counts in the corresponding time period using addrmf. An average response file is needed becuase a spectral fit using the pre-slew DRM will introduce some errors in both a spectral shape and a normalization if the PHA file contains a lot of the slew/post-slew time interval.
- 3) For fits to more complicated models (e.g. a power-law over a cutoff power-law), the BAT team has decided to require a chi-square improvement of more than 6 for each extra dof.
Time averaged spectrum fit using the average DRM
Power-law model
Time interval is from   -8.280 sec. to  101.016 sec.

Spectral model in power-law:
------------------------------------------------------------
Parameters  : value       lower 90%   higher 90%
Photon index: -0.998425     ( -0.21367   0.221691 )
Norm@50keV  : 1.23326E-03    ( -0.000147436   0.000146264 )
------------------------------------------------------------
#Fit statistic : Chi-Squared =          64.08 using 59 PHA bins.
# Reduced chi-squared =          1.124 for     57 degrees of freedom
# Null hypothesis probability =   2.421515e-01

Photon flux (15-150 keV)    in 109.3 sec: 0.141972 ( -0.017301  0.017409 ) ph/cm2/s
Energy fluence (15-150 keV)             : 1.45858e-06 ( -1.8199e-07  1.82997e-07 ) ergs/cm2
Cutoff power-law model
Time interval is from   -8.280 sec. to  101.016 sec.
Spectral model in the cutoff power-law:
------------------------------------------------------------
Parameters  : value       lower 90%   higher 90%
Photon index: -0.865113     ( -0.328748   1.02251 )
Epeak [keV] : 513.471      ( -515.436 -515.436 )
Norm@50keV  : 1.40260E-03    ( -0.000282275   0.00120944 )
------------------------------------------------------------
#Fit statistic : Chi-Squared =          64.01 using 59 PHA bins.
# Reduced chi-squared =          1.143 for     56 degrees of freedom
# Null hypothesis probability =   2.159257e-01

Photon flux (15-150 keV)    in 109.3 sec: 0.140977 ( -0.018594  0.01717 ) ph/cm2/s
Energy fluence (15-150 keV)             : 1.45064e-06 ( -1.91077e-07  1.85498e-07 ) ergs/cm2
1-s peak spectrum fit
Power-law model
Time interval is from    1.036 sec. to    2.036 sec.

Spectral model in power-law:
------------------------------------------------------------
Parameters  : value       lower 90%   higher 90%
Photon index: -0.570049     ( -0.394375   0.444178 )
Norm@50keV  : 6.68617E-03    ( -0.0019029   0.00184873 )
------------------------------------------------------------
#Fit statistic : Chi-Squared =          73.27 using 59 PHA bins.
# Reduced chi-squared =          1.285 for     57 degrees of freedom
# Null hypothesis probability =   7.213927e-02

Photon flux (15-150 keV)    in 1 sec: 0.783451 ( -0.198339  0.20204 ) ph/cm2/s
Energy fluence (15-150 keV)             : 8.67721e-08 ( -2.12738e-08  2.13464e-08 ) ergs/cm2
Cutoff power-law model
Time interval is from    1.036 sec. to    2.036 sec.
Spectral model in the cutoff power-law:
------------------------------------------------------------
Parameters  : value       lower 90%   higher 90%
Photon index: 5.73035     ( -5.01646   -6.19823 )
Epeak [keV] : 85.2529      ( -12.1981 39.9639 )
Norm@50keV  : 0.779664    ( -0.752959   18.8495 )
------------------------------------------------------------
#Fit statistic : Chi-Squared =          65.04 using 59 PHA bins.
# Reduced chi-squared =          1.161 for     56 degrees of freedom
# Null hypothesis probability =   1.908980e-01

Photon flux (15-150 keV)    in 1 sec: 0.646072 ( -0.173968  0.205917 ) ph/cm2/s
Energy fluence (15-150 keV)             : 7.54779e-08 ( -2.15926e-08  2.36806e-08 ) ergs/cm2
Time-resolved spectra
Distribution
T90 vs. Hardness ratio plot

T90                                   = 96.816 sec.
Hardness ratio (energy fluence ratio) = 2.00221107256
S(15-50 keV) vs. S(50-150 keV) plot

S(15-50 keV)  = 3.776539e-07
S(50-150 keV) = 1.080924e-06
The dash-dotted line and the dashed line traces the fluences calculated from the Band function with Epeak = 15 and 150 keV, respectively. Both lines assume a canonical values of alpha = -1 and beta = -2.5.
Mask shadow pattern

IMX = 6.836518183555379E-02, IMY = -5.329999211614854E-01
Spacecraft aspect plot

Bright source in the pre-burst/pre-slew/post-slew images
Pre-burst image of 15-350 keV band
Time interval of the image:
-239.592000 -8.280000

# RAcent  DECcent POSerr Theta    Phi  PeakCts   SNR AngSep     Name
#  [deg]    [deg]    ['] [deg]  [deg]                   [']
196.6204  71.9814    2.7  46.1  139.1   3.2029   4.3 ------	UNKNOWN
Pre-slew background subtracted image of 15-350 keV band
Time interval of the image:
-8.280000 49.908590

# RAcent  DECcent POSerr Theta    Phi  PeakCts   SNR AngSep     Name
#  [deg]    [deg]    ['] [deg]  [deg]                   [']
144.4731  44.2622    0.9  28.3   82.7   1.7514  12.7 ------	UNKNOWN
181.6487   1.7540    2.1  27.2  -69.7   0.5959   5.4 ------	UNKNOWN
151.2967 -20.5758    2.3  52.7  -24.8   1.3054   5.0 ------	UNKNOWN
149.3349 -22.0792    2.1  54.8  -23.6   1.6362   5.5 ------	UNKNOWN
Post-slew image of 15-350 keV band
Time interval of the image:
99.708580 720.508620

# RAcent  DECcent POSerr Theta    Phi  PeakCts   SNR AngSep     Name
#  [deg]    [deg]    ['] [deg]  [deg]                   [']
206.3526  76.0735    2.7  40.7  172.9   2.4521   4.2 ------	UNKNOWN
145.1234  31.7362    2.7  12.5  -28.8   1.4402   4.2 ------	UNKNOWN