Analysis Summary
Notes:
- 1) No attempt has been made to eliminate the non-significant decimal places.
- 2) This batgrbproduct analysis is done using the HEASARC data.
- 3) This batgrbproduct analysis is using the flight position for the mask-weighting calculation.
==========================================================================
BAT GROUND-DETECTED GRB DATA PROCESSING REPORT
(This burst occurred during telescope slew)
Process Script Ver: batgrbproduct v2.46
Process Start Time: Sat Nov 8 12:14:36 EST 2014
Host Name: bat1
Current Working Dir: /local/data/bat1/alien/Swift_3rdBATcatalog/event/batevent_reproc/GRB131110A
======================================================================
Trigger: 00020326 Segment: 002
BAT Trigger Time: 405777212.8
UTC: 2013-11-10T11:53:21.543 [includes UTCF correction]
Where From?: Ground analysis (best_duration.txt)
NOTE: BAT trigger time for ground-detected burst during slew is the T100 start time.
Refined Position: [ source = BAT mosaic image ]
RA: 69.2681011576159 Dec: -17.2587518704512 [deg; J2000]
{ 04h 37m 04.3s , -17d -15' -31.5" }
+/- 0.839810541379 [arcmin] (estimated 90% radius based on SNR)
SNR: 39.0380031995
Angular difference between the analysis and refined position is Usage: arcmin
Partial Coding Fraction: Unavailable because the burst occurred during slew.
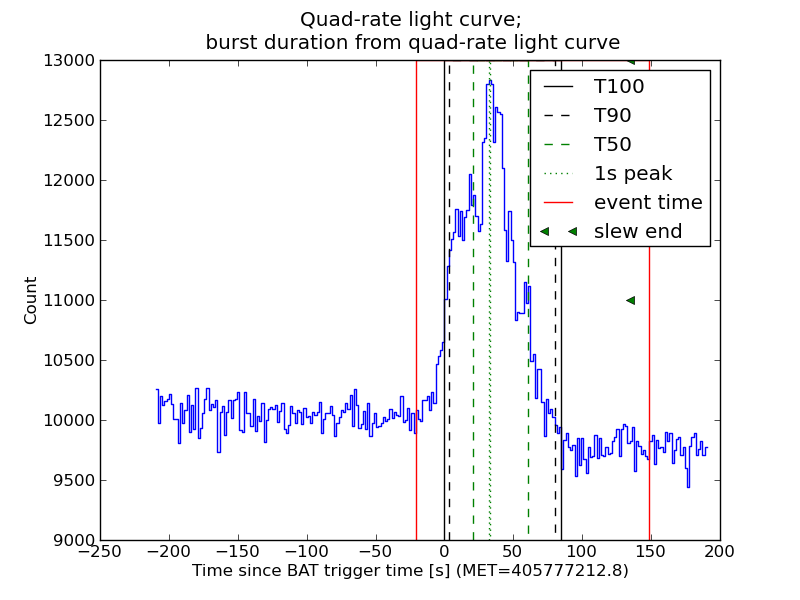
Duration
T90: 76.8000000119209 +/- 1.6
Measured from: 3.2
to: 80 [s; relative to TRIGTIME]
T50: 40. +/- 1.60000002384186
Measured from: 20.8
to: 60.8 [s; relative to TRIGTIME]
====== Table of the duration information =============================
Value tstart tstop
T100 84.800 0.000 84.800
T90 76.800 3.200 80.000
T50 40.000 20.800 60.800
Peak 1.000 32.300 33.300
====== Spectral Analysis Summary =====================================
Model : spectral model: simple power-law (PL) and cutoff power-law (CPL)
Ph_index : photon index: E^{Ph_index}
Ph_90err : 90% error of the photon index
Epeak : Epeak in keV
Epeak_90err: 90% error of Epeak
Norm : normalization at 50 keV in both the PL model and CPL model
Nomr_90err : 90% error of the normalization
chi2 : Chi-Squared
dof : degree of freedo
=== Time-averaged spectral analysis ===
(Best model with acceptable fit: PL)
Model Ph_index Ph_90err_low Ph_90err_hi Epeak Epeak_90err_low Epeak_90err_hi Norm Nomr_90err_low Norm_90err_hi chi2 dof
PL -1.670 -0.095 0.094 - - - 4.38e-03 -2.34e-04 2.33e-04 58.430 57
CPL -1.392 -0.320 0.416 109.039 -38.515 -109.039 6.03e-03 -2.09e-03 3.64e-03 56.920 56
=== 1-s peak spectral analysis ===
(Best model with acceptable fit: PL)
Model Ph_index Ph_90err_low Ph_90err_hi Epeak Epeak_90err_low Epeak_90err_hi Norm Nomr_90err_low Norm_90err_hi chi2 dof
PL -1.102 -0.300 0.311 - - - 7.65e-03 -1.28e-03 1.27e-03 56.150 57
CPL -0.992 -4.243 1.137 536.904 -536.904 -536.904 8.55e-03 -2.12e-03 1.55e-02 56.190 56
=== Fluence/Peak Flux Summary ===
Model Band1 Band2 Band3 Band4 Band5 Total
15-25 25-50 50-100 100-350 15-150 15-350 keV
Fluence PL 5.56e-07 9.21e-07 1.16e-06 2.90e-06 3.44e-06 5.53e-06 erg/cm2
90%_error_low -4.88e-08 -4.90e-08 -8.25e-08 -4.23e-07 -1.94e-07 -4.91e-07 erg/cm2
90%_error_hi 5.03e-08 4.89e-08 8.24e-08 4.69e-07 1.95e-07 5.26e-07 erg/cm2
Peak flux PL 2.15e-01 2.75e-01 2.56e-01 4.19e-01 8.88e-01 1.17e+00 ph/cm2/s
90%_error_low -7.05e-02 -5.83e-02 -4.75e-02 -1.49e-01 -1.53e-01 -2.03e-01 ph/cm2/s
90%_error_hi 7.95e-02 5.65e-02 4.66e-02 1.96e-01 1.54e-01 2.10e-01 ph/cm2/s
Fluence CPL 5.29e-07 9.45e-07 1.17e-06 1.91e-06 3.37e-06 4.56e-06 erg/cm2
90%_error_low -6.05e-08 -5.87e-08 -8.72e-08 -7.92e-07 -2.22e-07 -8.22e-07 erg/cm2
90%_error_hi 6.16e-08 5.98e-08 8.84e-08 1.12e-06 2.21e-07 1.17e-06 erg/cm2
Peak flux CPL 2.16e-01 2.75e-01 2.55e-01 4.17e-01 8.89e-01 1.18e+00 ph/cm2/s
90%_error_low -7.13e-02 -5.83e-02 -4.70e-02 N/A -1.61e-01 -3.49e-01 ph/cm2/s
90%_error_hi 7.87e-02 5.92e-02 5.98e-02 N/A 1.52e-01 1.84e-01 ph/cm2/s
======================================================================
Image
Note1: The mosaic image is made with timebin = 0.50 s; energybin = 15-350 keV
Note2: The mosaic image uses Galactic coordinate.
#RAcent DECcent POSerr Theta  Phi  Peak_Cts  SNR Name
69.268 -17.259 0.002 46.316 137.253 0.056 39.038 UNKNOWN

Image time interval: 0.000 to 84.800 [sec]
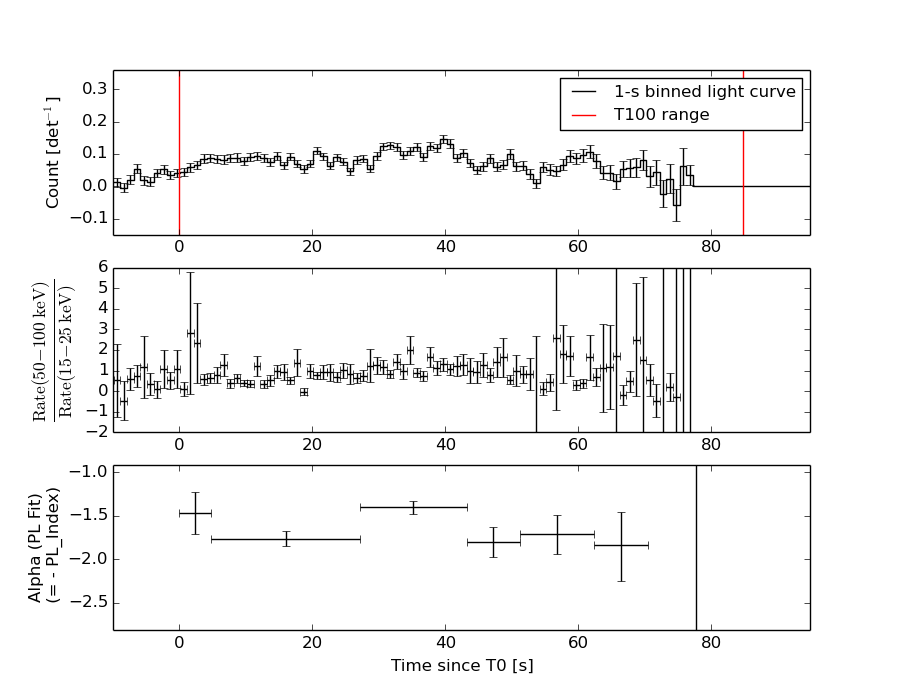
Light Curves
Note: The mask-weighted lightcurves have units of either count/det or counts/sec/det, where a det is 0.4 x 0.4 = 0.16 sq cm.
Best duration plot
Full-time range; 1 s binning
Other quick-look light curves:
- 64 ms binning (zoomed)
- 16 ms binning (zoomed)
- 8 ms binning (zoomed)
- 2 ms binning (zoomed)
- SN=5 or 10 s binning (full-time range)
- Raw light curve
Spectra
- 64 ms binning (zoomed)
- 16 ms binning (zoomed)
- 8 ms binning (zoomed)
- 2 ms binning (zoomed)
- SN=5 or 10 s binning (full-time range)
- Raw light curve
Spectra
Notes:
- 1) The fitting includes the systematic errors.
- 2) When the burst includes telescope slew time periods, the fitting uses an average response file made from multiple 5-s response files through out the slew time plus single time preiod for the non-slew times, and weighted by the total counts in the corresponding time period using addrmf. An average response file is needed becuase a spectral fit using the pre-slew DRM will introduce some errors in both a spectral shape and a normalization if the PHA file contains a lot of the slew/post-slew time interval.
- 3) For fits to more complicated models (e.g. a power-law over a cutoff power-law), the BAT team has decided to require a chi-square improvement of more than 6 for each extra dof.
Time averaged spectrum fit using the average DRM
Power-law model
Time interval is from    0.000 sec. to   84.800 sec.

Spectral model in power-law:
------------------------------------------------------------
Parameters  : value       lower 90%   higher 90%
Photon index: -1.66968     ( -0.0953937   0.0943658 )
Norm@50keV  : 4.37574E-03    ( -0.000233553   0.000232541 )
------------------------------------------------------------
#Fit statistic : Chi-Squared =          58.43 using 59 PHA bins.
# Reduced chi-squared =          1.025 for     57 degrees of freedom
# Null hypothesis probability =   4.225705e-01

Photon flux (15-150 keV)    in 84.8 sec: 0.575149 ( -0.030632  0.0307 ) ph/cm2/s
Energy fluence (15-150 keV)             : 3.44497e-06 ( -1.93833e-07  1.94979e-07 ) ergs/cm2
Cutoff power-law model
Time interval is from    0.000 sec. to   84.800 sec.
Spectral model in the cutoff power-law:
------------------------------------------------------------
Parameters  : value       lower 90%   higher 90%
Photon index: -1.39242     ( -0.320283   0.41564 )
Epeak [keV] : 109.039      ( -38.5195 -109.044 )
Norm@50keV  : 6.03481E-03    ( -0.00208525   0.00364414 )
------------------------------------------------------------
#Fit statistic : Chi-Squared =          56.92 using 59 PHA bins.
# Reduced chi-squared =          1.016 for     56 degrees of freedom
# Null hypothesis probability =   4.405203e-01

Photon flux (15-150 keV)    in 84.8 sec: 0.565737 ( -0.033212  0.03321 ) ph/cm2/s
Energy fluence (15-150 keV)             : 3.36842e-06 ( -2.21858e-07  2.21016e-07 ) ergs/cm2
1-s peak spectrum fit
Power-law model

Time interval is from   32.300 sec. to   33.300 sec.

Spectral model in power-law:
------------------------------------------------------------
Parameters  : value       lower 90%   higher 90%
Photon index: -1.10224     ( -0.300011   0.31115 )
Norm@50keV  : 7.65253E-03    ( -0.00127583   0.00127078 )
------------------------------------------------------------
#Fit statistic : Chi-Squared =          56.15 using 59 PHA bins.
# Reduced chi-squared =         0.9851 for     57 degrees of freedom
# Null hypothesis probability =   5.069617e-01

Photon flux (15-150 keV)    in 1 sec: 0.887836 ( -0.152984  0.153854 ) ph/cm2/s
Energy fluence (15-150 keV)             : 7.99613e-08 ( -1.43634e-08  1.44622e-08 ) ergs/cm2
Cutoff power-law model
Time interval is from   32.300 sec. to   33.300 sec.
Spectral model in the cutoff power-law:
------------------------------------------------------------
Parameters  : value       lower 90%   higher 90%
Photon index: -1.09684     ( -4.23171   1.14809 )
Epeak [keV] : 9998.39      ( -9998.42 -9998.42 )
Norm@50keV  : 7.69381E-03    ( -0.00126869   0.0163359 )
------------------------------------------------------------
#Fit statistic : Chi-Squared =          56.15 using 59 PHA bins.
# Reduced chi-squared =          1.003 for     56 degrees of freedom
# Null hypothesis probability =   4.692263e-01

Photon flux (15-150 keV)    in 1 sec: 0.888871 ( -0.161075  0.152449 ) ph/cm2/s
Energy fluence (15-150 keV)             : 7.99687e-08 ( -1.47128e-08  1.33116e-08 ) ergs/cm2
Time-resolved spectra
Distribution
T90 vs. Hardness ratio plot
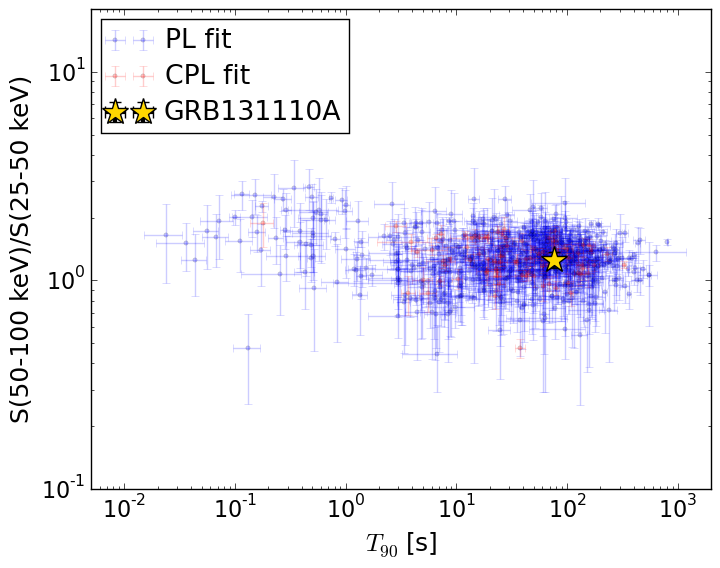
T90                                   = 76.8 sec.
Hardness ratio (energy fluence ratio) = 1.25733237357
S(15-50 keV) vs. S(50-150 keV) plot
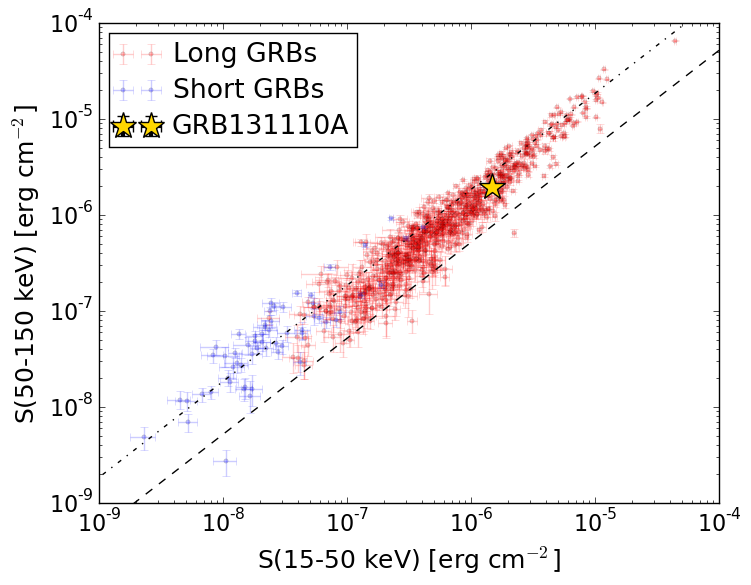
S(15-50 keV)  = 1.4764866e-06
S(50-150 keV) = 1.9685113e-06
The dash-dotted line and the dashed line traces the fluences calculated from the Band function with Epeak = 15 and 150 keV, respectively. Both lines assume a canonical values of alpha = -1 and beta = -2.5.
Mask shadow pattern
Mask shadow pattern unavailable because this burst occurs during telescope slews.Spacecraft aspect plot