Analysis Summary
Notes:
- 1) No attempt has been made to eliminate the non-significant decimal places.
- 2) This batgrbproduct analysis is done using the HEASARC data.
- 3) This batgrbproduct analysis is using the flight position for the mask-weighting calculation.
======================================================================
                  BAT GRB EVENT DATA PROCESSING REPORT
    Process Script Ver: batgrbproduct v2.46
    Process Start Time: Sat Jan 11 22:16:56 EST 2014
             Host Name: batevent1
   Current Working Dir: /local/data/batevent/batevent_reproc/trigger577968
======================================================================

  Trigger: 00577968      Segment: 000

  BAT Trigger Time: 406341256   [s; MET]
      Trigger Stop: 406341257.024   [s; MET]
               UTC: 2013-11-17T00:34:04.717400    [includes UTCF correction]
       Where From?: TDRSS position message

  BAT
    RA: 332.339311275174   Dec: -31.7223097661789  [deg; J2000]

     Catalogged Source?: NO
     Point Source?:      YES
     GRB Indicated?:     YES    [ by BAT flight software ]
     Image S/N Ratio:    6.87
     Image Trigger?:     NO
     Rate S/N Ratio:     11.916375287813  [ if not an image trigger ]
     Image S/N Ratio:    6.87

  Analysis Position:   [ source = BAT ]
    RA: 332.339311275174   Dec: -31.7223097661789  [deg; J2000]

  Refined Position:   [ source = BAT pre-slew burst ]
    RA: 332.3502675072   Dec: -31.7616106408069  [deg; J2000]
        { 22h 09m 24.1s , -31d 45' 41.8" }
         +/- 1.71880751002449 [arcmin] (estimated 90% radius based on SNR)
         +/- 0.742810333980982 [arcmin] (formal 1-sigma fit error)
    SNR: 14.0307039809489

  Angular difference between the analysis and refined position is 2.423416 arcmin

  Partial Coding Fraction: 0.859375    [ including projection effects ]

  Duration
     T90: 10.8799999952316 +/- 2.81163301773906
        Measured from: 0.0400000214576721
                   to: 10.9200000166893     [s; relative to TRIGTIME]
     T50: 4.1599999666214 +/- 1.17662566602415
        Measured from: 1.5120000243187
                   to: 5.67199999094009     [s; relative to TRIGTIME]


  Fluence
     Peak Flux  (peak 1 second)
        Measured from: -0.236000001430511
                   to: 0.763999998569489     [s; relative to TRIGTIME]
     Total Fluence
        Measured from: -0.472000002861023
                   to: 11.944000005722     [s; relative to TRIGTIME]

             Band 1     Band 2     Band 3     Band 4
              15-25      25-50     50-100    100-350     keV
 Total     0.178468   0.253262   0.094479   0.001851
           0.019697   0.020269   0.017303   0.014739 [error]
 Peak      0.022526   0.037075   0.023699  -0.002377
           0.005761   0.006114   0.005120   0.004198 [error]

     [ fluence units of on-axis counts / fully illuminated detector ]

======================================================================


====== Table of the duration information =============================

        Value   tstart    tstop
T100   12.416   -0.472   11.944
T90    10.880    0.040   10.920
T50     4.160    1.512    5.672
Peak    1.000   -0.236    0.764


====== Spectral Analysis Summary =====================================

Model      : spectral model: simple power-law (PL) and cutoff power-law (CPL)
Ph_index   : photon index: E^{Ph_index}
Ph_90err   : 90% error of the photon index
Epeak      : Epeak in keV
Epeak_90err: 90% error of Epeak
Norm       : normalization at 50 keV in both the PL model and CPL model
Nomr_90err : 90% error of the normalization
chi2       : Chi-Squared
dof        : degree of freedo

=== Time-averaged spectral analysis ===
(Best model with acceptable fit: PL)

Model Ph_index Ph_90err_low Ph_90err_hi  Epeak  Epeak_90err_low  Epeak_90err_hi  Norm       Nomr_90err_low    Norm_90err_hi    chi2    dof
PL      -1.806    -0.182      0.176       -           -               -         2.60e-03     -3.24e-04          3.19e-04      52.530   57
CPL      0.171    -1.099      1.607       44.352      -5.964        10.428      3.73e-02     -3.73e-02          3.03e-01      40.700   56


=== 1-s peak spectral analysis ===
(Best model with acceptable fit: PL)

Model Ph_index Ph_90err_low Ph_90err_hi  Epeak  Epeak_90err_low  Epeak_90err_hi  Norm       Nomr_90err_low    Norm_90err_hi    chi2    dof
PL      -1.579     -0.312     0.299       -           -               -         5.21e-03     -1.13e-03          1.11e-03      60.310   57
CPL      0.954     -1.633     2.577       53.724     -10.153        20.836      1.18e-01     -1.18e-01          2.58e+00      51.980   56


=== Fluence/Peak Flux Summary ===

              Model    Band1     Band2     Band3     Band4     Band5     Total
                       15-25     25-50    50-100    100-350    15-150    15-350    keV
Fluence         PL   5.51e-08  8.40e-08  9.61e-08  2.10e-07  2.98e-07  4.46e-07   erg/cm2
      90%_error_low -8.03e-09 -8.84e-09 -1.57e-08 -6.08e-08 -3.73e-08 -7.95e-08   erg/cm2
      90%_error_hi   8.21e-09  8.84e-09  1.60e-08  7.53e-08  3.80e-08  9.10e-08   erg/cm2
Peak flux       PL   2.31e-01  2.22e-01  1.49e-01  1.56e-01  6.65e-01  7.57e-01   ph/cm2/s
      90%_error_low -6.55e-02 -4.55e-02 -3.91e-02 -6.59e-02 -1.34e-01 -1.56e-01   ph/cm2/s
      90%_error_hi   6.98e-02  4.54e-02  3.94e-02  8.81e-02  1.34e-01  1.58e-01   ph/cm2/s

Fluence        CPL   4.72e-08  1.05e-07  8.27e-08  1.57e-08  2.48e-07  2.50e-07   erg/cm2
      90%_error_low -9.77e-09 -1.40e-08 -2.44e-08    N/A    -3.71e-08 -3.89e-08   erg/cm2
      90%_error_hi   9.59e-09  1.48e-08  2.24e-08    N/A     4.23e-08  5.50e-08   erg/cm2
Peak flux      CPL   1.62e-01  2.86e-01  1.65e-01  2.00e-02  6.32e-01  6.33e-01   ph/cm2/s
      90%_error_low -7.68e-02 -6.31e-02 -5.40e-02 -2.00e-02 -1.34e-01 -1.35e-01   ph/cm2/s
      90%_error_hi   8.25e-02  6.74e-02  5.19e-02  5.03e-02  1.35e-01  1.39e-01   ph/cm2/s

======================================================================
Image
Pre-slew 15.0-350.0 keV image (Event data)
#   RAcent    DECcent   POSerr    Theta     Phi              Peak Cts       SNR   Name
  332.3503   -31.7616   0.0137    16.4117    48.8996         0.4802669     14.031 TRIG_00577968

Foreground time interval of the image:
 -0.472  10.701 (delta_t =  11.173 [sec])
Background time interval of the image:
-239.000  -0.472 (delta_t = 238.528 [sec])
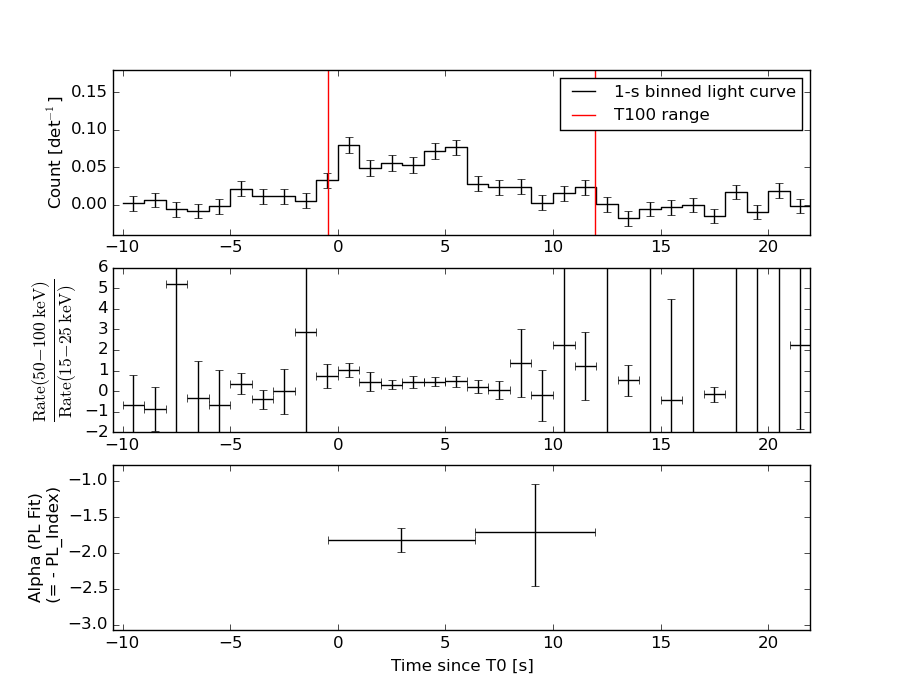
Light Curves
Note: The mask-weighted lightcurves have units of either count/det or counts/sec/det, where a det is 0.4 x 0.4 = 0.16 sq cm.
Full-time range; 1 s binning
Other quick-look light curves:
- 64 ms binning (zoomed)
- 16 ms binning (zoomed)
- 8 ms binning (zoomed)
- 2 ms binning (zoomed)
- SN=5 or 10 s binning (full-time range)
- Raw light curve
Spectra
- 64 ms binning (zoomed)
- 16 ms binning (zoomed)
- 8 ms binning (zoomed)
- 2 ms binning (zoomed)
- SN=5 or 10 s binning (full-time range)
- Raw light curve
Spectra
Notes:
- 1) The fitting includes the systematic errors.
- 2) When the burst includes telescope slew time periods, the fitting uses an average response file made from multiple 5-s response files through out the slew time plus single time preiod for the non-slew times, and weighted by the total counts in the corresponding time period using addrmf. An average response file is needed becuase a spectral fit using the pre-slew DRM will introduce some errors in both a spectral shape and a normalization if the PHA file contains a lot of the slew/post-slew time interval.
- 3) For fits to more complicated models (e.g. a power-law over a cutoff power-law), the BAT team has decided to require a chi-square improvement of more than 6 for each extra dof.
Time averaged spectrum fit using the average DRM
Power-law model
Time interval is from   -0.472 sec. to   11.944 sec.

Spectral model in power-law:
------------------------------------------------------------
Parameters  : value       lower 90%   higher 90%
Photon index: -1.80568     ( -0.182261   0.175531 )
Norm@50keV  : 2.60469E-03    ( -0.000323883   0.000319202 )
------------------------------------------------------------
#Fit statistic : Chi-Squared =          52.53 using 59 PHA bins.
# Reduced chi-squared =         0.9215 for     57 degrees of freedom
# Null hypothesis probability =   6.434044e-01

Photon flux (15-150 keV)    in 12.42 sec: 0.359734 ( -0.037859  0.037864 ) ph/cm2/s
Energy fluence (15-150 keV)             : 2.97804e-07 ( -3.7284e-08  3.80273e-08 ) ergs/cm2
Cutoff power-law model
Time interval is from   -0.472 sec. to   11.944 sec.
Spectral model in the cutoff power-law:
------------------------------------------------------------
Parameters  : value       lower 90%   higher 90%
Photon index: 0.170574     ( -1.10849   1.59789 )
Epeak [keV] : 44.3520      ( -5.89787 10.4941 )
Norm@50keV  : 3.73037E-02    ( -0.0382576   0.30186 )
------------------------------------------------------------
#Fit statistic : Chi-Squared =          40.70 using 59 PHA bins.
# Reduced chi-squared =         0.7268 for     56 degrees of freedom
# Null hypothesis probability =   9.380488e-01

Photon flux (15-150 keV)    in 12.42 sec: 0.338457 ( -0.039338  0.039334 ) ph/cm2/s
Energy fluence (15-150 keV)             : 2.48091e-07 ( -3.71154e-08  4.2326e-08 ) ergs/cm2
1-s peak spectrum fit
Power-law model
Time interval is from   -0.236 sec. to    0.764 sec.

Spectral model in power-law:
------------------------------------------------------------
Parameters  : value       lower 90%   higher 90%
Photon index: -1.57859     ( -0.312324   0.298384 )
Norm@50keV  : 5.20681E-03    ( -0.00112725   0.00111371 )
------------------------------------------------------------
#Fit statistic : Chi-Squared =          60.31 using 59 PHA bins.
# Reduced chi-squared =          1.058 for     57 degrees of freedom
# Null hypothesis probability =   3.569044e-01

Photon flux (15-150 keV)    in 1 sec: 0.664740 ( -0.134323  0.134405 ) ph/cm2/s
Energy fluence (15-150 keV)             : 4.88427e-08 ( -1.11472e-08  1.14133e-08 ) ergs/cm2
Cutoff power-law model
Time interval is from   -0.236 sec. to    0.764 sec.
Spectral model in the cutoff power-law:
------------------------------------------------------------
Parameters  : value       lower 90%   higher 90%
Photon index: 0.953613     ( -1.63426   2.57552 )
Epeak [keV] : 53.7241      ( -10.15 20.8399 )
Norm@50keV  : 0.118072    ( -0.11829   2.57792 )
------------------------------------------------------------
#Fit statistic : Chi-Squared =          51.98 using 59 PHA bins.
# Reduced chi-squared =         0.9283 for     56 degrees of freedom
# Null hypothesis probability =   6.276191e-01

Photon flux (15-150 keV)    in 1 sec: 0.631602 ( -0.134033  0.134968 ) ph/cm2/s
Energy fluence (15-150 keV)             : 4.27514e-08 ( -1.01294e-08  1.13091e-08 ) ergs/cm2
Time-resolved spectra
Distribution
T90 vs. Hardness ratio plot
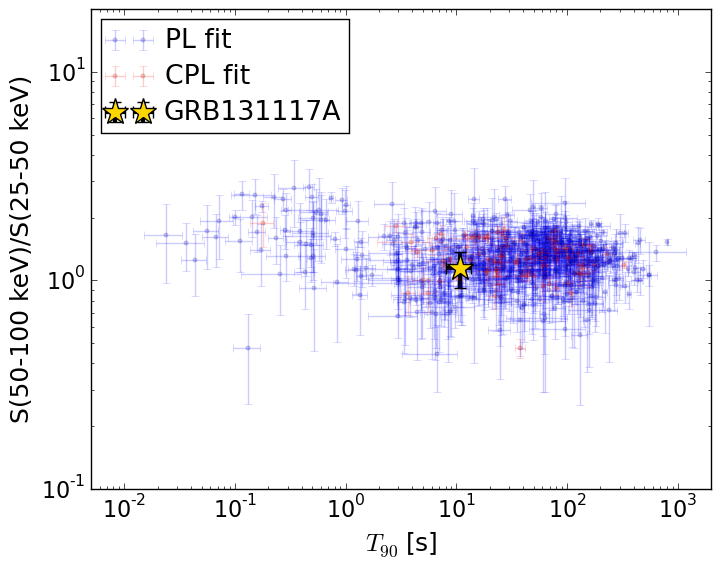
T90                                   = 10.88 sec.
Hardness ratio (energy fluence ratio) = 1.14419490809
S(15-50 keV) vs. S(50-150 keV) plot
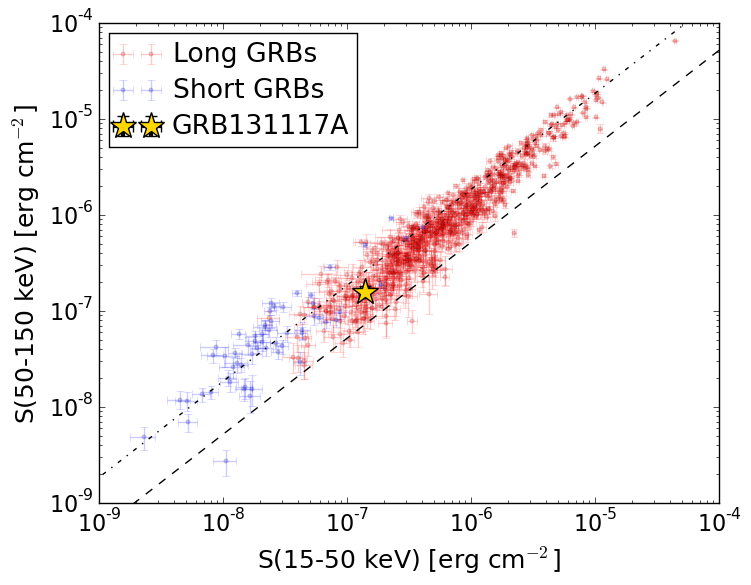
S(15-50 keV)  = 1.3911111e-07
S(50-150 keV) = 1.586946e-07
The dash-dotted line and the dashed line traces the fluences calculated from the Band function with Epeak = 15 and 150 keV, respectively. Both lines assume a canonical values of alpha = -1 and beta = -2.5.
Mask shadow pattern
IMX = 1.936229680931073E-01, IMY = -2.219509725843758E-01
Spacecraft aspect plot
Bright source in the pre-burst/pre-slew/post-slew images
Pre-burst image of 15-350 keV band
Time interval of the image:
-239.000000 -0.472000

# RAcent  DECcent POSerr Theta    Phi  PeakCts   SNR AngSep     Name
#  [deg]    [deg]    ['] [deg]  [deg]                   [']
265.0006 -44.3917    0.0  40.5  -84.7  -1.8837  -2.1   11.6	4U 1735-44
276.0622 -30.2429   20.8  40.5  -59.0   0.2989   0.6   10.3	H1820-303
285.0116 -24.9561   80.2  38.1  -44.4  -0.0433  -0.1    2.5	HT1900.1-2455
341.5814  -4.2270    2.6  45.3   48.7   3.4616   4.5 ------	UNKNOWN
315.9188  -0.9278    3.0  46.6   12.5   1.5347   3.9 ------	UNKNOWN
 73.2076 -63.7450    2.5  56.1  173.9   5.4577   4.6 ------	UNKNOWN
304.3507  -1.0840    2.9  49.1   -2.7   1.5861   4.1 ------	UNKNOWN
259.1652 -52.1655    3.3  41.1  -98.0   3.5003   3.5 ------	UNKNOWN
Pre-slew background subtracted image of 15-350 keV band
Time interval of the image:
-0.472000 10.700600

# RAcent  DECcent POSerr Theta    Phi  PeakCts   SNR AngSep     Name
#  [deg]    [deg]    ['] [deg]  [deg]                   [']
264.6562 -44.5494   26.0  40.7  -85.1   0.0612   0.4    7.0	4U 1735-44
276.0834 -30.4038    5.0  40.4  -59.2   0.1858   2.3    8.5	H1820-303
285.0179 -24.7862   12.0  38.2  -44.3   0.0533   1.0    8.1	HT1900.1-2455
332.3503 -31.7616    0.8  16.4   48.9   0.4802  14.0 ------	UNKNOWN
 20.5372 -84.8007    2.1  40.3 -162.5   0.2641   5.5 ------	UNKNOWN
Post-slew image of 15-350 keV band
Time interval of the image:
49.900610 685.900600

# RAcent  DECcent POSerr Theta    Phi  PeakCts   SNR AngSep     Name
#  [deg]    [deg]    ['] [deg]  [deg]                   [']
285.1016 -24.8487    4.9  41.8  -71.5  -4.4126  -2.4    5.6	HT1900.1-2455
 38.8105 -78.4109    3.2  54.3 -171.7   4.7951   3.6 ------	UNKNOWN
290.9302 -25.8021    3.3  36.5  -70.0   3.0620   3.6 ------	UNKNOWN
281.8027 -42.2154    4.2  41.1  -98.1   6.3447   2.7 ------	UNKNOWN