Analysis Summary
Notes:
- 1) No attempt has been made to eliminate the non-significant decimal places.
- 2) This batgrbproduct analysis is done using the HEASARC data.
- 3) This batgrbproduct analysis is using the flight position for the mask-weighting calculation.
======================================================================
BAT GRB EVENT DATA PROCESSING REPORT
Process Script Ver: batgrbproduct v2.46
Process Start Time: Sat Jan 11 22:12:16 EST 2014
Host Name: batevent1
Current Working Dir: /local/data/batevent/batevent_reproc/trigger578227
======================================================================
Trigger: 00578227 Segment: 000
BAT Trigger Time: 406651088 [s; MET]
Trigger Stop: 406651152 [s; MET]
UTC: 2013-11-20T14:37:56.703060 [includes UTCF correction]
Where From?: TDRSS position message
BAT
RA: 278.921458952195 Dec: -11.9973317222608 [deg; J2000]
Catalogged Source?: NO
Point Source?: YES
GRB Indicated?: YES [ by BAT flight software ]
Image S/N Ratio: 7.8
Image Trigger?: YES
Rate S/N Ratio: 0 [ if not an image trigger ]
Image S/N Ratio: 7.8
Analysis Position: [ source = BAT ]
RA: 278.921458952195 Dec: -11.9973317222608 [deg; J2000]
Refined Position: [ source = BAT pre-slew burst ]
RA: 278.921 Dec: -11.9973 [deg; J2000]
{ 18h 35m 41.0s , -11d -59' -50.3" }
+/- 2.85584839428 [arcmin] (estimated 90% radius based on SNR)
SNR: 6.79399128103
Angular difference between the analysis and refined position is 0.027003 arcmin
Partial Coding Fraction: 0.5078125 [ including projection effects ]
Duration
T90: 130.431999981403 +/- 21.3031813750126
Measured from: -68.4079999923706
to: 62.0239999890327 [s; relative to TRIGTIME]
T50: 92.6080000400543 +/- 16.5377783557849
Measured from: -42.744000017643
to: 49.8640000224113 [s; relative to TRIGTIME]
Fluence
Peak Flux (peak 1 second)
Measured from: 49.3960000276566
to: 50.3960000276566 [s; relative to TRIGTIME]
Total Fluence
Measured from: -71.0960000157356
to: 64.2639999985695 [s; relative to TRIGTIME]
Band 1 Band 2 Band 3 Band 4
15-25 25-50 50-100 100-350 keV
Total 0.694098 0.490425 0.059813 -0.048320
0.097986 0.096745 0.082379 0.073002 [error]
Peak 0.023105 0.020669 0.015756 0.007779
0.008490 0.008141 0.007314 0.005887 [error]
[ fluence units of on-axis counts / fully illuminated detector ]
======================================================================
====== Table of the duration information =============================
Value tstart tstop
T100 135.360 -71.096 64.264
T90 130.432 -68.408 62.024
T50 92.608 -42.744 49.864
Peak 1.000 49.396 50.396
====== Spectral Analysis Summary =====================================
Model : spectral model: simple power-law (PL) and cutoff power-law (CPL)
Ph_index : photon index: E^{Ph_index}
Ph_90err : 90% error of the photon index
Epeak : Epeak in keV
Epeak_90err: 90% error of Epeak
Norm : normalization at 50 keV in both the PL model and CPL model
Nomr_90err : 90% error of the normalization
chi2 : Chi-Squared
dof : degree of freedo
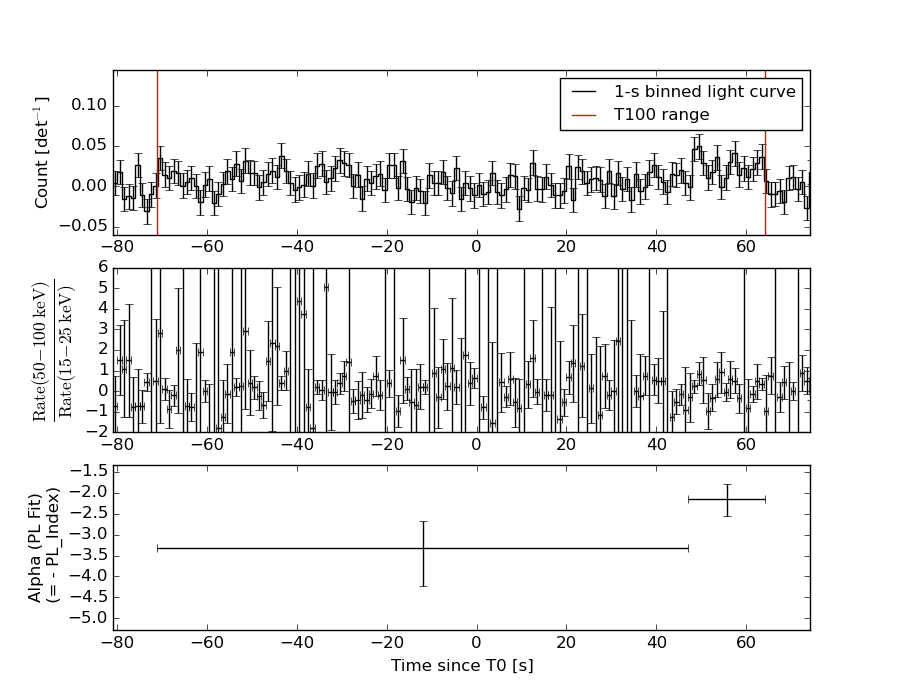
=== Time-averaged spectral analysis ===
(Best model with acceptable fit: PL)
Model Ph_index Ph_90err_low Ph_90err_hi Epeak Epeak_90err_low Epeak_90err_hi Norm Nomr_90err_low Norm_90err_hi chi2 dof
PL -2.873 -0.520 0.429 - - - 3.95e-04 -1.52e-04 1.62e-04 69.290 57
CPL -0.785 N/A N/A 17.078 N/A N/A 1.17e-02 N/A N/A 66.930 56
=== 1-s peak spectral analysis ===
(Best model with acceptable fit: N/A)
Model Ph_index Ph_90err_low Ph_90err_hi Epeak Epeak_90err_low Epeak_90err_hi Norm Nomr_90err_low Norm_90err_hi chi2 dof
PL -1.627 -0.704 0.706 - - - 4.18e-03 -1.70e-03 1.64e-03 39.650 57
CPL -1.516 -1.174 4.281 183.103 -183.103 -183.103 4.86e-03 -4.86e-03 -4.86e-03 39.670 56
=== Fluence/Peak Flux Summary ===
Model Band1 Band2 Band3 Band4 Band5 Total
15-25 25-50 50-100 100-350 15-150 15-350 keV
Fluence PL 2.53e-07 2.04e-07 1.12e-07 8.92e-08 6.09e-07 6.58e-07 erg/cm2
90%_error_low -5.38e-08 -5.40e-08 -5.23e-08 -5.88e-08 -1.46e-07 -1.76e-07 erg/cm2
90%_error_hi 5.40e-08 5.21e-08 6.53e-08 1.16e-07 1.57e-07 2.18e-07 erg/cm2
Peak flux PL 1.94e-01 1.81e-01 1.17e-01 1.17e-01 5.42e-01 6.11e-01 ph/cm2/s
90%_error_low -1.14e-01 -7.51e-02 -5.81e-02 -1.17e-01 -2.12e-01 -2.32e-01 ph/cm2/s
90%_error_hi 1.31e-01 7.22e-02 5.76e-02 1.63e-01 2.13e-01 2.33e-01 ph/cm2/s
Fluence CPL 2.54e-07 2.12e-07 1.12e-07 1.00e-07 6.19e-07 6.66e-07 erg/cm2
90%_error_low -7.14e-08 -5.56e-08 -5.28e-08 N/A -1.53e-07 N/A erg/cm2
90%_error_hi 5.15e-08 5.91e-08 6.52e-08 N/A 1.48e-07 N/A erg/cm2
Peak flux CPL 1.95e-01 1.81e-01 1.17e-01 1.18e-01 5.41e-01 6.12e-01 ph/cm2/s
90%_error_low -1.19e-01 -7.33e-02 -5.77e-02 -1.18e-01 -2.10e-01 -2.34e-01 ph/cm2/s
90%_error_hi 1.31e-01 1.43e-01 6.17e-02 1.61e-01 2.13e-01 2.30e-01 ph/cm2/s
======================================================================
Image
Pre-slew 15.0-50.0 keV image (Event data)
#RAcent DECcent POSerr Theta  Phi  Peak_Cts  SNR Name
278.921 -11.997 0.000 38.085 -33.956 0.693 6.794 TRIG_00578227

Image time interval: 0.000 to 64.000 [sec]
Light Curves
Note: The mask-weighted lightcurves have units of either count/det or counts/sec/det, where a det is 0.4 x 0.4 = 0.16 sq cm.
Full-time range; 1 s binning
Other quick-look light curves:
- 64 ms binning (zoomed)
- 16 ms binning (zoomed)
- 8 ms binning (zoomed)
- 2 ms binning (zoomed)
- SN=5 or 10 s binning (full-time range)
- Raw light curve
Spectra
- 64 ms binning (zoomed)
- 16 ms binning (zoomed)
- 8 ms binning (zoomed)
- 2 ms binning (zoomed)
- SN=5 or 10 s binning (full-time range)
- Raw light curve
Spectra
Notes:
- 1) The fitting includes the systematic errors.
- 2) When the burst includes telescope slew time periods, the fitting uses an average response file made from multiple 5-s response files through out the slew time plus single time preiod for the non-slew times, and weighted by the total counts in the corresponding time period using addrmf. An average response file is needed becuase a spectral fit using the pre-slew DRM will introduce some errors in both a spectral shape and a normalization if the PHA file contains a lot of the slew/post-slew time interval.
- 3) For fits to more complicated models (e.g. a power-law over a cutoff power-law), the BAT team has decided to require a chi-square improvement of more than 6 for each extra dof.
Time averaged spectrum fit using the average DRM
Power-law model
Time interval is from  -71.096 sec. to   64.264 sec.

Spectral model in power-law:
------------------------------------------------------------
Parameters  : value       lower 90%   higher 90%
Photon index: -2.87316     ( -0.520459   0.429281 )
Norm@50keV  : 3.95458E-04    ( -0.000151789   0.00016163 )
------------------------------------------------------------
#Fit statistic : Chi-Squared =          69.29 using 59 PHA bins.
# Reduced chi-squared =          1.216 for     57 degrees of freedom
# Null hypothesis probability =   1.273736e-01

Photon flux (15-150 keV)    in 135.4 sec: 9.93491E-02 ( -0.0190995  0.0191299 ) ph/cm2/s
Energy fluence (15-150 keV)             : 6.08806e-07 ( -1.45585e-07  1.57141e-07 ) ergs/cm2
Cutoff power-law model
Time interval is from  -71.096 sec. to   64.264 sec.
Spectral model in the cutoff power-law:
------------------------------------------------------------
Parameters  : value       lower 90%   higher 90%
Photon index: -0.785268     (       )
Epeak [keV] : 17.0778      (   )
Norm@50keV  : 1.16524E-02    (     )
------------------------------------------------------------
#Fit statistic : Chi-Squared =          66.93 using 59 PHA bins.
# Reduced chi-squared =          1.195 for     56 degrees of freedom
# Null hypothesis probability =   1.504501e-01

Photon flux (15-150 keV)    in 135.4 sec: 9.64125E-02 ( -0.0185387  0.0187295 ) ph/cm2/s
Energy fluence (15-150 keV)             : 6.19353e-07 ( -1.52975e-07  1.48482e-07 ) ergs/cm2
1-s peak spectrum fit
Power-law model

Time interval is from   49.396 sec. to   50.396 sec.

Spectral model in power-law:
------------------------------------------------------------
Parameters  : value       lower 90%   higher 90%
Photon index: -1.62682     ( -0.703711   0.705801 )
Norm@50keV  : 4.17882E-03    ( -0.00169881   0.00164149 )
------------------------------------------------------------
#Fit statistic : Chi-Squared =          39.65 using 59 PHA bins.
# Reduced chi-squared =         0.6956 for     57 degrees of freedom
# Null hypothesis probability =   9.610825e-01

Photon flux (15-150 keV)    in 1 sec: 0.541574 ( -0.211634  0.213258 ) ph/cm2/s
Energy fluence (15-150 keV)             : 3.89646e-08 ( -1.60881e-08  1.66348e-08 ) ergs/cm2
Cutoff power-law model
Time interval is from   49.396 sec. to   50.396 sec.
Spectral model in the cutoff power-law:
------------------------------------------------------------
Parameters  : value       lower 90%   higher 90%
Photon index: -1.62502     ( -1.15488   4.3006 )
Epeak [keV] : 9998.44      ( -9999.12 -9999.12 )
Norm@50keV  : 4.18820E-03    ( -0.00418815   -0.00418815 )
------------------------------------------------------------
#Fit statistic : Chi-Squared =          39.65 using 59 PHA bins.
# Reduced chi-squared =         0.7080 for     56 degrees of freedom
# Null hypothesis probability =   9.518677e-01

Photon flux (15-150 keV)    in 1 sec: 0.541133 ( -0.209966  0.21285 ) ph/cm2/s
Energy fluence (15-150 keV)             : 3.90697e-08 ( -2.32805e-08  1.43584e-08 ) ergs/cm2
Time-resolved spectra
Distribution
T90 vs. Hardness ratio plot
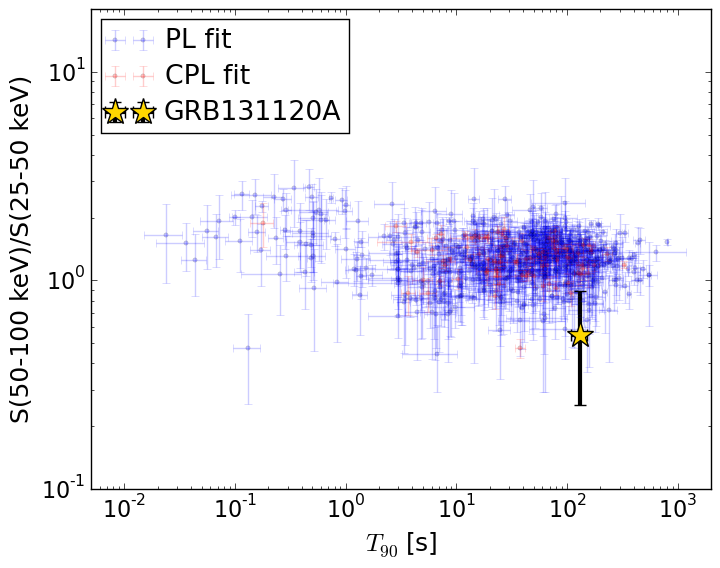
T90                                   = 130.432 sec.
Hardness ratio (energy fluence ratio) = 0.546021924106
S(15-50 keV) vs. S(50-150 keV) plot

S(15-50 keV)  = 4.57263e-07
S(50-150 keV) = 1.5154834e-07
The dash-dotted line and the dashed line traces the fluences calculated from the Band function with Epeak = 15 and 150 keV, respectively. Both lines assume a canonical values of alpha = -1 and beta = -2.5.
Mask shadow pattern
IMX = 0.650030747167, IMY = 0.437727146852
Spacecraft aspect plot
Bright source in the pre-burst/pre-slew/post-slew images
Pre-burst image of 15-350 keV band
Time interval of the image:
-466.799400 -444.850000
-239.000000 -71.096000

# RAcent  DECcent POSerr Theta    Phi  PeakCts   SNR AngSep     Name
#  [deg]    [deg]    ['] [deg]  [deg]                   [']
255.9963 -37.7498   57.9  34.8  -90.6   0.0705   0.2    5.7	4U 1700-377
256.3772 -36.5025    5.8  35.1  -88.5   0.7271   2.0    5.5	GX 349+2
263.0181 -24.6199    5.0  37.3  -66.3   0.7654   2.3    7.6	GX 1+4
264.8677 -44.6346    0.0  26.2  -99.0   0.3323   1.5   12.3	4U 1735-44
268.3373  -1.5834    4.3  52.2  -40.0  -2.1072  -2.7    8.1	SW J1753.5-0127
270.4893 -24.9757    0.0  32.1  -58.5  -0.3048  -1.3   12.8	GX 5-1
270.2967 -25.7671    5.7  31.7  -59.8   0.4692   2.0    1.5	GRS 1758-258
274.0758 -14.0652    3.2  38.6  -42.2   0.9483   3.6    4.4	GX 17+2
275.9392 -30.5105    8.2  24.8  -59.9   0.2776   1.4    8.6	H1820-303
285.0403 -25.0665  174.9  23.8  -36.3  -0.0113  -0.1    8.8	HT1900.1-2455
288.8419  10.9101    4.6  56.7  -11.0   1.7445   2.5    3.3	GRS 1915+105
262.7898 -33.9130    6.1  31.8  -79.7   0.5181   1.9   11.0	GX 354-0
355.0044 -37.1182    2.7  40.1  102.8   3.4425   4.2 ------	UNKNOWN
302.2495   0.6924    2.3  45.2    4.8   1.5590   5.0 ------	UNKNOWN
296.3931   0.9420    2.5  45.8   -3.4   1.4905   4.5 ------	UNKNOWN
122.4424 -82.0720    2.7  53.4 -175.5   2.0882   4.3 ------	UNKNOWN
Pre-slew background subtracted image of 15-350 keV band
Time interval of the image:
-71.096000 64.264000

# RAcent  DECcent POSerr Theta    Phi  PeakCts   SNR AngSep     Name
#  [deg]    [deg]    ['] [deg]  [deg]                   [']
255.9969 -37.8435  975.4  34.8  -90.8  -0.0038  -0.0    0.5	4U 1700-377
256.3351 -36.5203  391.8  35.1  -88.5   0.0098   0.0    7.6	GX 349+2
262.9056 -24.5947    0.0  37.4  -66.4  -0.6858  -2.1   10.7	GX 1+4
264.8677 -44.3889    3.5  26.3  -98.4   0.6821   3.3    6.5	4U 1735-44
268.3004  -1.5371    3.6  52.3  -40.0   2.4759   3.2    6.5	SW J1753.5-0127
270.3805 -24.9720   12.6  32.2  -58.7   0.2187   0.9    8.3	GX 5-1
270.2614 -25.8721    8.7  31.6  -60.0   0.3027   1.3    8.1	GRS 1758-258
273.8945 -14.0714    5.8  38.7  -42.5   0.5300   2.0    6.8	GX 17+2
275.8462 -30.3856    4.4  24.9  -59.8   0.5148   2.6    4.2	H1820-303
285.0096 -24.7735   13.3  24.1  -36.0   0.1423   0.9    8.9	HT1900.1-2455
288.8432  10.9855   39.3  56.8  -11.0  -0.2037  -0.3    3.6	GRS 1915+105
262.8993 -33.8403    5.4  31.8  -79.5  -0.5558  -2.2    4.5	GX 354-0
 35.2890 -71.4105    2.0  49.3  159.6   2.9453   5.8 ------	UNKNOWN
 95.0289 -82.8657    2.2  51.9 -179.6   2.2327   5.3 ------	UNKNOWN
278.9352 -12.0203    1.9  38.1  -34.0   1.4459   6.1 ------	UNKNOWN
Post-slew image of 15-350 keV band
Time interval of the image:
-547.000000 -444.850000
-239.000000 357.760400
361.000000 963.085300

# RAcent  DECcent POSerr Theta    Phi  PeakCts   SNR AngSep     Name
#  [deg]    [deg]    ['] [deg]  [deg]                   [']
255.9252 -37.8221    4.9  34.8  -90.8   3.5493   2.4    3.2	4U 1700-377
256.4009 -36.4932    4.5  35.1  -88.4   4.1494   2.6    4.5	GX 349+2
262.9976 -24.6147    5.8  37.3  -66.4   3.1613   2.0    7.9	GX 1+4
264.8404 -44.5898    4.3  26.2  -98.9   2.4142   2.7    9.4	4U 1735-44
268.2564  -1.5023    6.2  52.4  -40.1   5.5210   1.9    7.3	SW J1753.5-0127
270.2672 -25.0943  123.8  32.2  -59.0   0.0842   0.1    1.3	GX 5-1
270.3025 -25.7434    4.9  31.7  -59.8   2.0560   2.4    0.0	GRS 1758-258
274.0018 -14.0248    2.0  38.7  -42.3   6.3553   5.7    0.7	GX 17+2
275.9366 -30.2857   11.8  25.0  -59.5   0.7785   1.0    4.9	H1820-303
285.2019 -24.8664   41.1  23.9  -35.8  -0.2073  -0.3    9.6	HT1900.1-2455
288.8093  10.9236    3.5  56.8  -11.1  10.0637   3.3    1.5	GRS 1915+105
262.7597 -33.9043    0.0  31.8  -79.7   1.9674   1.7   12.2	GX 354-0
355.0178 -37.0981    4.0  40.1  102.8  11.6530   2.9 ------	UNKNOWN
300.7360  12.1937    4.9  56.8    3.0  10.0266   2.4 ------	UNKNOWN
277.3852 -23.8389    1.8  28.8  -47.7   5.2505   6.5 ------	UNKNOWN