Analysis Summary
Notes:
- 1) No attempt has been made to eliminate the non-significant decimal places.
- 2) This batgrbproduct analysis is done using the HEASARC data.
- 3) This batgrbproduct analysis is using the flight position for the mask-weighting calculation.
======================================================================
                  BAT GRB EVENT DATA PROCESSING REPORT
    Process Script Ver: batgrbproduct v2.46
    Process Start Time: Wed Jun 10 01:28:11 EDT 2015
             Host Name: bat1
   Current Working Dir: /local/data/bat1/alien/Swift_3rdBATcatalog/event/batevent_reproc/trigger579571
======================================================================

  Trigger: 00579571      Segment: 000

  BAT Trigger Time: 407239906.88   [s; MET]
      Trigger Stop: 407239908.928   [s; MET]
               UTC: 2013-11-27T10:11:35.555860    [includes UTCF correction]
       Where From?: TDRSS position message

  BAT
    RA: 332.750849413723   Dec: 36.5900862487713  [deg; J2000]

     Catalogged Source?: NO
     Point Source?:      YES
     GRB Indicated?:     YES    [ by BAT flight software ]
     Image S/N Ratio:    9.02
     Image Trigger?:     NO
     Rate S/N Ratio:     11.2694276695846  [ if not an image trigger ]
     Image S/N Ratio:    9.02

  Analysis Position:   [ source = BAT ]
    RA: 332.750849413723   Dec: 36.5900862487713  [deg; J2000]

  Refined Position:   [ source = BAT pre-slew burst ]
    RA: 332.716412098834   Dec: 36.5965840056045  [deg; J2000]
        { 22h 10m 51.9s , +36d 35' 47.7" }
         +/- 1.78975417456721 [arcmin] (estimated 90% radius based on SNR)
         +/- 0.732460923111162 [arcmin] (formal 1-sigma fit error)
    SNR: 13.2429571607217

  Angular difference between the analysis and refined position is 1.704151 arcmin

  Partial Coding Fraction: 0.390625    [ including projection effects ]

  Duration
     T90: 94.9719999432564 +/- 15.1360080483202
        Measured from: -57.4079999923706
                   to: 37.5639999508858     [s; relative to TRIGTIME]
     T50: 26.1879999637604 +/- 4.04602718706892
        Measured from: -1.87999999523163
                   to: 24.3079999685287     [s; relative to TRIGTIME]


  Fluence
     Peak Flux  (peak 1 second)
        Measured from: -0.53600001335144
                   to: 0.46399998664856     [s; relative to TRIGTIME]
     Total Fluence
        Measured from: -60.3199999928474
                   to: 51.2879999876022     [s; relative to TRIGTIME]

             Band 1     Band 2     Band 3     Band 4
              15-25      25-50     50-100    100-350     keV
 Total     1.737237   1.471202   0.606652  -0.005574
           0.092209   0.095312   0.083714   0.074677 [error]
 Peak      0.040499   0.047742   0.056930   0.014709
           0.009383   0.009647   0.009215   0.007342 [error]

     [ fluence units of on-axis counts / fully illuminated detector ]

======================================================================


====== Table of the duration information =============================

        Value   tstart    tstop
T100  111.608  -60.320   51.288
T90    94.972  -57.408   37.564
T50    26.188   -1.880   24.308
Peak    1.000   -0.536    0.464


====== Spectral Analysis Summary =====================================

Model      : spectral model: simple power-law (PL) and cutoff power-law (CPL)
Ph_index   : photon index: E^{Ph_index}
Ph_90err   : 90% error of the photon index
Epeak      : Epeak in keV
Epeak_90err: 90% error of Epeak
Norm       : normalization at 50 keV in both the PL model and CPL model
Nomr_90err : 90% error of the normalization
chi2       : Chi-Squared
dof        : degree of freedo

=== Time-averaged spectral analysis ===
(Best model with acceptable fit: PL)

Model Ph_index Ph_90err_low Ph_90err_hi  Epeak  Epeak_90err_low  Epeak_90err_hi  Norm       Nomr_90err_low    Norm_90err_hi    chi2    dof
PL      -2.350    -0.160      0.153       -           -               -         1.84e-03     -2.02e-04          1.99e-04      58.860   57
CPL     -1.824    -0.172      0.694       12.752     -12.072        16.247      3.84e-03     -1.23e-03          6.34e-03      56.510   56


=== 1-s peak spectral analysis ===
(Best model with acceptable fit: PL)

Model Ph_index Ph_90err_low Ph_90err_hi  Epeak  Epeak_90err_low  Epeak_90err_hi  Norm       Nomr_90err_low    Norm_90err_hi    chi2    dof
PL      -1.334     -0.337     0.337       -           -               -         1.08e-02     -1.95e-03          1.95e-03      53.580   57
CPL     -1.336     -0.332     0.574     9999.190    -9999.190      -9999.190      1.08e-02     -1.96e-03          1.83e-02      53.580   56


=== Fluence/Peak Flux Summary ===

              Model    Band1     Band2     Band3     Band4     Band5     Total
                       15-25     25-50    50-100    100-350    15-150    15-350    keV
Fluence         PL   5.88e-07  6.46e-07  5.07e-07  6.56e-07  1.99e-06  2.40e-06   erg/cm2
      90%_error_low -5.85e-08 -5.00e-08 -7.53e-08 -1.71e-07 -1.73e-07 -2.73e-07   erg/cm2
      90%_error_hi   5.95e-08  4.98e-08  7.80e-08  2.09e-07  1.76e-07  3.00e-07   erg/cm2
Peak flux       PL   3.78e-01  4.20e-01  3.33e-01  4.37e-01  1.29e+00  1.57e+00   ph/cm2/s
      90%_error_low -1.24e-01 -8.85e-02 -7.48e-02 -1.78e-01 -2.41e-01 -2.91e-01   ph/cm2/s
      90%_error_hi   1.38e-01  8.57e-02  7.26e-02  2.42e-01  2.42e-01  2.97e-01   ph/cm2/s

Fluence        CPL   5.67e-07  6.83e-07  4.75e-07  2.46e-07  1.88e-06  1.97e-06   erg/cm2
      90%_error_low -6.42e-08 -5.90e-08 -9.62e-08 -1.61e-07 -1.98e-07 -2.69e-07   erg/cm2
      90%_error_hi   6.19e-08  6.54e-08  9.04e-08  2.73e-07  2.04e-07  3.57e-07   erg/cm2
Peak flux      CPL   3.77e-01  4.20e-01  3.31e-01  4.78e-01  1.30e+00  1.57e+00   ph/cm2/s
      90%_error_low     N/A   -8.89e-02 -7.30e-02     N/A       N/A   -3.85e-01   ph/cm2/s
      90%_error_hi      N/A    8.75e-02  7.88e-02     N/A       N/A    2.88e-01   ph/cm2/s

======================================================================
Image
Pre-slew 15.0-350.0 keV image (Event data)
#   RAcent    DECcent   POSerr    Theta     Phi              Peak Cts       SNR   Name
  332.7164    36.5966   0.0145    33.6428   -65.5397         2.9195887     13.243 TRIG_00579571

Foreground time interval of the image:
-60.320  29.821 (delta_t =  90.141 [sec])
Background time interval of the image:
-188.179 -60.320 (delta_t = 127.859 [sec])
Light Curves
Note: The mask-weighted lightcurves have units of either count/det or counts/sec/det, where a det is 0.4 x 0.4 = 0.16 sq cm.
Full-time range; 1 s binning
Other quick-look light curves:
- 64 ms binning (zoomed)
- 16 ms binning (zoomed)
- 8 ms binning (zoomed)
- 2 ms binning (zoomed)
- SN=5 or 10 s binning (full-time range)
- Raw light curve
Spectra
- 64 ms binning (zoomed)
- 16 ms binning (zoomed)
- 8 ms binning (zoomed)
- 2 ms binning (zoomed)
- SN=5 or 10 s binning (full-time range)
- Raw light curve
Spectra
Notes:
- 1) The fitting includes the systematic errors.
- 2) When the burst includes telescope slew time periods, the fitting uses an average response file made from multiple 5-s response files through out the slew time plus single time preiod for the non-slew times, and weighted by the total counts in the corresponding time period using addrmf. An average response file is needed becuase a spectral fit using the pre-slew DRM will introduce some errors in both a spectral shape and a normalization if the PHA file contains a lot of the slew/post-slew time interval.
- 3) For fits to more complicated models (e.g. a power-law over a cutoff power-law), the BAT team has decided to require a chi-square improvement of more than 6 for each extra dof.
Time averaged spectrum fit using the average DRM
Power-law model
Time interval is from  -60.320 sec. to   51.288 sec.

Spectral model in power-law:
------------------------------------------------------------
Parameters  : value       lower 90%   higher 90%
Photon index: -2.34995     ( -0.160449   0.152573 )
Norm@50keV  : 1.84352E-03    ( -0.000201947   0.000199364 )
------------------------------------------------------------
#Fit statistic : Chi-Squared =          58.86 using 59 PHA bins.
# Reduced chi-squared =          1.033 for     57 degrees of freedom
# Null hypothesis probability =   4.073353e-01

Photon flux (15-150 keV)    in 111.6 sec: 0.331408 ( -0.024465  0.024476 ) ph/cm2/s
Energy fluence (15-150 keV)             : 1.9857e-06 ( -1.72588e-07  1.75995e-07 ) ergs/cm2
Cutoff power-law model
Time interval is from  -60.320 sec. to   51.288 sec.
Spectral model in the cutoff power-law:
------------------------------------------------------------
Parameters  : value       lower 90%   higher 90%
Photon index: -1.82421     ( -0.172355   0.693775 )
Epeak [keV] : 12.7522      ( -12.0718 16.2469 )
Norm@50keV  : 3.84460E-03    ( -0.00123178   0.00634323 )
------------------------------------------------------------
#Fit statistic : Chi-Squared =          56.51 using 59 PHA bins.
# Reduced chi-squared =          1.009 for     56 degrees of freedom
# Null hypothesis probability =   4.558587e-01

Photon flux (15-150 keV)    in 111.6 sec: 0.324165 ( -0.025645  0.025386 ) ph/cm2/s
Energy fluence (15-150 keV)             : 1.87635e-06 ( -1.98344e-07  2.03843e-07 ) ergs/cm2
1-s peak spectrum fit
Power-law model

Time interval is from   -0.536 sec. to    0.464 sec.

Spectral model in power-law:
------------------------------------------------------------
Parameters  : value       lower 90%   higher 90%
Photon index: -1.33374     ( -0.336645   0.337271 )
Norm@50keV  : 1.07599E-02    ( -0.00195449   0.00194979 )
------------------------------------------------------------
#Fit statistic : Chi-Squared =          53.58 using 59 PHA bins.
# Reduced chi-squared =         0.9399 for     57 degrees of freedom
# Null hypothesis probability =   6.043442e-01

Photon flux (15-150 keV)    in 1 sec: 1.29202 ( -0.24096  0.2416 ) ph/cm2/s
Energy fluence (15-150 keV)             : 1.05492e-07 ( -2.13234e-08  2.15449e-08 ) ergs/cm2
Cutoff power-law model
Time interval is from   -0.536 sec. to    0.464 sec.
Spectral model in the cutoff power-law:
------------------------------------------------------------
Parameters  : value       lower 90%   higher 90%
Photon index: -1.33639     ( -0.332631   0.57339 )
Epeak [keV] : 9999.19      ( -9999.34 -9999.34 )
Norm@50keV  : 1.07977E-02    ( -0.00196177   0.0183158 )
------------------------------------------------------------
#Fit statistic : Chi-Squared =          53.58 using 59 PHA bins.
# Reduced chi-squared =         0.9568 for     56 degrees of freedom
# Null hypothesis probability =   5.669203e-01

Photon flux (15-150 keV)    in 1 sec: 1.30193 (    ) ph/cm2/s
Energy fluence (15-150 keV)             : 1.05996e-07 ( -2.51832e-08  2.44948e-08 ) ergs/cm2
Time-resolved spectra
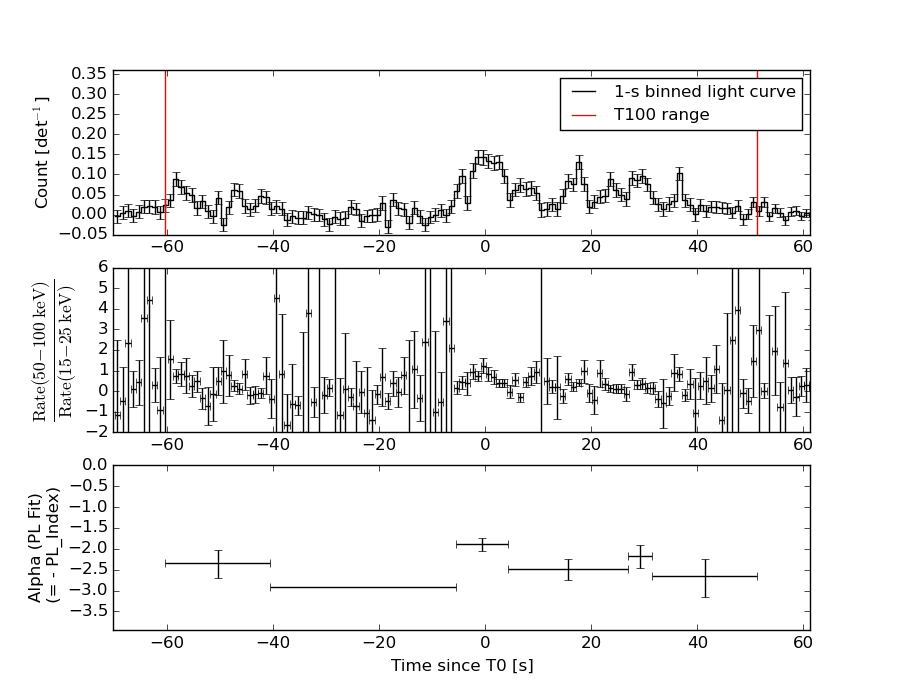
Distribution
T90 vs. Hardness ratio plot
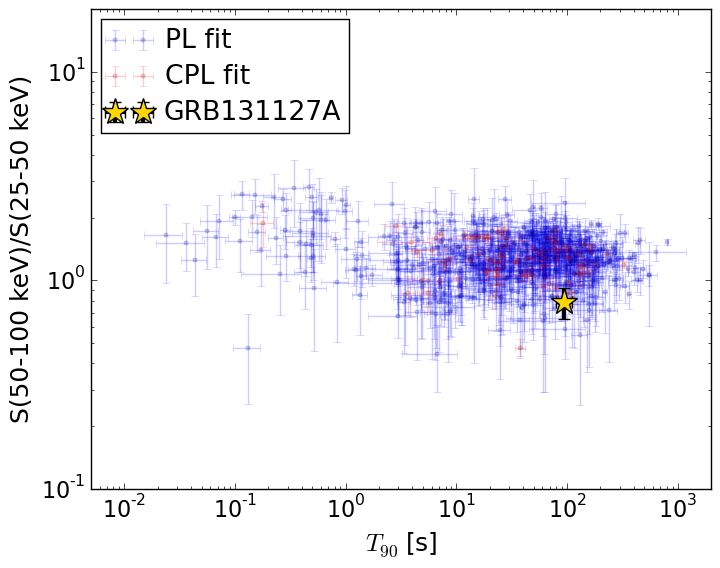
T90                                   = 94.972 sec.
Hardness ratio (energy fluence ratio) = 0.784657251662
S(15-50 keV) vs. S(50-150 keV) plot
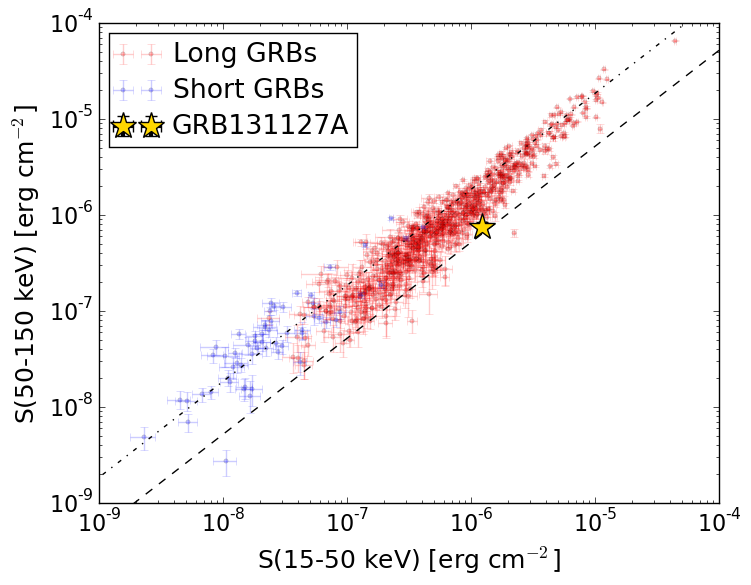
S(15-50 keV)  = 1.2340413e-06
S(50-150 keV) = 7.516997e-07
The dash-dotted line and the dashed line traces the fluences calculated from the Band function with Epeak = 15 and 150 keV, respectively. Both lines assume a canonical values of alpha = -1 and beta = -2.5.
Mask shadow pattern
IMX = 2.755486943051441E-01, IMY = 6.057471466918921E-01
Spacecraft aspect plot
Bright source in the pre-burst/pre-slew/post-slew images
Pre-burst image of 15-350 keV band
Time interval of the image:
-188.179410 -60.320000

# RAcent  DECcent POSerr Theta    Phi  PeakCts   SNR AngSep     Name
#  [deg]    [deg]    ['] [deg]  [deg]                   [']
326.0298  38.1837    7.5  39.1  -63.9   0.4791   1.5   10.6	Cyg X-2
 31.2384   4.5902    2.1  29.2  129.2   0.9456   5.4 ------	UNKNOWN
315.2128  75.6318    2.2  56.7  -17.7   2.5639   5.2 ------	UNKNOWN
331.0991   0.4482    2.4  45.4 -121.2   2.8858   4.9 ------	UNKNOWN
Pre-slew background subtracted image of 15-350 keV band
Time interval of the image:
-60.320000 29.820620

# RAcent  DECcent POSerr Theta    Phi  PeakCts   SNR AngSep     Name
#  [deg]    [deg]    ['] [deg]  [deg]                   [']
326.2695  38.2217    6.1  38.9  -63.8  -0.5678  -1.9    7.6	Cyg X-2
 53.5213  72.5656    2.2  52.4   11.4   2.5211   5.2 ------	UNKNOWN
  1.1026  -6.0704    2.3  33.0 -166.8   0.7100   4.9  370.2	UNKNOWN
332.7164  36.5966    0.9  33.6  -65.5   2.9197  13.2 ------	UNKNOWN
Post-slew image of 15-350 keV band
Time interval of the image:
83.220600 962.184700

# RAcent  DECcent POSerr Theta    Phi  PeakCts   SNR AngSep     Name
#  [deg]    [deg]    ['] [deg]  [deg]                   [']
299.6194  35.1797    1.6  26.8  -65.2   5.1722   7.2    1.9	Cyg X-1
308.0922  40.9579    0.8  19.7  -51.8   7.4261  14.7    0.9	Cyg X-3
326.2211  38.3822    2.6   5.5  -51.3   2.0257   4.4    4.3	Cyg X-2
357.4361 -12.8308    3.4  54.6  167.9  10.2813   3.4 ------	UNKNOWN
327.6241   8.0744    3.9  28.9 -151.6   1.5029   2.9 ------	UNKNOWN
297.4079  30.2092    0.9  30.0  -74.0   9.2029  13.0 ------	UNKNOWN
295.5564  12.6546    4.9  41.0  -98.1   5.8989   2.3 ------	UNKNOWN