Analysis Summary
Notes:
- 1) No attempt has been made to eliminate the non-significant decimal places.
- 2) This batgrbproduct analysis is done using the HEASARC data.
- 3) This batgrbproduct analysis is using the flight position for the mask-weighting calculation.
======================================================================
                  BAT GRB EVENT DATA PROCESSING REPORT
    Process Script Ver: batgrbproduct v2.46
    Process Start Time: Sat Jan 11 22:05:01 EST 2014
             Host Name: batevent1
   Current Working Dir: /local/data/batevent/batevent_reproc/trigger579683
======================================================================

  Trigger: 00579683      Segment: 000

  BAT Trigger Time: 407343995.904   [s; MET]
      Trigger Stop: 407343996.416   [s; MET]
               UTC: 2013-11-28T15:06:24.575040    [includes UTCF correction]
       Where From?: TDRSS position message

  BAT
    RA: 355.323120755133   Dec: 31.2793393516818  [deg; J2000]

     Catalogged Source?: NO
     Point Source?:      YES
     GRB Indicated?:     YES    [ by BAT flight software ]
     Image S/N Ratio:    11.17
     Image Trigger?:     NO
     Rate S/N Ratio:     23.3023603954621  [ if not an image trigger ]
     Image S/N Ratio:    11.17

  Analysis Position:   [ source = BAT ]
    RA: 355.323120755133   Dec: 31.2793393516818  [deg; J2000]

  Refined Position:   [ source = BAT pre-slew burst ]
    RA: 355.305331633583   Dec: 31.2928211504896  [deg; J2000]
        { 23h 41m 13.3s , +31d 17' 34.2" }
         +/- 1.57764728989873 [arcmin] (estimated 90% radius based on SNR)
         +/- 0.617945374071145 [arcmin] (formal 1-sigma fit error)
    SNR: 15.8579510072656

  Angular difference between the analysis and refined position is 1.219151 arcmin

  Partial Coding Fraction: 0.4101562    [ including projection effects ]

  Duration
     T90: 3 +/- 1.4142135623731
        Measured from: -0.903999984264374
                   to: 2.09600001573563     [s; relative to TRIGTIME]
     T50: 1 +/- 1
        Measured from: 0.0960000157356262
                   to: 1.09600001573563     [s; relative to TRIGTIME]


  Fluence
     Peak Flux  (peak 1 second)
        Measured from: 0.0960000157356262
                   to: 1.09600001573563     [s; relative to TRIGTIME]
     Total Fluence
        Measured from: -0.903999984264374
                   to: 2.09600001573563     [s; relative to TRIGTIME]

             Band 1     Band 2     Band 3     Band 4
              15-25      25-50     50-100    100-350     keV
 Total     0.184048   0.190619   0.142317   0.016720
           0.017102   0.017947   0.015545   0.012191 [error]
 Peak      0.099286   0.116326   0.087213   0.003991
           0.010734   0.011518   0.009987   0.007193 [error]

     [ fluence units of on-axis counts / fully illuminated detector ]

======================================================================


====== Table of the duration information =============================

        Value   tstart    tstop
T100    3.000   -0.904    2.096
T90     3.000   -0.904    2.096
T50     1.000    0.096    1.096
Peak    1.000    0.096    1.096


====== Spectral Analysis Summary =====================================

Model      : spectral model: simple power-law (PL) and cutoff power-law (CPL)
Ph_index   : photon index: E^{Ph_index}
Ph_90err   : 90% error of the photon index
Epeak      : Epeak in keV
Epeak_90err: 90% error of Epeak
Norm       : normalization at 50 keV in both the PL model and CPL model
Nomr_90err : 90% error of the normalization
chi2       : Chi-Squared
dof        : degree of freedo

=== Time-averaged spectral analysis ===
(Best model with acceptable fit: PL)

Model Ph_index Ph_90err_low Ph_90err_hi  Epeak  Epeak_90err_low  Epeak_90err_hi  Norm       Nomr_90err_low    Norm_90err_hi    chi2    dof
PL      -1.811    -0.174      0.167       -           -               -         1.15e-02     -1.26e-03          1.24e-03      64.340   57
CPL     -1.112    -0.657      0.768       60.902     -14.334       135.936      2.67e-02     -1.44e-02          3.89e-02      60.990   56


=== 1-s peak spectral analysis ===
(Best model with acceptable fit: CPL)

Model Ph_index Ph_90err_low Ph_90err_hi  Epeak  Epeak_90err_low  Epeak_90err_hi  Norm       Nomr_90err_low    Norm_90err_hi    chi2    dof
PL      -1.801     -0.175     0.167       -           -               -         1.95e-02     -2.31e-03          2.28e-03      63.450   57
CPL     -0.147     -0.864     1.064       54.389      -7.383        11.624      1.41e-01     -8.94e-02          3.36e-01      51.080   56


=== Fluence/Peak Flux Summary ===

              Model    Band1     Band2     Band3     Band4     Band5     Total
                       15-25     25-50    50-100    100-350    15-150    15-350    keV
Fluence         PL   5.90e-08  8.97e-08  1.02e-07  2.23e-07  3.17e-07  4.74e-07   erg/cm2
      90%_error_low -8.46e-09 -8.65e-09 -1.50e-08 -5.96e-08 -3.51e-08 -7.58e-08   erg/cm2
      90%_error_hi   8.73e-09  8.65e-09  1.50e-08  7.19e-08  3.54e-08  8.51e-08   erg/cm2
Peak flux       PL   1.07e+00  9.05e-01  5.20e-01  4.44e-01  2.69e+00  2.94e+00   ph/cm2/s
      90%_error_low -1.64e-01 -9.71e-02 -7.72e-02 -1.14e-01 -2.89e-01 -3.14e-01   ph/cm2/s
      90%_error_hi   1.70e-01  9.70e-02  7.69e-02  1.33e-01  2.89e-01  3.14e-01   ph/cm2/s

Fluence        CPL   5.33e-08  9.70e-08  1.06e-07  8.81e-08  3.04e-07  3.44e-07   erg/cm2
      90%_error_low -1.02e-08 -1.10e-08 -1.65e-08 -4.85e-08 -3.65e-08 -6.17e-08   erg/cm2
      90%_error_hi   1.02e-08  1.13e-08  1.68e-08  1.22e-07  3.73e-08  1.23e-07   erg/cm2
Peak flux      CPL   8.22e-01  1.07e+00  5.90e-01  1.20e-01  2.58e+00  2.60e+00   ph/cm2/s
      90%_error_low -2.11e-01 -1.28e-01 -9.60e-02 -6.17e-02 -2.99e-01 -3.08e-01   ph/cm2/s
      90%_error_hi   2.13e-01  1.31e-01  9.79e-02  1.08e-01  2.98e-01  3.12e-01   ph/cm2/s

======================================================================
Image
Pre-slew 15.0-350.0 keV image (Event data)
#   RAcent    DECcent   POSerr    Theta     Phi              Peak Cts       SNR   Name
  355.3053    31.2928   0.0121    33.8017  -117.8780         0.5356779     15.858 TRIG_00579683

Foreground time interval of the image:
 -0.904   2.096 (delta_t =   3.000 [sec])
Background time interval of the image:
-239.904  -0.904 (delta_t = 239.000 [sec])
Light Curves
Note: The mask-weighted lightcurves have units of either count/det or counts/sec/det, where a det is 0.4 x 0.4 = 0.16 sq cm.
Full-time range; 1 s binning
Other quick-look light curves:
- 64 ms binning (zoomed)
- 16 ms binning (zoomed)
- 8 ms binning (zoomed)
- 2 ms binning (zoomed)
- SN=5 or 10 s binning (full-time range)
- Raw light curve
Spectra
- 64 ms binning (zoomed)
- 16 ms binning (zoomed)
- 8 ms binning (zoomed)
- 2 ms binning (zoomed)
- SN=5 or 10 s binning (full-time range)
- Raw light curve
Spectra
Notes:
- 1) The fitting includes the systematic errors.
- 2) When the burst includes telescope slew time periods, the fitting uses an average response file made from multiple 5-s response files through out the slew time plus single time preiod for the non-slew times, and weighted by the total counts in the corresponding time period using addrmf. An average response file is needed becuase a spectral fit using the pre-slew DRM will introduce some errors in both a spectral shape and a normalization if the PHA file contains a lot of the slew/post-slew time interval.
- 3) For fits to more complicated models (e.g. a power-law over a cutoff power-law), the BAT team has decided to require a chi-square improvement of more than 6 for each extra dof.
Time averaged spectrum fit using the average DRM
Power-law model
Time interval is from   -0.904 sec. to    2.096 sec.

Spectral model in power-law:
------------------------------------------------------------
Parameters  : value       lower 90%   higher 90%
Photon index: -1.81095     ( -0.173656   0.166826 )
Norm@50keV  : 1.14938E-02    ( -0.00125974   0.00123933 )
------------------------------------------------------------
#Fit statistic : Chi-Squared =          64.34 using 59 PHA bins.
# Reduced chi-squared =          1.129 for     57 degrees of freedom
# Null hypothesis probability =   2.351738e-01

Photon flux (15-150 keV)    in 3 sec: 1.59068 ( -0.155  0.15513 ) ph/cm2/s
Energy fluence (15-150 keV)             : 3.17373e-07 ( -3.50532e-08  3.54372e-08 ) ergs/cm2
Cutoff power-law model

Time interval is from   -0.904 sec. to    2.096 sec.
Spectral model in the cutoff power-law:
------------------------------------------------------------
Parameters  : value       lower 90%   higher 90%
Photon index: -1.11171     ( -0.657432   0.768168 )
Epeak [keV] : 60.9020      ( -14.3356 135.934 )
Norm@50keV  : 2.67368E-02    ( -0.0143894   0.0389271 )
------------------------------------------------------------
#Fit statistic : Chi-Squared =          60.99 using 59 PHA bins.
# Reduced chi-squared =          1.089 for     56 degrees of freedom
# Null hypothesis probability =   3.011038e-01

Photon flux (15-150 keV)    in 3 sec: 1.54810 ( -0.16095  0.16028 ) ph/cm2/s
Energy fluence (15-150 keV)             : 3.04221e-07 ( -3.65253e-08  3.73188e-08 ) ergs/cm2
1-s peak spectrum fit
Power-law model
Time interval is from    0.096 sec. to    1.096 sec.

Spectral model in power-law:
------------------------------------------------------------
Parameters  : value       lower 90%   higher 90%
Photon index: -1.80053     ( -0.174542   0.166993 )
Norm@50keV  : 1.95373E-02    ( -0.00231169   0.00228194 )
------------------------------------------------------------
#Fit statistic : Chi-Squared =          63.45 using 59 PHA bins.
# Reduced chi-squared =          1.113 for     57 degrees of freedom
# Null hypothesis probability =   2.597171e-01

Photon flux (15-150 keV)    in 1 sec: 2.69289 ( -0.28916  0.28937 ) ph/cm2/s
Energy fluence (15-150 keV)             : 1.79887e-07 ( -2.15071e-08  2.16895e-08 ) ergs/cm2
Cutoff power-law model
Time interval is from    0.096 sec. to    1.096 sec.
Spectral model in the cutoff power-law:
------------------------------------------------------------
Parameters  : value       lower 90%   higher 90%
Photon index: -0.146561     ( -0.864314   1.06384 )
Epeak [keV] : 54.3888      ( -7.38311 11.6237 )
Norm@50keV  : 0.140927    ( -0.0894009   0.335658 )
------------------------------------------------------------
#Fit statistic : Chi-Squared =          51.08 using 59 PHA bins.
# Reduced chi-squared =         0.9122 for     56 degrees of freedom
# Null hypothesis probability =   6.610477e-01

Photon flux (15-150 keV)    in 1 sec: 2.57731 ( -0.29909  0.29794 ) ph/cm2/s
Energy fluence (15-150 keV)             : 1.6943e-07 ( -2.11304e-08  2.18238e-08 ) ergs/cm2
Time-resolved spectra
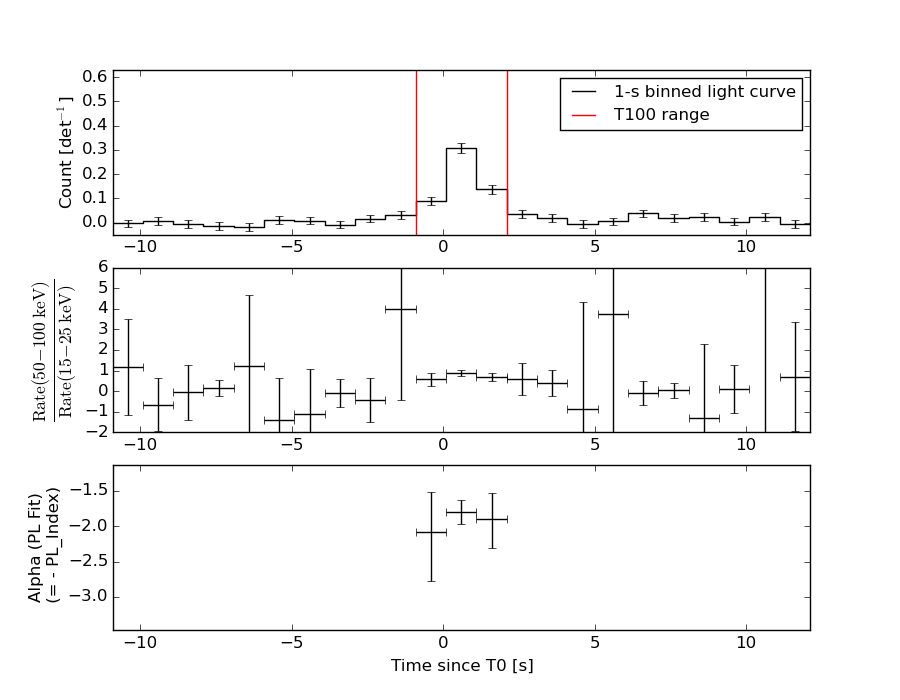
Distribution
T90 vs. Hardness ratio plot
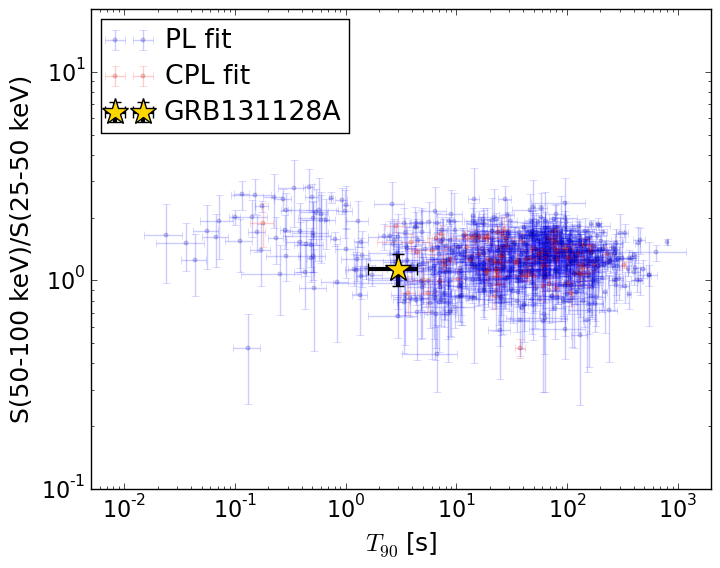
T90                                   = 3.0 sec.
Hardness ratio (energy fluence ratio) = 1.14004017445
S(15-50 keV) vs. S(50-150 keV) plot
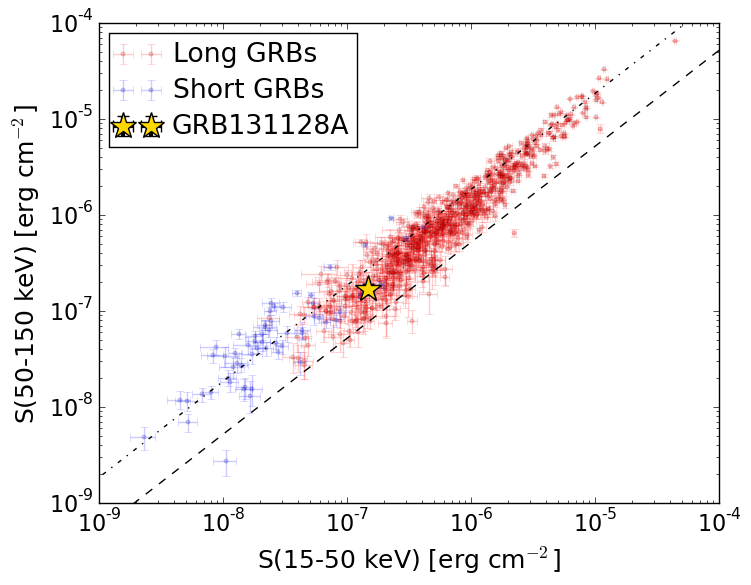
S(15-50 keV)  = 1.4872722e-07
S(50-150 keV) = 1.686474e-07
The dash-dotted line and the dashed line traces the fluences calculated from the Band function with Epeak = 15 and 150 keV, respectively. Both lines assume a canonical values of alpha = -1 and beta = -2.5.
Mask shadow pattern
IMX = -3.130452807927193E-01, IMY = 5.917884229788045E-01
Spacecraft aspect plot
Bright source in the pre-burst/pre-slew/post-slew images
Pre-burst image of 15-350 keV band
Time interval of the image:
-239.904000 -0.904000

# RAcent  DECcent POSerr Theta    Phi  PeakCts   SNR AngSep     Name
#  [deg]    [deg]    ['] [deg]  [deg]                   [']
 20.5598  -2.4743    2.8  38.4  168.7   1.1820   4.0 ------	UNKNOWN
Pre-slew background subtracted image of 15-350 keV band
Time interval of the image:
-0.904000 2.096000

# RAcent  DECcent POSerr Theta    Phi  PeakCts   SNR AngSep     Name
#  [deg]    [deg]    ['] [deg]  [deg]                   [']
 51.5257  14.8077    2.1  23.5  102.1   0.1342   5.4 ------	UNKNOWN
 50.0379  20.4834    2.4  18.2   95.2   0.1017   4.8 ------	UNKNOWN
355.3053  31.2928    0.7  33.8 -117.9   0.5357  15.9 ------	UNKNOWN
Post-slew image of 15-350 keV band
Time interval of the image:
70.596590 962.130200

# RAcent  DECcent POSerr Theta    Phi  PeakCts   SNR AngSep     Name
#  [deg]    [deg]    ['] [deg]  [deg]                   [']
308.1376  40.9552    1.1  38.8  -52.7  10.2615  10.8    1.3	Cyg X-3
326.1448  38.4101   12.1  24.9  -55.9   0.5748   1.0    5.5	Cyg X-2
 33.3947  64.8508    3.3  40.9   33.0   3.2974   3.5 ------	UNKNOWN
317.8438  82.2054    2.7  52.7    3.4   5.7863   4.3 ------	UNKNOWN
345.0193  52.8183    3.0  22.8   -6.8   1.8147   3.8 ------	UNKNOWN
336.4192  64.2598    3.5  35.0   -4.8   2.1399   3.3 ------	UNKNOWN
351.0033 -27.6010    3.0  59.0 -166.1  12.8080   3.8 ------	UNKNOWN
315.2156  12.9315    4.0  41.1  -97.9   8.2562   2.9 ------	UNKNOWN
321.2466   1.0530    3.6  44.2 -117.1   6.9745   3.2 ------	UNKNOWN