Analysis Summary
Notes:
- 1) No attempt has been made to eliminate the non-significant decimal places.
- 2) This batgrbproduct analysis is done using the HEASARC data.
- 3) This batgrbproduct analysis is using the flight position for the mask-weighting calculation.
======================================================================
                  BAT GRB EVENT DATA PROCESSING REPORT
    Process Script Ver: batgrbproduct v2.46
    Process Start Time: Sat Jan 11 22:00:48 EST 2014
             Host Name: batevent1
   Current Working Dir: /local/data/batevent/batevent_reproc/trigger579982
======================================================================

  Trigger: 00579982      Segment: 000

  BAT Trigger Time: 407689940.672   [s; MET]
      Trigger Stop: 407689943.744   [s; MET]
               UTC: 2013-12-02T15:12:09.327060    [includes UTCF correction]
       Where From?: TDRSS position message

  BAT
    RA: 344.05606070492   Dec: -21.6577101512323  [deg; J2000]

     Catalogged Source?: NO
     Point Source?:      YES
     GRB Indicated?:     YES    [ by BAT flight software ]
     Image S/N Ratio:    7.35
     Image Trigger?:     NO
     Rate S/N Ratio:     10.8627804912002  [ if not an image trigger ]
     Image S/N Ratio:    7.35

  Analysis Position:   [ source = BAT ]
    RA: 344.05606070492   Dec: -21.6577101512323  [deg; J2000]

  Refined Position:   [ source = BAT pre-slew burst ]
    RA: 344.013816368876   Dec: -21.640475536918  [deg; J2000]
        { 22h 56m 03.3s , -21d 38' 25.7" }
         +/- 2.0182077844339 [arcmin] (estimated 90% radius based on SNR)
         +/- 0.971635952001577 [arcmin] (formal 1-sigma fit error)
    SNR: 11.1545702117829

  Angular difference between the analysis and refined position is 2.572824 arcmin

  Partial Coding Fraction: 0.6328125    [ including projection effects ]

  Duration
     T90: 30.1959999799728 +/- 8.79446555910627
        Measured from: -0.416000008583069
                   to: 29.7799999713898     [s; relative to TRIGTIME]
     T50: 12.7639999985695 +/- 5.8401547533584
        Measured from: 2.40399998426437
                   to: 15.1679999828339     [s; relative to TRIGTIME]


  Fluence
     Peak Flux  (peak 1 second)
        Measured from: 1.64399999380112
                   to: 2.64399999380112     [s; relative to TRIGTIME]
     Total Fluence
        Measured from: -1.27200001478195
                   to: 35.9840000271797     [s; relative to TRIGTIME]

             Band 1     Band 2     Band 3     Band 4
              15-25      25-50     50-100    100-350     keV
 Total     0.247995   0.326928   0.293924   0.039735
           0.043794   0.045232   0.039367   0.033675 [error]
 Peak      0.019456   0.030290   0.022160   0.014566
           0.007529   0.007572   0.007041   0.005732 [error]

     [ fluence units of on-axis counts / fully illuminated detector ]

======================================================================


====== Table of the duration information =============================

        Value   tstart    tstop
T100   37.256   -1.272   35.984
T90    30.196   -0.416   29.780
T50    12.764    2.404   15.168
Peak    1.000    1.644    2.644


====== Spectral Analysis Summary =====================================

Model      : spectral model: simple power-law (PL) and cutoff power-law (CPL)
Ph_index   : photon index: E^{Ph_index}
Ph_90err   : 90% error of the photon index
Epeak      : Epeak in keV
Epeak_90err: 90% error of Epeak
Norm       : normalization at 50 keV in both the PL model and CPL model
Nomr_90err : 90% error of the normalization
chi2       : Chi-Squared
dof        : degree of freedo

=== Time-averaged spectral analysis ===
(Best model with acceptable fit: PL)

Model Ph_index Ph_90err_low Ph_90err_hi  Epeak  Epeak_90err_low  Epeak_90err_hi  Norm       Nomr_90err_low    Norm_90err_hi    chi2    dof
PL      -1.536    -0.249      0.244       -           -               -         1.72e-03     -2.44e-04          2.42e-04      58.440   57
CPL     -1.438    -1.759      1.008      275.673    -275.673      -275.673      1.93e-03     -4.42e-04          3.96e-03      58.450   56


=== 1-s peak spectral analysis ===
(Best model with acceptable fit: PL)

Model Ph_index Ph_90err_low Ph_90err_hi  Epeak  Epeak_90err_low  Epeak_90err_hi  Norm       Nomr_90err_low    Norm_90err_hi    chi2    dof
PL      -1.408     -0.500     0.497       -           -               -         5.49e-03     -1.51e-03          1.50e-03      49.740   57
CPL     -1.412     -0.495     0.583     9999.360    -9999.360      -9999.360      5.49e-03     -1.50e-03          2.88e-02      49.740   56


=== Fluence/Peak Flux Summary ===

              Model    Band1     Band2     Band3     Band4     Band5     Total
                       15-25     25-50    50-100    100-350    15-150    15-350    keV
Fluence         PL   8.49e-08  1.53e-07  2.10e-07  6.03e-07  6.06e-07  1.05e-06   erg/cm2
      90%_error_low -1.96e-08 -2.23e-08 -3.89e-08 -2.09e-07 -9.25e-08 -2.44e-07   erg/cm2
      90%_error_hi   2.09e-08  2.20e-08  3.83e-08  2.72e-07  9.34e-08  2.94e-07   erg/cm2
Peak flux       PL   2.07e-01  2.20e-01  1.66e-01  2.03e-01  6.69e-01  7.95e-01   ph/cm2/s
      90%_error_low -9.65e-02 -6.99e-02 -5.60e-02 -1.13e-01 -1.90e-01 -2.19e-01   ph/cm2/s
      90%_error_hi   1.12e-01  6.70e-02  5.35e-02  1.72e-01  1.91e-01  2.21e-01   ph/cm2/s

Fluence        CPL   8.40e-08  1.54e-07  2.12e-07  5.51e-07  6.04e-07  1.00e-06   erg/cm2
      90%_error_low -2.39e-08 -2.31e-08 -3.97e-08 -4.01e-07 -9.95e-08 -4.15e-07   erg/cm2
      90%_error_hi   1.75e-08  2.70e-08  4.26e-08  1.09e-07  9.49e-08  5.74e-07   erg/cm2
Peak flux      CPL   2.13e-01  2.20e-01  1.64e-01  2.17e-01  6.72e-01  7.98e-01   ph/cm2/s
      90%_error_low -1.09e-01 -7.01e-02 -5.46e-02     N/A   -1.99e-01 -2.21e-01   ph/cm2/s
      90%_error_hi   1.04e-01  3.74e-02  6.29e-02     N/A    1.95e-01  2.14e-01   ph/cm2/s

======================================================================
Image
Pre-slew 15.0-350.0 keV image (Event data)

#   RAcent    DECcent   POSerr    Theta     Phi              Peak Cts       SNR   Name
  344.0138   -21.6405   0.0172    37.7975  -164.0784         0.9576611     11.155 TRIG_00579982

Foreground time interval of the image:
 -1.272  35.984 (delta_t =  37.256 [sec])
Background time interval of the image:
-345.571 -327.169 (delta_t =  18.403 [sec])
-239.672  -1.272 (delta_t = 238.400 [sec])
Light Curves
Note: The mask-weighted lightcurves have units of either count/det or counts/sec/det, where a det is 0.4 x 0.4 = 0.16 sq cm.
Full-time range; 1 s binning
Other quick-look light curves:
- 64 ms binning (zoomed)
- 16 ms binning (zoomed)
- 8 ms binning (zoomed)
- 2 ms binning (zoomed)
- SN=5 or 10 s binning (full-time range)
- Raw light curve
Spectra
- 64 ms binning (zoomed)
- 16 ms binning (zoomed)
- 8 ms binning (zoomed)
- 2 ms binning (zoomed)
- SN=5 or 10 s binning (full-time range)
- Raw light curve
Spectra
Notes:
- 1) The fitting includes the systematic errors.
- 2) When the burst includes telescope slew time periods, the fitting uses an average response file made from multiple 5-s response files through out the slew time plus single time preiod for the non-slew times, and weighted by the total counts in the corresponding time period using addrmf. An average response file is needed becuase a spectral fit using the pre-slew DRM will introduce some errors in both a spectral shape and a normalization if the PHA file contains a lot of the slew/post-slew time interval.
- 3) For fits to more complicated models (e.g. a power-law over a cutoff power-law), the BAT team has decided to require a chi-square improvement of more than 6 for each extra dof.
Time averaged spectrum fit using the average DRM
Power-law model
Time interval is from   -1.272 sec. to   35.984 sec.

Spectral model in power-law:
------------------------------------------------------------
Parameters  : value       lower 90%   higher 90%
Photon index: -1.53588     ( -0.248755   0.244468 )
Norm@50keV  : 1.72482E-03    ( -0.000244185   0.000242156 )
------------------------------------------------------------
#Fit statistic : Chi-Squared =          58.44 using 59 PHA bins.
# Reduced chi-squared =          1.025 for     57 degrees of freedom
# Null hypothesis probability =   4.222430e-01

Photon flux (15-150 keV)    in 37.26 sec: 0.217476 ( -0.030764  0.030869 ) ph/cm2/s
Energy fluence (15-150 keV)             : 6.06336e-07 ( -9.25017e-08  9.34302e-08 ) ergs/cm2
Cutoff power-law model

Time interval is from   -1.272 sec. to   35.984 sec.
Spectral model in the cutoff power-law:
------------------------------------------------------------
Parameters  : value       lower 90%   higher 90%
Photon index: -1.43842     ( -1.7432   1.02318 )
Epeak [keV] : 275.673      ( -373.749 -373.749 )
Norm@50keV  : 1.92711E-03    ( -0.000362367   0.00404085 )
------------------------------------------------------------
#Fit statistic : Chi-Squared =          58.45 using 59 PHA bins.
# Reduced chi-squared =          1.044 for     56 degrees of freedom
# Null hypothesis probability =   3.856020e-01

Photon flux (15-150 keV)    in 37.26 sec: 0.216923 ( -0.032008  0.031301 ) ph/cm2/s
Energy fluence (15-150 keV)             : 6.04119e-07 ( -9.95472e-08  9.48744e-08 ) ergs/cm2
1-s peak spectrum fit
Power-law model
Time interval is from    1.644 sec. to    2.644 sec.

Spectral model in power-law:
------------------------------------------------------------
Parameters  : value       lower 90%   higher 90%
Photon index: -1.40758     ( -0.499709   0.496528 )
Norm@50keV  : 5.48788E-03    ( -0.00150971   0.00150313 )
------------------------------------------------------------
#Fit statistic : Chi-Squared =          49.74 using 59 PHA bins.
# Reduced chi-squared =         0.8726 for     57 degrees of freedom
# Null hypothesis probability =   7.415663e-01

Photon flux (15-150 keV)    in 1 sec: 0.669493 ( -0.190406  0.191448 ) ph/cm2/s
Energy fluence (15-150 keV)             : 5.29529e-08 ( -1.57463e-08  1.58996e-08 ) ergs/cm2
Cutoff power-law model

Time interval is from    1.644 sec. to    2.644 sec.
Spectral model in the cutoff power-law:
------------------------------------------------------------
Parameters  : value       lower 90%   higher 90%
Photon index: -1.41212     ( -0.4966   0.580929 )
Epeak [keV] : 9999.36      ( -9999.36 -9999.36 )
Norm@50keV  : 5.49227E-03    ( -0.00151587   0.0287506 )
------------------------------------------------------------
#Fit statistic : Chi-Squared =          49.74 using 59 PHA bins.
# Reduced chi-squared =         0.8882 for     56 degrees of freedom
# Null hypothesis probability =   7.093108e-01

Photon flux (15-150 keV)    in 1 sec: 0.672076 ( -0.199159  0.194674 ) ph/cm2/s
Energy fluence (15-150 keV)             : 5.30897e-08 ( -1.64594e-08  1.38463e-08 ) ergs/cm2
Time-resolved spectra
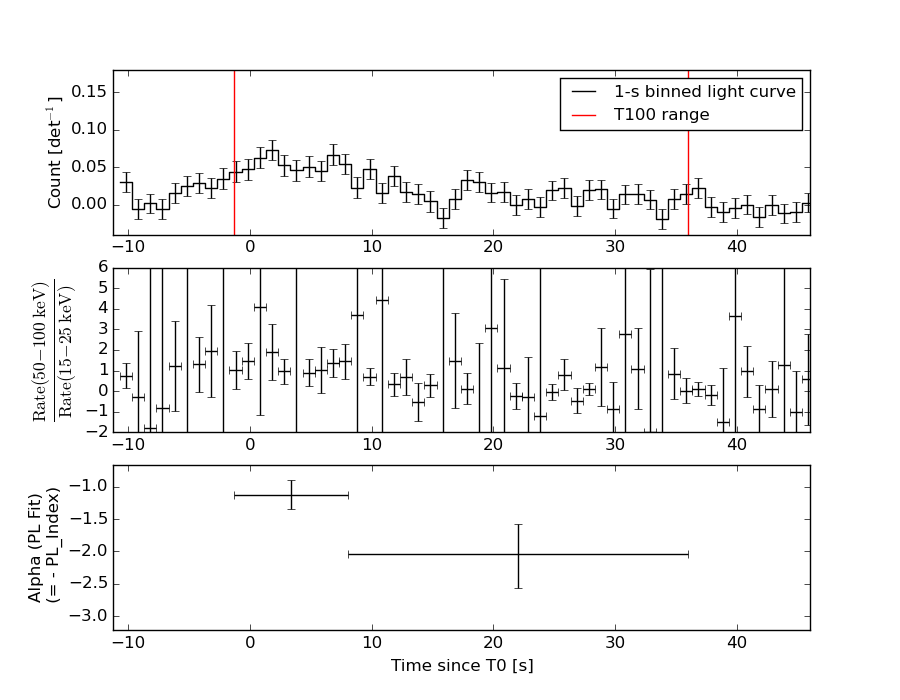
Distribution
T90 vs. Hardness ratio plot
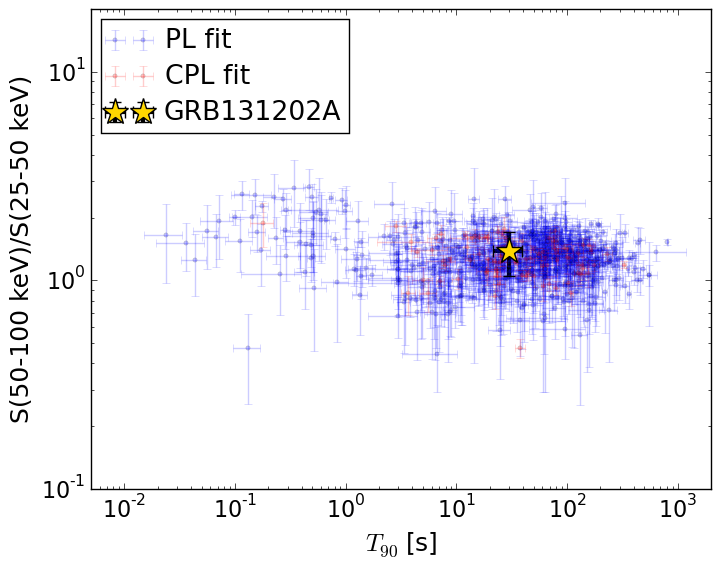
T90                                   = 30.196 sec.
Hardness ratio (energy fluence ratio) = 1.37949451679
S(15-50 keV) vs. S(50-150 keV) plot

S(15-50 keV)  = 2.3744648e-07
S(50-150 keV) = 3.688971e-07
The dash-dotted line and the dashed line traces the fluences calculated from the Band function with Epeak = 15 and 150 keV, respectively. Both lines assume a canonical values of alpha = -1 and beta = -2.5.
Mask shadow pattern
IMX = -7.458566769650892E-01, IMY = 2.127670626912365E-01
Spacecraft aspect plot
Bright source in the pre-burst/pre-slew/post-slew images
Pre-burst image of 15-350 keV band
Time interval of the image:
-345.571410 -327.168500
-239.672000 -1.272000

# RAcent  DECcent POSerr Theta    Phi  PeakCts   SNR AngSep     Name
#  [deg]    [deg]    ['] [deg]  [deg]                   [']
299.6404  35.0506    4.9  43.4  -38.9   0.8337   2.3    9.4	Cyg X-1
308.1190  40.9693    1.6  39.3  -26.8   1.9615   7.1    1.1	Cyg X-3
325.9991  38.2952    6.1  26.9  -14.5   0.3889   1.9    8.3	Cyg X-2
315.4964 -22.7049    2.3  47.5 -127.3   4.5213   5.0 ------	UNKNOWN
Pre-slew background subtracted image of 15-350 keV band
Time interval of the image:
-1.272000 35.984000

# RAcent  DECcent POSerr Theta    Phi  PeakCts   SNR AngSep     Name
#  [deg]    [deg]    ['] [deg]  [deg]                   [']
299.5566  34.9813    0.0  43.4  -39.0  -0.2077  -1.6   13.3	Cyg X-1
307.9218  40.9644    4.5  39.4  -27.0   0.2494   2.6    8.6	Cyg X-3
326.3482  38.2314   21.2  26.7  -14.2  -0.0359  -0.5    9.9	Cyg X-2
  1.2717  25.9220    2.2  19.3   73.3   0.3837   5.1 ------	UNKNOWN
344.0138 -21.6405    1.0  37.8 -164.1   0.9577  11.2 ------	UNKNOWN
322.6214  30.3562    2.2  23.8  -32.8   0.3573   5.2 ------	UNKNOWN
320.0967   1.5475    2.6  27.3 -103.3   0.3922   4.4 ------	UNKNOWN
339.1969 -42.8324    2.6  59.1 -159.6   1.6915   4.4 ------	UNKNOWN
329.0835 -33.8111    2.6  51.8 -148.0   0.9120   4.5 ------	UNKNOWN
Post-slew image of 15-350 keV band
Time interval of the image:
97.828590 962.395000

# RAcent  DECcent POSerr Theta    Phi  PeakCts   SNR AngSep     Name
#  [deg]    [deg]    ['] [deg]  [deg]                   [']
  5.6147  -0.5285    2.9  29.8   70.2   3.2817   3.9  338.4	UNKNOWN
321.4052  29.1264    3.4  55.3   -1.7   6.3725   3.4 ------	UNKNOWN
333.1227  -1.5069    2.9  22.8   -6.8   2.0934   4.0 ------	UNKNOWN
328.6049   9.8221    4.2  34.9   -4.8   1.8058   2.7 ------	UNKNOWN
351.4565 -42.9841    3.2  22.2 -171.9   1.8801   3.6 ------	UNKNOWN
 22.0107 -77.8867    3.2  59.0 -166.1  12.8854   3.6 ------	UNKNOWN
299.3489 -24.9298    2.6  41.0  -81.1  10.8869   4.4 ------	UNKNOWN
299.6429 -36.0719    4.7  41.1  -98.1   7.5405   2.5 ------	UNKNOWN
300.8035 -55.4357    3.1  46.6 -125.1   9.1728   3.7 ------	UNKNOWN