Analysis Summary
Notes:
- 1) No attempt has been made to eliminate the non-significant decimal places.
- 2) This batgrbproduct analysis is done using the HEASARC data.
- 3) This batgrbproduct analysis is using the flight position for the mask-weighting calculation.
======================================================================
                  BAT GRB EVENT DATA PROCESSING REPORT
    Process Script Ver: batgrbproduct v2.46
    Process Start Time: Sat Jan 11 21:56:18 EST 2014
             Host Name: batevent1
   Current Working Dir: /local/data/batevent/batevent_reproc/trigger580267
======================================================================

  Trigger: 00580267      Segment: 000

  BAT Trigger Time: 407927930.304   [s; MET]
      Trigger Stop: 407927932.352   [s; MET]
               UTC: 2013-12-05T09:18:38.948060    [includes UTCF correction]
       Where From?: TDRSS position message

  BAT
    RA: 131.608992800002   Dec: -60.1740032566644  [deg; J2000]

     Catalogged Source?: NO
     Point Source?:      YES
     GRB Indicated?:     YES    [ by BAT flight software ]
     Image S/N Ratio:    8.19
     Image Trigger?:     NO
     Rate S/N Ratio:     11.13552872566  [ if not an image trigger ]
     Image S/N Ratio:    8.19

  Analysis Position:   [ source = BAT ]
    RA: 131.608992800002   Dec: -60.1740032566644  [deg; J2000]

  Refined Position:   [ source = BAT pre-slew burst ]
    RA: 131.609   Dec: -60.174  [deg; J2000]
        { 08h 46m 26.2s , -60d -10' -26.4" }
        +/- 2.60581169346 [arcmin] (estimated 90% radius based on SNR)
    SNR: 7.74409854948


  Angular difference between the analysis and refined position is 0.000290 arcmin

  Partial Coding Fraction: 0.953125    [ including projection effects ]

  Duration
     T90: 20.3439999222755 +/- 0.938594662245004
        Measured from: -0.0600000023841858
                   to: 20.2839999198914     [s; relative to TRIGTIME]
     T50: 18.9079999923706 +/- 18.8542069704413
        Measured from: 0.771999955177307
                   to: 19.6799999475479     [s; relative to TRIGTIME]


  Fluence
     Peak Flux  (peak 1 second)
        Measured from: 19.311999976635
                   to: 20.311999976635     [s; relative to TRIGTIME]
     Total Fluence
        Measured from: -0.252000033855438
                   to: 20.5079999566078     [s; relative to TRIGTIME]

             Band 1     Band 2     Band 3     Band 4
              15-25      25-50     50-100    100-350     keV
 Total     0.102738   0.084767   0.109376   0.006290
           0.024833   0.025562   0.022415   0.019275 [error]
 Peak      0.016671   0.030718   0.027631   0.015961
           0.005784   0.006100   0.005571   0.004508 [error]

     [ fluence units of on-axis counts / fully illuminated detector ]

======================================================================


====== Table of the duration information =============================

        Value   tstart    tstop
T100   20.760   -0.252   20.508
T90    20.344   -0.060   20.284
T50    18.908    0.772   19.680
Peak    1.000   19.312   20.312


====== Spectral Analysis Summary =====================================

Model      : spectral model: simple power-law (PL) and cutoff power-law (CPL)
Ph_index   : photon index: E^{Ph_index}
Ph_90err   : 90% error of the photon index
Epeak      : Epeak in keV
Epeak_90err: 90% error of Epeak
Norm       : normalization at 50 keV in both the PL model and CPL model
Nomr_90err : 90% error of the normalization
chi2       : Chi-Squared
dof        : degree of freedo

=== Time-averaged spectral analysis ===
(Best model with acceptable fit: PL)

Model Ph_index Ph_90err_low Ph_90err_hi  Epeak  Epeak_90err_low  Epeak_90err_hi  Norm       Nomr_90err_low    Norm_90err_hi    chi2    dof
PL      -1.522    -0.458      0.435       -           -               -         9.63e-04     -2.48e-04          2.39e-04      53.090   57
CPL     -1.506     N/A        N/A        9974.720      N/A           N/A         9.80e-04        N/A               N/A         53.100   56


=== 1-s peak spectral analysis ===
(Best model with acceptable fit: PL)

Model Ph_index Ph_90err_low Ph_90err_hi  Epeak  Epeak_90err_low  Epeak_90err_hi  Norm       Nomr_90err_low    Norm_90err_hi    chi2    dof
PL      -1.202     -0.388     0.399       -           -               -         5.68e-03     -1.16e-03          1.16e-03      35.680   57
CPL     -1.209     -2.797     0.869     9999.350      N/A           N/A         5.70e-03        N/A               N/A         35.690   56


=== Fluence/Peak Flux Summary ===

              Model    Band1     Band2     Band3     Band4     Band5     Total
                       15-25     25-50    50-100    100-350    15-150    15-350    keV
Fluence         PL   2.60e-08  4.72e-08  6.58e-08  1.91e-07  1.89e-07  3.30e-07   erg/cm2
      90%_error_low -9.69e-09 -1.14e-08 -2.26e-08 -1.09e-07 -5.24e-08 -1.33e-07   erg/cm2
      90%_error_hi   1.05e-08  1.12e-08  2.23e-08  1.78e-07  5.39e-08  1.91e-07   erg/cm2
Peak flux       PL   1.76e-01  2.11e-01  1.84e-01  2.73e-01  6.67e-01  8.44e-01   ph/cm2/s
      90%_error_low -6.76e-02 -5.23e-02 -4.63e-02 -1.24e-01 -1.39e-01 -1.84e-01   ph/cm2/s
      90%_error_hi   7.62e-02  5.01e-02  4.47e-02  1.80e-01  1.40e-01  1.93e-01   ph/cm2/s

Fluence        CPL   2.63e-08  4.67e-08  6.55e-08  2.01e-07  1.90e-07  3.17e-07   erg/cm2
      90%_error_low -1.15e-08 -1.08e-08 -2.28e-08 -1.49e-07 -5.61e-08 -1.66e-07   erg/cm2
      90%_error_hi   1.04e-08  1.39e-08  2.42e-08  1.94e-07  3.84e-08  1.38e-07   erg/cm2
Peak flux      CPL   1.76e-01  2.08e-01  1.80e-01  3.05e-01  6.67e-01  8.82e-01   ph/cm2/s
      90%_error_low     N/A   -6.35e-02     N/A       N/A   -1.40e-01 -2.89e-01   ph/cm2/s
      90%_error_hi      N/A    6.69e-02     N/A       N/A    1.40e-01  1.96e-01   ph/cm2/s

======================================================================
Image
Pre-slew 25.0-100.0 keV image (Event data)
#RAcent DECcent POSerr Theta  Phi  Peak_Cts  SNR Name
131.609 -60.174 0.000 19.729 -33.287 0.090 7.744 TRIG_00580267

Image time interval: 0.000 to 2.048 [sec]
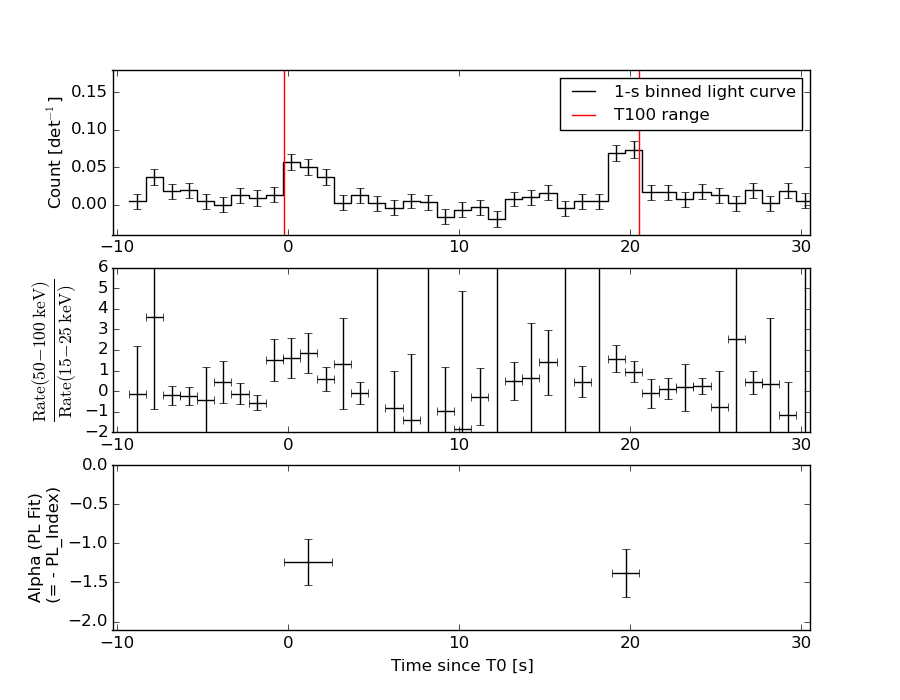
Light Curves
Note: The mask-weighted lightcurves have units of either count/det or counts/sec/det, where a det is 0.4 x 0.4 = 0.16 sq cm.
Full-time range; 1 s binning
Other quick-look light curves:
- 64 ms binning (zoomed)
- 16 ms binning (zoomed)
- 8 ms binning (zoomed)
- 2 ms binning (zoomed)
- SN=5 or 10 s binning (full-time range)
- Raw light curve
Spectra
- 64 ms binning (zoomed)
- 16 ms binning (zoomed)
- 8 ms binning (zoomed)
- 2 ms binning (zoomed)
- SN=5 or 10 s binning (full-time range)
- Raw light curve
Spectra
Notes:
- 1) The fitting includes the systematic errors.
- 2) When the burst includes telescope slew time periods, the fitting uses an average response file made from multiple 5-s response files through out the slew time plus single time preiod for the non-slew times, and weighted by the total counts in the corresponding time period using addrmf. An average response file is needed becuase a spectral fit using the pre-slew DRM will introduce some errors in both a spectral shape and a normalization if the PHA file contains a lot of the slew/post-slew time interval.
- 3) For fits to more complicated models (e.g. a power-law over a cutoff power-law), the BAT team has decided to require a chi-square improvement of more than 6 for each extra dof.
Time averaged spectrum fit using the average DRM
Power-law model
Time interval is from   -0.252 sec. to   20.508 sec.

Spectral model in power-law:
------------------------------------------------------------
Parameters  : value       lower 90%   higher 90%
Photon index: -1.52162     ( -0.457954   0.434804 )
Norm@50keV  : 9.62577E-04    ( -0.000248419   0.000238747 )
------------------------------------------------------------
#Fit statistic : Chi-Squared =          53.09 using 59 PHA bins.
# Reduced chi-squared =         0.9314 for     57 degrees of freedom
# Null hypothesis probability =   6.225723e-01

Photon flux (15-150 keV)    in 20.76 sec: 0.120883 ( -0.0284276  0.028472 ) ph/cm2/s
Energy fluence (15-150 keV)             : 1.88942e-07 ( -5.24244e-08  5.39415e-08 ) ergs/cm2
Cutoff power-law model
Time interval is from   -0.252 sec. to   20.508 sec.
Spectral model in the cutoff power-law:
------------------------------------------------------------
Parameters  : value       lower 90%   higher 90%
Photon index: -1.5056     (       )
Epeak [keV] : 9974.72      (   )
Norm@50keV  : 9.79766E-04    (     )
------------------------------------------------------------
#Fit statistic : Chi-Squared =          53.10 using 59 PHA bins.
# Reduced chi-squared =         0.9482 for     56 degrees of freedom
# Null hypothesis probability =   5.853748e-01

Photon flux (15-150 keV)    in 20.76 sec: 0.121363 ( -0.0439322  0.028776 ) ph/cm2/s
Energy fluence (15-150 keV)             : 1.89752e-07 ( -5.60505e-08  3.83697e-08 ) ergs/cm2
1-s peak spectrum fit
Power-law model
Time interval is from   19.312 sec. to   20.312 sec.

Spectral model in power-law:
------------------------------------------------------------
Parameters  : value       lower 90%   higher 90%
Photon index: -1.20217     ( -0.388453   0.399472 )
Norm@50keV  : 5.67929E-03    ( -0.00116424   0.0011638 )
------------------------------------------------------------
#Fit statistic : Chi-Squared =          35.68 using 59 PHA bins.
# Reduced chi-squared =         0.6259 for     57 degrees of freedom
# Null hypothesis probability =   9.879541e-01

Photon flux (15-150 keV)    in 1 sec: 0.666839 ( -0.139498  0.140121 ) ph/cm2/s
Energy fluence (15-150 keV)             : 5.75904e-08 ( -1.34425e-08  1.36539e-08 ) ergs/cm2
Cutoff power-law model
Time interval is from   19.312 sec. to   20.312 sec.
Spectral model in the cutoff power-law:
------------------------------------------------------------
Parameters  : value       lower 90%   higher 90%
Photon index: -2.52951     ( -1.47655   2.18967 )
Epeak [keV] : 169.086      (   )
Norm@50keV  : 1.06151E-03    (     )
------------------------------------------------------------
#Fit statistic : Chi-Squared =          35.17 using 59 PHA bins.
# Reduced chi-squared =         0.6281 for     56 degrees of freedom
# Null hypothesis probability =   9.867525e-01

Photon flux (15-150 keV)    in 1 sec: 0.666724 ( -0.139752  0.140013 ) ph/cm2/s
Energy fluence (15-150 keV)             : 5.79215e-08 ( -1.68368e-08  7.63262e-09 ) ergs/cm2
Time-resolved spectra
Distribution
T90 vs. Hardness ratio plot
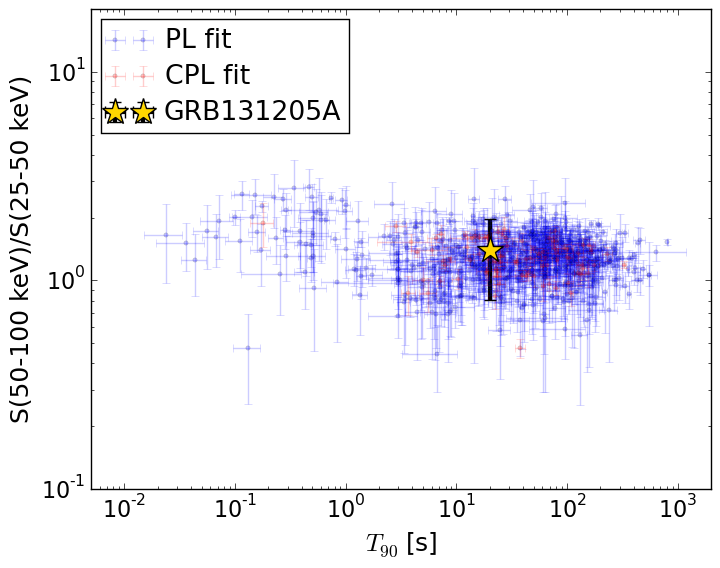
T90                                   = 20.344 sec.
Hardness ratio (energy fluence ratio) = 1.3931886296
S(15-50 keV) vs. S(50-150 keV) plot
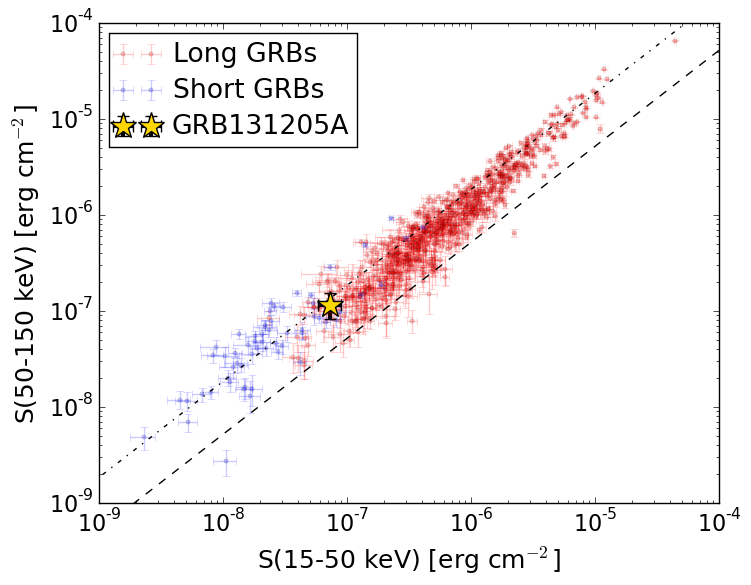
S(15-50 keV)  = 7.325934e-08
S(50-150 keV) = 1.1568277e-07
The dash-dotted line and the dashed line traces the fluences calculated from the Band function with Epeak = 15 and 150 keV, respectively. Both lines assume a canonical values of alpha = -1 and beta = -2.5.
Mask shadow pattern
IMX = 0.29977964718, IMY = 0.196822643445
Spacecraft aspect plot
Bright source in the pre-burst/pre-slew/post-slew images
Pre-burst image of 15-350 keV band
Time interval of the image:
-50.803400 -0.252000

# RAcent  DECcent POSerr Theta    Phi  PeakCts   SNR AngSep     Name
#  [deg]    [deg]    ['] [deg]  [deg]                   [']
135.8060 -40.5317    0.0   0.3 -140.3   0.0404   0.5   12.7	Vela X-1
170.6514 -60.5704    5.9  29.4  -74.2   0.1949   1.9   10.4	Cen X-3
186.5431 -62.7842   90.1  37.2  -75.0   0.0245   0.1    3.2	GX 301-2
 34.8572 -69.7261    2.6  55.8  -14.6   1.2206   4.5 ------	UNKNOWN
195.4022 -59.3864    2.3  41.1  -81.0   1.5789   5.0 ------	UNKNOWN
Pre-slew background subtracted image of 15-350 keV band
Time interval of the image:
-0.252000 20.508000

# RAcent  DECcent POSerr Theta    Phi  PeakCts   SNR AngSep     Name
#  [deg]    [deg]    ['] [deg]  [deg]                   [']
135.8060 -40.5317    0.0   0.3 -140.1  -0.0436  -0.8   12.7	Vela X-1
170.3339 -60.7537   99.3  29.3  -73.7   0.0090   0.1    7.9	Cen X-3
186.3323 -62.8355    5.7  37.1  -74.9  -0.2586  -2.0    9.7	GX 301-2
134.7376 -65.4172    2.2  24.8  -38.2   0.3055   5.2 ------	UNKNOWN
Post-slew image of 15-350 keV band
Time interval of the image:
72.796610 962.766000

# RAcent  DECcent POSerr Theta    Phi  PeakCts   SNR AngSep     Name
#  [deg]    [deg]    ['] [deg]  [deg]                   [']
135.3735 -40.6557    8.9  19.7  152.0  -0.6336  -1.3    9.3	Vela X-1
170.3037 -60.6188    1.5  18.8 -108.3   3.7531   7.5    0.4	Cen X-3
186.5582 -62.7654    2.0  25.6  -96.8   3.4142   5.8    2.7	GX 301-2
 65.4237 -57.3683    2.4  33.0   28.5   3.1446   4.8 ------	UNKNOWN
 18.4995 -53.7396    2.9  54.3    5.5   7.1692   3.9 ------	UNKNOWN
 13.1610 -52.9065    3.1  56.7    2.8  10.2066   3.7 ------	UNKNOWN
 39.0202 -72.4252    4.9  34.9   -4.7   1.4545   2.4 ------	UNKNOWN
125.0178 -69.2295    2.8   9.5  -22.2   1.9739   4.2 ------	UNKNOWN
154.0099 -70.8020    3.4  14.0  -67.9   1.6558   3.4 ------	UNKNOWN
173.7894 -10.0407    2.6  59.1 -166.1  15.4386   4.4 ------	UNKNOWN
196.3998 -73.6931    4.4  26.9  -70.8   1.6199   2.7 ------	UNKNOWN
340.6599 -65.3166    3.0  52.6  -21.8   4.8825   3.8 ------	UNKNOWN