Analysis Summary
Notes:
- 1) No attempt has been made to eliminate the non-significant decimal places.
- 2) This batgrbproduct analysis is done using the HEASARC data.
- 3) This batgrbproduct analysis is using the flight position for the mask-weighting calculation.
==========================================================================
BAT GROUND-DETECTED GRB DATA PROCESSING REPORT
(This burst occurred during telescope slew)
Process Script Ver: batgrbproduct v2.46
Process Start Time: Mon Mar 23 01:32:46 EDT 2015
Host Name: bat1
Current Working Dir: /local/data/bat1/alien/Swift_3rdBATcatalog/event/batevent_reproc/GRB131224B
======================================================================
Trigger: 00032923 Segment: 023
BAT Trigger Time: 409548319.208
UTC: 2013-12-24T03:25:07.777 [includes UTCF correction]
Where From?: Ground analysis (best_duration.txt)
NOTE: BAT trigger time for ground-detected burst during slew is the T100 start time.
Refined Position: [ source = BAT mosaic image ]
RA: 163.720024284771 Dec: -14.1831090869033 [deg; J2000]
{ 10h 54m 52.8s , -14d -10' -59.2" }
+/- 1.97341576481 [arcmin] (estimated 90% radius based on SNR)
SNR: 11.5195191252
Angular difference between the analysis and refined position is Usage: arcmin
Partial Coding Fraction: Unavailable because the burst occurred during slew.
Duration
T90: 8.34799998998642 +/- 1.07690850813724
Measured from: 0.308
to: 8.656 [s; relative to TRIGTIME]
T50: 5.63199996948242 +/- 3.68330498596112
Measured from: 1.176
to: 6.808 [s; relative to TRIGTIME]
====== Table of the duration information =============================
Value tstart tstop
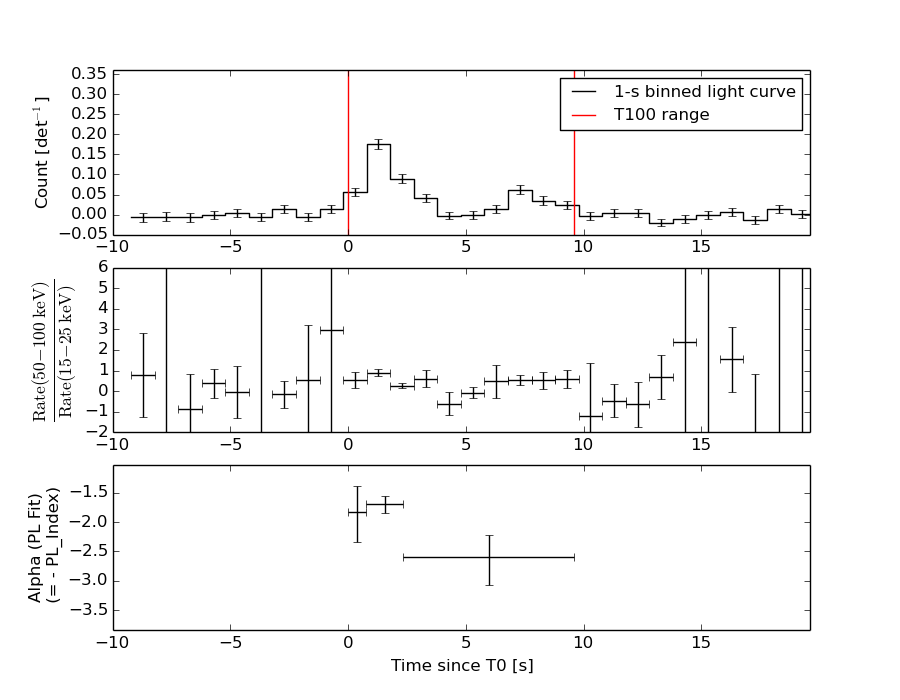
T100 9.616 0.000 9.616
T90 8.348 0.308 8.656
T50 5.632 1.176 6.808
Peak 1.000 0.976 1.976
====== Spectral Analysis Summary =====================================
Model : spectral model: simple power-law (PL) and cutoff power-law (CPL)
Ph_index : photon index: E^{Ph_index}
Ph_90err : 90% error of the photon index
Epeak : Epeak in keV
Epeak_90err: 90% error of Epeak
Norm : normalization at 50 keV in both the PL model and CPL model
Nomr_90err : 90% error of the normalization
chi2 : Chi-Squared
dof : degree of freedo
=== Time-averaged spectral analysis ===
(Best model with acceptable fit: PL)
Model Ph_index Ph_90err_low Ph_90err_hi Epeak Epeak_90err_low Epeak_90err_hi Norm Nomr_90err_low Norm_90err_hi chi2 dof
PL -2.080 -0.194 0.183 - - - 2.91e-03 -3.92e-04 3.84e-04 60.240 57
CPL -1.052 -0.815 1.019 36.250 -17.269 11.048 1.20e-02 -1.20e-02 3.85e-02 55.380 56
=== 1-s peak spectral analysis ===
(Best model with acceptable fit: PL)
Model Ph_index Ph_90err_low Ph_90err_hi Epeak Epeak_90err_low Epeak_90err_hi Norm Nomr_90err_low Norm_90err_hi chi2 dof
PL -1.690 -0.171 0.166 - - - 1.10e-02 -1.27e-03 1.25e-03 56.920 57
CPL -0.249 -0.833 1.043 53.663 -8.572 17.942 6.96e-02 -6.96e-02 1.98e-01 47.010 56
=== Fluence/Peak Flux Summary ===
Model Band1 Band2 Band3 Band4 Band5 Total
15-25 25-50 50-100 100-350 15-150 15-350 keV
Fluence PL 6.17e-08 7.98e-08 7.56e-08 1.26e-07 2.59e-07 3.44e-07 erg/cm2
90%_error_low -8.12e-09 -8.15e-09 -1.36e-08 -3.92e-08 -3.15e-08 -5.70e-08 erg/cm2
90%_error_hi 8.27e-09 8.11e-09 1.40e-08 4.95e-08 3.23e-08 6.49e-08 erg/cm2
Peak flux PL 5.42e-01 4.87e-01 3.02e-01 2.85e-01 1.45e+00 1.62e+00 ph/cm2/s
90%_error_low -8.20e-02 -5.13e-02 -4.40e-02 -7.22e-02 -1.52e-01 -1.72e-01 ph/cm2/s
90%_error_hi 8.46e-02 5.12e-02 4.41e-02 8.53e-02 1.52e-01 1.72e-01 ph/cm2/s
Fluence CPL 5.78e-08 9.00e-08 6.87e-08 1.26e-07 2.35e-07 3.43e-07 erg/cm2
90%_error_low -9.03e-09 -1.13e-08 -1.82e-08 -2.52e-08 -3.30e-08 -5.61e-08 erg/cm2
90%_error_hi 9.02e-09 1.17e-08 1.69e-08 5.71e-08 3.62e-08 6.29e-08 erg/cm2
Peak flux CPL 4.60e-01 5.75e-01 3.12e-01 6.47e-02 1.40e+00 1.41e+00 ph/cm2/s
90%_error_low -9.56e-02 -7.18e-02 -5.60e-02 N/A -1.54e-01 -1.60e-01 ph/cm2/s
90%_error_hi 9.72e-02 7.51e-02 5.36e-02 N/A 1.54e-01 1.65e-01 ph/cm2/s
======================================================================
Image
Note1: The mosaic image is made with timebin = 0.05 s; energybin = 15-350 keV
Note2: The mosaic image uses Galactic coordinate.
#RAcent DECcent POSerr Theta  Phi  Peak_Cts  SNR Name
163.720 -14.183 0.006 34.503 -96.026 0.040 11.520 UNKNOWN

Image time interval: 0.000 to 9.616 [sec]
Light Curves
Note: The mask-weighted lightcurves have units of either count/det or counts/sec/det, where a det is 0.4 x 0.4 = 0.16 sq cm.
Best duration plot
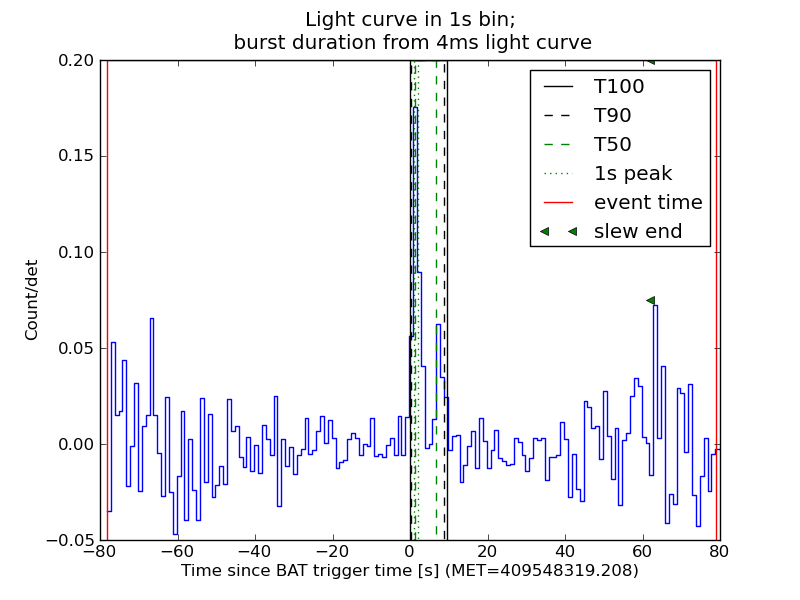
Full-time range; 1 s binning
Other quick-look light curves:
- 64 ms binning (zoomed)
- 16 ms binning (zoomed)
- 8 ms binning (zoomed)
- 2 ms binning (zoomed)
- SN=5 or 10 s binning (full-time range)
- Raw light curve
Spectra
- 64 ms binning (zoomed)
- 16 ms binning (zoomed)
- 8 ms binning (zoomed)
- 2 ms binning (zoomed)
- SN=5 or 10 s binning (full-time range)
- Raw light curve
Spectra
Notes:
- 1) The fitting includes the systematic errors.
- 2) When the burst includes telescope slew time periods, the fitting uses an average response file made from multiple 5-s response files through out the slew time plus single time preiod for the non-slew times, and weighted by the total counts in the corresponding time period using addrmf. An average response file is needed becuase a spectral fit using the pre-slew DRM will introduce some errors in both a spectral shape and a normalization if the PHA file contains a lot of the slew/post-slew time interval.
- 3) For fits to more complicated models (e.g. a power-law over a cutoff power-law), the BAT team has decided to require a chi-square improvement of more than 6 for each extra dof.
Time averaged spectrum fit using the average DRM
Power-law model
Time interval is from    0.000 sec. to    9.616 sec.

Spectral model in power-law:
------------------------------------------------------------
Parameters  : value       lower 90%   higher 90%
Photon index: -2.07977     ( -0.193948   0.182939 )
Norm@50keV  : 2.90872E-03    ( -0.000391807   0.000384479 )
------------------------------------------------------------
#Fit statistic : Chi-Squared =          60.24 using 59 PHA bins.
# Reduced chi-squared =          1.057 for     57 degrees of freedom
# Null hypothesis probability =   3.594497e-01

Photon flux (15-150 keV)    in 9.616 sec: 0.453137 ( -0.044842  0.044842 ) ph/cm2/s
Energy fluence (15-150 keV)             : 2.59439e-07 ( -3.15072e-08  3.22599e-08 ) ergs/cm2
Cutoff power-law model
Time interval is from    0.000 sec. to    9.616 sec.
Spectral model in the cutoff power-law:
------------------------------------------------------------
Parameters  : value       lower 90%   higher 90%
Photon index: -1.05212     ( -0.814532   1.01865 )
Epeak [keV] : 36.2502      ( -17.2694 11.0482 )
Norm@50keV  : 1.20164E-02    ( -0.0120164   0.0385409 )
------------------------------------------------------------
#Fit statistic : Chi-Squared =          55.38 using 59 PHA bins.
# Reduced chi-squared =         0.9889 for     56 degrees of freedom
# Null hypothesis probability =   4.983024e-01

Photon flux (15-150 keV)    in 9.616 sec: 0.438822 ( -0.045703  0.045898 ) ph/cm2/s
Energy fluence (15-150 keV)             : 2.34533e-07 ( -3.3015e-08  3.61519e-08 ) ergs/cm2
1-s peak spectrum fit
Power-law model
Time interval is from    0.976 sec. to    1.976 sec.

Spectral model in power-law:
------------------------------------------------------------
Parameters  : value       lower 90%   higher 90%
Photon index: -1.69029     ( -0.171427   0.166385 )
Norm@50keV  : 1.09598E-02    ( -0.00126858   0.00125397 )
------------------------------------------------------------
#Fit statistic : Chi-Squared =          56.92 using 59 PHA bins.
# Reduced chi-squared =         0.9985 for     57 degrees of freedom
# Null hypothesis probability =   4.781834e-01

Photon flux (15-150 keV)    in 1 sec: 1.45074 ( -0.15185  0.15189 ) ph/cm2/s
Energy fluence (15-150 keV)             : 1.01571e-07 ( -1.22569e-08  1.24199e-08 ) ergs/cm2
Cutoff power-law model
Time interval is from    0.976 sec. to    1.976 sec.
Spectral model in the cutoff power-law:
------------------------------------------------------------
Parameters  : value       lower 90%   higher 90%
Photon index: -0.248767     ( -0.833295   1.04337 )
Epeak [keV] : 53.6625      ( -8.57201 17.9425 )
Norm@50keV  : 6.95718E-02    ( -0.0695724   0.197736 )
------------------------------------------------------------
#Fit statistic : Chi-Squared =          47.01 using 59 PHA bins.
# Reduced chi-squared =         0.8395 for     56 degrees of freedom
# Null hypothesis probability =   7.983061e-01

Photon flux (15-150 keV)    in 1 sec: 1.39987 ( -0.15424  0.15444 ) ph/cm2/s
Energy fluence (15-150 keV)             : 9.10794e-08 ( -1.27022e-08  1.33926e-08 ) ergs/cm2
Time-resolved spectra
Distribution
T90 vs. Hardness ratio plot
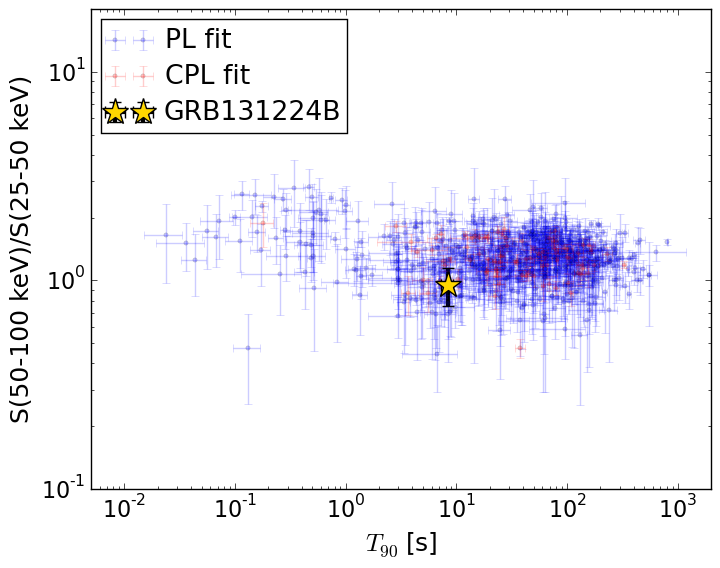
T90                                   = 8.348 sec.
Hardness ratio (energy fluence ratio) = 0.946259078231
S(15-50 keV) vs. S(50-150 keV) plot
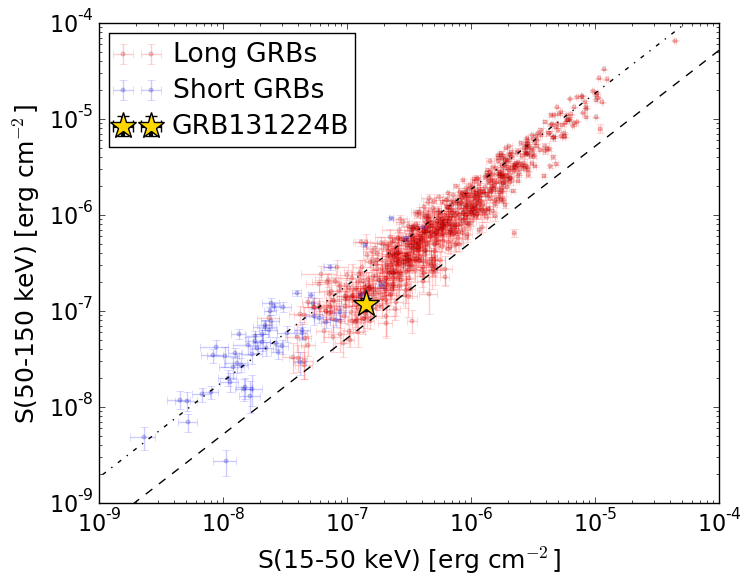
S(15-50 keV)  = 1.4158592e-07
S(50-150 keV) = 1.1785367e-07
The dash-dotted line and the dashed line traces the fluences calculated from the Band function with Epeak = 15 and 150 keV, respectively. Both lines assume a canonical values of alpha = -1 and beta = -2.5.
Mask shadow pattern
Mask shadow pattern unavailable because this burst occurs during telescope slews.Spacecraft aspect plot