Analysis Summary
Notes:
- 1) No attempt has been made to eliminate the non-significant decimal places.
- 2) This batgrbproduct analysis is done using the HEASARC data.
- 3) This batgrbproduct analysis is using the flight position for the mask-weighting calculation.
======================================================================
                  BAT GRB EVENT DATA PROCESSING REPORT
    Process Script Ver: batgrbproduct v2.46
    Process Start Time: Wed May  6 16:46:40 EDT 2015
             Host Name: bat1
   Current Working Dir: /local/data/bat1/alien/Swift_3rdBATcatalog/event/batevent_reproc/trigger582123
======================================================================

  Trigger: 00582123      Segment: 000

  BAT Trigger Time: 409729671.104   [s; MET]
      Trigger Stop: 409729671.36   [s; MET]
               UTC: 2013-12-26T05:47:39.664000    [includes UTCF correction]
       Where From?: TDRSS position message

  BAT
    RA: 301.307357529942   Dec: -64.9622775984442  [deg; J2000]

     Catalogged Source?: NO
     Point Source?:      YES
     GRB Indicated?:     YES    [ by BAT flight software ]
     Image S/N Ratio:    14.93
     Image Trigger?:     NO
     Rate S/N Ratio:     29.4278779391243  [ if not an image trigger ]
     Image S/N Ratio:    14.93

  Analysis Position:   [ source = BAT ]
    RA: 301.307357529942   Dec: -64.9622775984442  [deg; J2000]

  Refined Position:   [ source = BAT pre-slew burst ]
    RA: 301.310097634465   Dec: -64.9428920986582  [deg; J2000]
        { 20h 05m 14.4s , -64d 56' 34.4" }
         +/- 0.582804747745653 [arcmin] (estimated 90% radius based on SNR)
         +/- 0.149979273100191 [arcmin] (formal 1-sigma fit error)
    SNR: 65.7787183129463

  Angular difference between the analysis and refined position is 1.165211 arcmin

  Partial Coding Fraction: 0.5625    [ including projection effects ]

  Duration
     T90: 7.2279999256134 +/- 0.156205012444484
        Measured from: 0.380000054836273
                   to: 7.60799998044968     [s; relative to TRIGTIME]
     T50: 2.97599995136261 +/- 0.0920869208510307
        Measured from: 1.65200001001358
                   to: 4.62799996137619     [s; relative to TRIGTIME]


  Fluence
     Peak Flux  (peak 1 second)
        Measured from: 1.10800004005432
                   to: 2.10800004005432     [s; relative to TRIGTIME]
     Total Fluence
        Measured from: -0.255999982357025
                   to: 8.70400005578995     [s; relative to TRIGTIME]

             Band 1     Band 2     Band 3     Band 4
              15-25      25-50     50-100    100-350     keV
 Total     1.551130   2.199440   1.893370   0.542249
           0.032661   0.036741   0.034929   0.025342 [error]
 Peak      0.342158   0.472654   0.353099   0.108350
           0.013211   0.015086   0.014387   0.009958 [error]

     [ fluence units of on-axis counts / fully illuminated detector ]

======================================================================


====== Table of the duration information =============================

        Value   tstart    tstop
T100    8.960   -0.256    8.704
T90     7.228    0.380    7.608
T50     2.976    1.652    4.628
Peak    1.000    1.108    2.108


====== Spectral Analysis Summary =====================================

Model      : spectral model: simple power-law (PL) and cutoff power-law (CPL)
Ph_index   : photon index: E^{Ph_index}
Ph_90err   : 90% error of the photon index
Epeak      : Epeak in keV
Epeak_90err: 90% error of Epeak
Norm       : normalization at 50 keV in both the PL model and CPL model
Nomr_90err : 90% error of the normalization
chi2       : Chi-Squared
dof        : degree of freedo

=== Time-averaged spectral analysis ===
(Best model with acceptable fit: PL)

Model Ph_index Ph_90err_low Ph_90err_hi  Epeak  Epeak_90err_low  Epeak_90err_hi  Norm       Nomr_90err_low    Norm_90err_hi    chi2    dof
PL      -1.380    -0.042      0.042       -           -               -         4.62e-02     -1.00e-03          1.00e-03      55.080   57
CPL     -1.300    -0.119      0.135      469.679    -469.679      -469.679      5.01e-02     -5.95e-03          6.61e-03      55.320   56


=== 1-s peak spectral analysis ===
(Best model with acceptable fit: PL)

Model Ph_index Ph_90err_low Ph_90err_hi  Epeak  Epeak_90err_low  Epeak_90err_hi  Norm       Nomr_90err_low    Norm_90err_hi    chi2    dof
PL      -1.487     -0.071     0.070       -           -               -         8.33e-02     -3.24e-03          3.23e-03      46.980   57
CPL     -1.371     -0.153     0.275      286.685    -286.685      -286.685      9.47e-02     -1.40e-02          3.26e-02      46.410   56


=== Fluence/Peak Flux Summary ===

              Model    Band1     Band2     Band3     Band4     Band5     Total
                       15-25     25-50    50-100    100-350    15-150    15-350    keV
Fluence         PL   4.73e-07  9.34e-07  1.44e-06  4.82e-06  4.02e-06  7.66e-06   erg/cm2
      90%_error_low -2.16e-08 -2.48e-08 -3.65e-08 -2.84e-07 -9.09e-08 -3.01e-07   erg/cm2
      90%_error_hi   2.21e-08  2.47e-08  3.64e-08  2.96e-07  9.10e-08  3.10e-07   erg/cm2
Peak flux       PL   3.39e+00  3.44e+00  2.45e+00  2.79e+00  1.04e+01  1.21e+01   ph/cm2/s
      90%_error_low -2.40e-01 -1.47e-01 -1.20e-01 -2.78e-01 -4.13e-01 -4.65e-01   ph/cm2/s
      90%_error_hi   2.46e-01  1.46e-01  1.19e-01  2.96e-01  4.14e-01  4.66e-01   ph/cm2/s

Fluence        CPL   4.67e-07  9.36e-07  1.44e-06  4.80e-06  4.01e-06  7.39e-06   erg/cm2
      90%_error_low -2.93e-08 -2.50e-08 -2.12e-08 -1.15e-06 -9.74e-08 -8.34e-07   erg/cm2
      90%_error_hi   2.34e-08  2.56e-08  4.29e-08  2.04e-07  9.36e-08  3.67e-07   erg/cm2
Peak flux      CPL   3.30e+00  3.46e+00  2.48e+00  2.44e+00  1.03e+01  1.17e+01   ph/cm2/s
      90%_error_low -3.02e-01 -1.58e-01 -1.33e-01 -6.21e-01 -4.41e-01 -8.01e-01   ph/cm2/s
      90%_error_hi   2.71e-01  1.61e-01  1.35e-01  4.03e-01  4.41e-01  4.43e-01   ph/cm2/s

======================================================================
Image
Pre-slew 15.0-350.0 keV image (Event data)
#   RAcent    DECcent   POSerr    Theta     Phi              Peak Cts       SNR   Name
  301.3101   -64.9429   0.0029    25.6622   -92.3264         6.2985194     65.779 TRIG_00582123

Foreground time interval of the image:
 -0.256   8.704 (delta_t =   8.960 [sec])
Background time interval of the image:
-239.104  -0.256 (delta_t = 238.848 [sec])
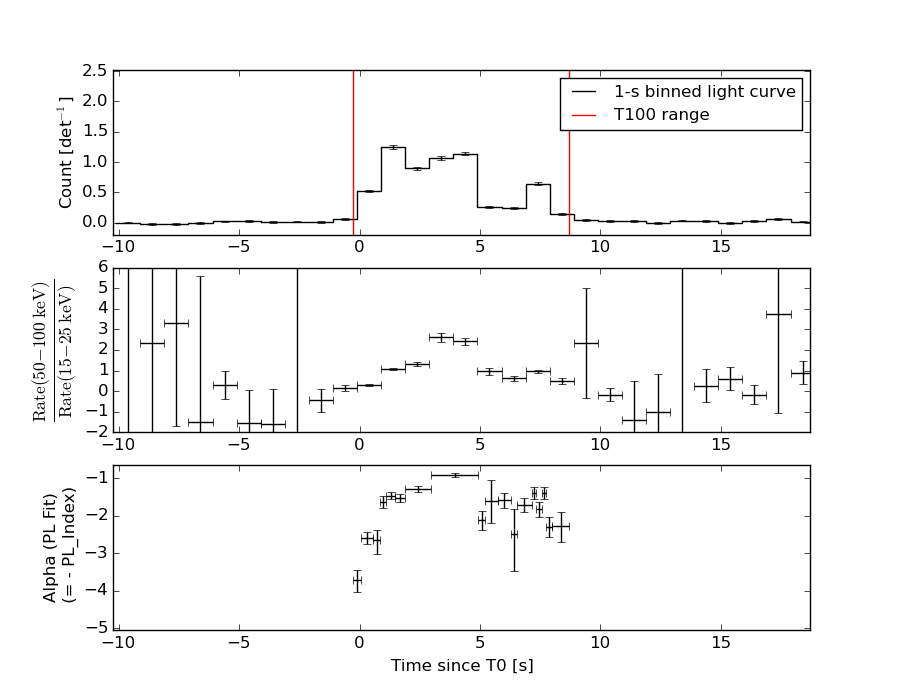
Light Curves
Note: The mask-weighted lightcurves have units of either count/det or counts/sec/det, where a det is 0.4 x 0.4 = 0.16 sq cm.
Full-time range; 1 s binning
Other quick-look light curves:
- 64 ms binning (zoomed)
- 16 ms binning (zoomed)
- 8 ms binning (zoomed)
- 2 ms binning (zoomed)
- SN=5 or 10 s binning (full-time range)
- Raw light curve
Spectra
- 64 ms binning (zoomed)
- 16 ms binning (zoomed)
- 8 ms binning (zoomed)
- 2 ms binning (zoomed)
- SN=5 or 10 s binning (full-time range)
- Raw light curve
Spectra
Notes:
- 1) The fitting includes the systematic errors.
- 2) When the burst includes telescope slew time periods, the fitting uses an average response file made from multiple 5-s response files through out the slew time plus single time preiod for the non-slew times, and weighted by the total counts in the corresponding time period using addrmf. An average response file is needed becuase a spectral fit using the pre-slew DRM will introduce some errors in both a spectral shape and a normalization if the PHA file contains a lot of the slew/post-slew time interval.
- 3) For fits to more complicated models (e.g. a power-law over a cutoff power-law), the BAT team has decided to require a chi-square improvement of more than 6 for each extra dof.
Time averaged spectrum fit using the average DRM
Power-law model

Time interval is from   -0.256 sec. to    8.704 sec.

Spectral model in power-law:
------------------------------------------------------------
Parameters  : value       lower 90%   higher 90%
Photon index: -1.38047     ( -0.041581   0.0415988 )
Norm@50keV  : 4.61936E-02    ( -0.00100214   0.00100182 )
------------------------------------------------------------
#Fit statistic : Chi-Squared =          55.08 using 59 PHA bins.
# Reduced chi-squared =         0.9664 for     57 degrees of freedom
# Null hypothesis probability =   5.473267e-01

Photon flux (15-150 keV)    in 8.96 sec: 5.60119 ( -0.13582  0.1364 ) ph/cm2/s
Energy fluence (15-150 keV)             : 4.01613e-06 ( -9.08759e-08  9.09942e-08 ) ergs/cm2
Cutoff power-law model
Time interval is from   -0.256 sec. to    8.704 sec.
Spectral model in the cutoff power-law:
------------------------------------------------------------
Parameters  : value       lower 90%   higher 90%
Photon index: -1.37563     ( -0.084234   0.170213 )
Epeak [keV] : 9996.08      ( -845.031 -845.031 )
Norm@50keV  : 4.64570E-02    ( -0.00424351   0.0083123 )
------------------------------------------------------------
#Fit statistic : Chi-Squared =          55.07 using 59 PHA bins.
# Reduced chi-squared =         0.9835 for     56 degrees of freedom
# Null hypothesis probability =   5.099329e-01

Photon flux (15-150 keV)    in 8.96 sec: 3.32902 ( -0.19893  0.15952 ) ph/cm2/s
Energy fluence (15-150 keV)             : 4.00606e-06 ( -9.73997e-08  9.36006e-08 ) ergs/cm2
1-s peak spectrum fit
Power-law model
Time interval is from    1.108 sec. to    2.108 sec.

Spectral model in power-law:
------------------------------------------------------------
Parameters  : value       lower 90%   higher 90%
Photon index: -1.48732     ( -0.0709083   0.0704796 )
Norm@50keV  : 8.33346E-02    ( -0.0032392   0.00323221 )
------------------------------------------------------------
#Fit statistic : Chi-Squared =          46.98 using 59 PHA bins.
# Reduced chi-squared =         0.8242 for     57 degrees of freedom
# Null hypothesis probability =   8.254309e-01

Photon flux (15-150 keV)    in 1 sec: 10.3686 ( -0.41328  0.4139 ) ph/cm2/s
Energy fluence (15-150 keV)             : 7.92319e-07 ( -3.3689e-08  3.38141e-08 ) ergs/cm2
Cutoff power-law model
Time interval is from    1.108 sec. to    2.108 sec.
Spectral model in the cutoff power-law:
------------------------------------------------------------
Parameters  : value       lower 90%   higher 90%
Photon index: -1.37114     ( -0.152544   0.274832 )
Epeak [keV] : 286.685      ( -286.686 -286.686 )
Norm@50keV  : 9.47419E-02    ( -0.0140299   0.0325623 )
------------------------------------------------------------
#Fit statistic : Chi-Squared =          46.41 using 59 PHA bins.
# Reduced chi-squared =         0.8288 for     56 degrees of freedom
# Null hypothesis probability =   8.158578e-01

Photon flux (15-150 keV)    in 1 sec: 10.2985 ( -0.44056  0.4412 ) ph/cm2/s
Energy fluence (15-150 keV)             : 7.86122e-07 ( -3.66421e-08  3.63858e-08 ) ergs/cm2
Time-resolved spectra
Distribution
T90 vs. Hardness ratio plot
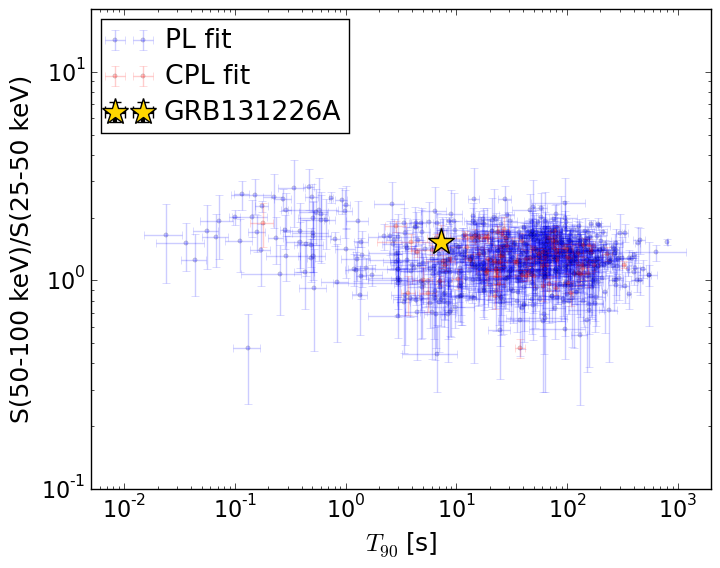
T90                                   = 7.228 sec.
Hardness ratio (energy fluence ratio) = 1.53642124513
S(15-50 keV) vs. S(50-150 keV) plot
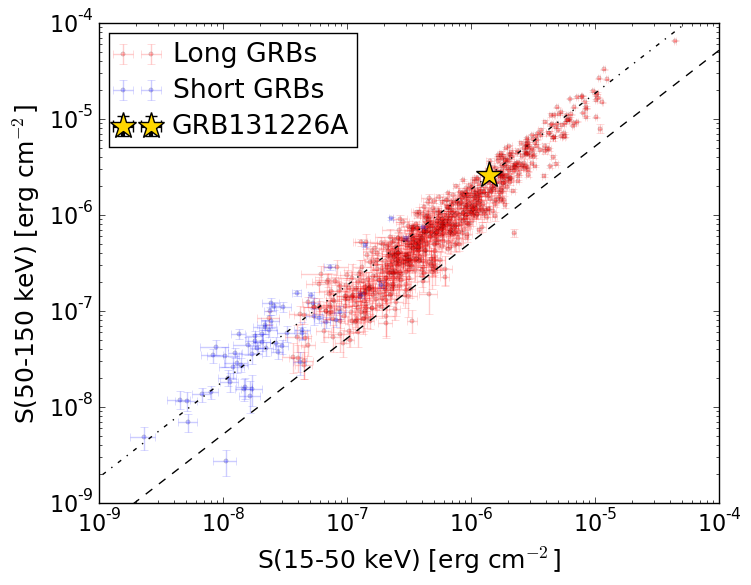
S(15-50 keV)  = 1.4067565e-06
S(50-150 keV) = 2.609351e-06
The dash-dotted line and the dashed line traces the fluences calculated from the Band function with Epeak = 15 and 150 keV, respectively. Both lines assume a canonical values of alpha = -1 and beta = -2.5.
Mask shadow pattern
IMX = -1.950279525749544E-02, IMY = 4.800583447882256E-01
Spacecraft aspect plot
Bright source in the pre-burst/pre-slew/post-slew images
Pre-burst image of 15-350 keV band
Time interval of the image:
-239.104000 -0.256000

# RAcent  DECcent POSerr Theta    Phi  PeakCts   SNR AngSep     Name
#  [deg]    [deg]    ['] [deg]  [deg]                   [']
170.0940 -60.6563    3.8  45.9 -177.6   1.1604   3.0    6.8	Cen X-3
186.4030 -62.7616   12.2  44.7 -166.5   0.3377   0.9    7.0	GX 301-2
172.4551 -74.5950    2.3  32.4 -172.0   1.1859   5.1 ------	UNKNOWN
Pre-slew background subtracted image of 15-350 keV band
Time interval of the image:
-0.256000 8.704000

# RAcent  DECcent POSerr Theta    Phi  PeakCts   SNR AngSep     Name
#  [deg]    [deg]    ['] [deg]  [deg]                   [']
170.0815 -60.7109    9.7  45.9 -177.6  -0.1620  -1.2    8.7	Cen X-3
186.3347 -62.6476    5.5  44.8 -166.5   0.2521   2.1   11.5	GX 301-2
133.7007 -53.0282    2.8  47.8  153.6   0.9056   4.2 ------	UNKNOWN
350.7633 -47.8336    2.5  26.8  -17.7   0.3270   4.7 ------	UNKNOWN
301.3101 -64.9429    0.2  25.7  -92.3   6.2979  65.8 ------	UNKNOWN
Post-slew image of 15-350 keV band
Time interval of the image:
292.196630 963.003800

# RAcent  DECcent POSerr Theta    Phi  PeakCts   SNR AngSep     Name
#  [deg]    [deg]    ['] [deg]  [deg]                   [']
170.5710 -60.4861    9.2  53.9  164.5   3.0167   1.3   11.1	Cen X-3
186.4294 -62.7532    5.0  49.5  172.7   2.1640   2.3    6.3	GX 301-2
264.5613 -44.3346    0.0  38.5 -119.7   0.3553   0.5   10.4	4U 1735-44
 36.3420 -69.8609    2.6  26.8  102.9   2.5164   4.4 ------	UNKNOWN
195.8921 -58.1919    3.1  51.8 -179.4   4.3463   3.8 ------	UNKNOWN
303.0709 -21.6962    2.4  44.9  -60.3   8.6147   4.8 ------	UNKNOWN