Analysis Summary
Notes:
- 1) No attempt has been made to eliminate the non-significant decimal places.
- 2) This batgrbproduct analysis is done using the HEASARC data.
- 3) This batgrbproduct analysis is using the flight position for the mask-weighting calculation.
======================================================================
BAT GRB EVENT DATA PROCESSING REPORT
Process Script Ver: batgrbproduct v2.46
Process Start Time: Mon Mar 3 23:35:12 EST 2014
Host Name: batevent1
Current Working Dir: /local/data/batevent/batevent_reproc/trigger582760
======================================================================
Trigger: 00582760 Segment: 000
BAT Trigger Time: 410390269.312 [s; MET]
Trigger Stop: 410390269.376 [s; MET]
UTC: 2014-01-02T21:17:37.841180 [includes UTCF correction]
Where From?: (*SHORT BURST*) TDRSS scaled map message
BAT
RA: 211.90218533779 Dec: 1.3311796378584 [deg; J2000]
Catalogged Source?: NO
Point Source?: YES
GRB Indicated?: YES [ by BAT flight software ]
Image S/N Ratio: 9.72
Image Trigger?: NO
Rate S/N Ratio: 30.8382878902185 [ if not an image trigger ]
Image S/N Ratio: 9.72
Analysis Position: [ source = BAT ]
RA: 211.90218533779 Dec: 1.3311796378584 [deg; J2000]
Refined Position: [ source = BAT pre-slew burst ]
RA: 211.914563700213 Dec: 1.33207910409454 [deg; J2000]
{ 14h 07m 39.5s , +01d 19' 55.5" }
+/- 0.418806864816995 [arcmin] (estimated 90% radius based on SNR)
+/- 0.105252161894942 [arcmin] (formal 1-sigma fit error)
SNR: 105.462649436279
Angular difference between the analysis and refined position is 0.744460 arcmin
Partial Coding Fraction: 0.9921875 [ including projection effects ]
Duration
T90: 55.0799999237061 +/- 15.4181167886652
Measured from: 0.456000030040741
to: 55.5359999537468 [s; relative to TRIGTIME]
T50: 2.24799996614456 +/- 0.116275557221038
Measured from: 1.17599999904633
to: 3.42399996519089 [s; relative to TRIGTIME]
Fluence
Peak Flux (peak 1 second)
Measured from: 1.96799999475479
to: 2.96799999475479 [s; relative to TRIGTIME]
Total Fluence
Measured from: -0.148000001907349
to: 131.22000002861 [s; relative to TRIGTIME]
Band 1 Band 2 Band 3 Band 4
15-25 25-50 50-100 100-350 keV
Total 2.996134 4.372460 3.547931 0.955761
0.068263 0.071841 0.064336 0.053929 [error]
Peak 0.704925 1.303514 1.365649 0.413499
0.013969 0.018722 0.019786 0.013564 [error]
[ fluence units of on-axis counts / fully illuminated detector ]
======================================================================
====== Table of the duration information =============================
Value tstart tstop
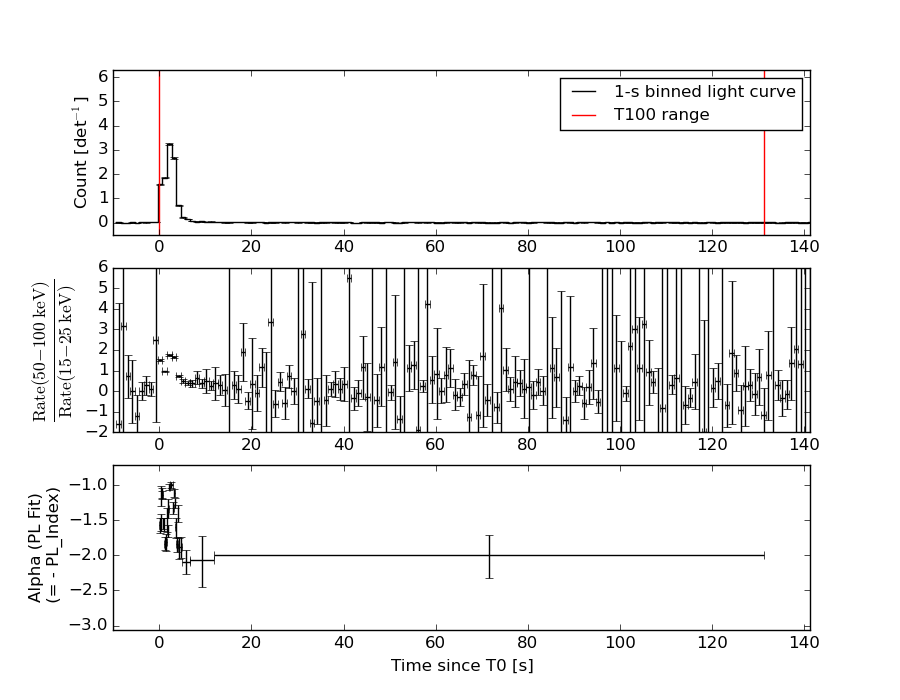
T100 131.368 -0.148 131.220
T90 55.080 0.456 55.536
T50 2.248 1.176 3.424
Peak 1.000 1.968 2.968
====== Spectral Analysis Summary =====================================
Model : spectral model: simple power-law (PL) and cutoff power-law (CPL)
Ph_index : photon index: E^{Ph_index}
Ph_90err : 90% error of the photon index
Epeak : Epeak in keV
Epeak_90err: 90% error of Epeak
Norm : normalization at 50 keV in both the PL model and CPL model
Nomr_90err : 90% error of the normalization
chi2 : Chi-Squared
dof : degree of freedo
=== Time-averaged spectral analysis ===
(Best model with acceptable fit: PL)
Model Ph_index Ph_90err_low Ph_90err_hi Epeak Epeak_90err_low Epeak_90err_hi Norm Nomr_90err_low Norm_90err_hi chi2 dof
PL -1.374 -0.042 0.042 - - - 5.97e-03 -1.29e-04 1.28e-04 36.660 57
CPL -1.230 -0.129 0.170 304.156 -132.814 -304.156 6.91e-03 -9.77e-04 1.26e-03 34.410 56
=== 1-s peak spectral analysis ===
(Best model with acceptable fit: N/A)
Model Ph_index Ph_90err_low Ph_90err_hi Epeak Epeak_90err_low Epeak_90err_hi Norm Nomr_90err_low Norm_90err_hi chi2 dof
PL -1.036 -0.034 0.034 - - - 2.58e-01 -4.95e-03 4.94e-03 50.310 57
CPL -0.793 -0.138 0.142 303.282 -88.496 297.504 3.25e-01 -3.94e-02 4.61e-02 41.130 56
=== Fluence/Peak Flux Summary ===
Model Band1 Band2 Band3 Band4 Band5 Total
15-25 25-50 50-100 100-350 15-150 15-350 keV
Fluence PL 8.90e-07 1.77e-06 2.72e-06 9.21e-06 7.62e-06 1.46e-05 erg/cm2
90%_error_low -4.08e-08 -4.68e-08 -6.88e-08 -5.42e-07 -1.71e-07 -5.71e-07 erg/cm2
90%_error_hi 4.15e-08 4.66e-08 6.87e-08 5.65e-07 1.71e-07 5.91e-07 erg/cm2
Peak flux PL 2.96e-03 3.56e-02 4.01e-01 3.60e+01 1.88e+00 3.62e+01 ph/cm2/s
90%_error_low N/A N/A N/A N/A N/A N/A ph/cm2/s
90%_error_hi N/A N/A N/A N/A N/A N/A ph/cm2/s
Fluence CPL 8.56e-07 1.78e-06 2.76e-06 7.63e-06 7.55e-06 1.30e-05 erg/cm2
90%_error_low -5.45e-08 -4.87e-08 -7.92e-08 -1.44e-06 -1.89e-07 -1.44e-06 erg/cm2
90%_error_hi 5.56e-08 4.89e-08 7.97e-08 1.52e-06 1.89e-07 2.59e-06 erg/cm2
Peak flux CPL N/A N/A N/A N/A N/A N/A ph/cm2/s
90%_error_low N/A N/A N/A N/A N/A N/A ph/cm2/s
90%_error_hi N/A N/A N/A N/A N/A N/A ph/cm2/s
======================================================================
Image
Pre-slew 15.0-350.0 keV image (Event data)
#   RAcent    DECcent   POSerr    Theta     Phi              Peak Cts       SNR   Name
  211.9146     1.3321   0.0018    15.4023    -4.5242        11.1562718    105.463 TRIG_00582760

Foreground time interval of the image:
 -0.148   9.189 (delta_t =   9.337 [sec])
Background time interval of the image:
-50.011  -0.148 (delta_t =  49.863 [sec])
Light Curves
Note: The mask-weighted lightcurves have units of either count/det or counts/sec/det, where a det is 0.4 x 0.4 = 0.16 sq cm.
Full-time range; 1 s binning
Other quick-look light curves:
- 64 ms binning (zoomed)
- 16 ms binning (zoomed)
- 8 ms binning (zoomed)
- 2 ms binning (zoomed)
- SN=5 or 10 s binning (full-time range)
- Raw light curve
Spectra
- 64 ms binning (zoomed)
- 16 ms binning (zoomed)
- 8 ms binning (zoomed)
- 2 ms binning (zoomed)
- SN=5 or 10 s binning (full-time range)
- Raw light curve
Spectra
Notes:
- 1) The fitting includes the systematic errors.
- 2) When the burst includes telescope slew time periods, the fitting uses an average response file made from multiple 5-s response files through out the slew time plus single time preiod for the non-slew times, and weighted by the total counts in the corresponding time period using addrmf. An average response file is needed becuase a spectral fit using the pre-slew DRM will introduce some errors in both a spectral shape and a normalization if the PHA file contains a lot of the slew/post-slew time interval.
- 3) For fits to more complicated models (e.g. a power-law over a cutoff power-law), the BAT team has decided to require a chi-square improvement of more than 6 for each extra dof.
Time averaged spectrum fit using the average DRM
Power-law model
Time interval is from   -0.148 sec. to  131.220 sec.

Spectral model in power-law:
------------------------------------------------------------
Parameters  : value       lower 90%   higher 90%
Photon index: -1.37422     ( -0.0415434   0.0416163 )
Norm@50keV  : 5.96584E-03    ( -0.000128529   0.000128483 )
------------------------------------------------------------
#Fit statistic : Chi-Squared =          36.66 using 59 PHA bins.
# Reduced chi-squared =         0.6431 for     57 degrees of freedom
# Null hypothesis probability =   9.834503e-01

Photon flux (15-150 keV)    in 131.4 sec: 0.722403 ( -0.017412  0.017464 ) ph/cm2/s
Energy fluence (15-150 keV)             : 7.61668e-06 ( -1.71326e-07  1.7131e-07 ) ergs/cm2
Cutoff power-law model
Time interval is from   -0.148 sec. to  131.220 sec.
Spectral model in the cutoff power-law:
------------------------------------------------------------
Parameters  : value       lower 90%   higher 90%
Photon index: -1.22975     ( -0.129131   0.170124 )
Epeak [keV] : 304.156      ( -132.814 -304.156 )
Norm@50keV  : 6.90632E-03    ( -0.000976659   0.00126157 )
------------------------------------------------------------
#Fit statistic : Chi-Squared =          34.41 using 59 PHA bins.
# Reduced chi-squared =         0.6145 for     56 degrees of freedom
# Null hypothesis probability =   9.897802e-01

Photon flux (15-150 keV)    in 131.4 sec: 0.714260 ( -0.019514  0.019599 ) ph/cm2/s
Energy fluence (15-150 keV)             : 7.54614e-06 ( -1.89236e-07  1.88589e-07 ) ergs/cm2
1-s peak spectrum fit
Power-law model
Time interval is from    1.968 sec. to    2.968 sec.

Spectral model in power-law:
------------------------------------------------------------
Parameters  : value       lower 90%   higher 90%
Photon index: -1.03566     ( -0.034139   0.0342582 )
Norm@50keV  : 0.257855    ( -0.00495106   0.00494506 )
------------------------------------------------------------
#Fit statistic : Chi-Squared =          50.31 using 59 PHA bins.
# Reduced chi-squared =         0.8827 for     57 degrees of freedom
# Null hypothesis probability =   7.222342e-01

Photon flux (15-150 keV)    in 1 sec: 1.87684 (    ) ph/cm2/s
Energy fluence (15-150 keV)             : 2.75417e-06 ( -5.45042e-08  5.456e-08 ) ergs/cm2
Cutoff power-law model
Time interval is from    1.968 sec. to    2.968 sec.
Spectral model in the cutoff power-law:
------------------------------------------------------------
Parameters  : value       lower 90%   higher 90%
Photon index: -0.792531     ( -0.138167   0.142499 )
Epeak [keV] : 303.282      ( -88.4966 297.504 )
Norm@50keV  : 0.325426    ( -0.0394224   0.0461311 )
------------------------------------------------------------
#Fit statistic : Chi-Squared =          41.13 using 59 PHA bins.
# Reduced chi-squared =         0.7344 for     56 degrees of freedom
# Null hypothesis probability =   9.317289e-01

Photon flux (15-150 keV)    in 1 sec:  (    ) ph/cm2/s
Energy fluence (15-150 keV)             : 2.73067e-06 ( -5.66171e-08  5.6542e-08 ) ergs/cm2
Time-resolved spectra
Distribution
T90 vs. Hardness ratio plot
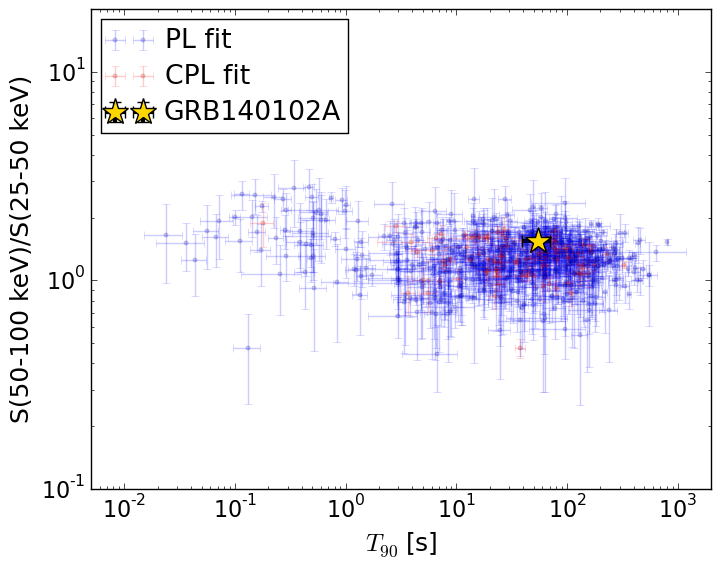
T90                                   = 55.08 sec.
Hardness ratio (energy fluence ratio) = 1.54305050921
S(15-50 keV) vs. S(50-150 keV) plot
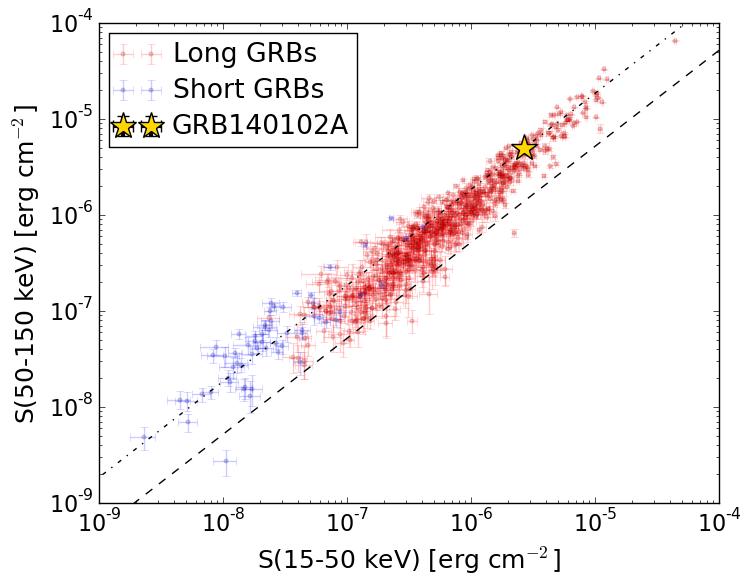
S(15-50 keV)  = 2.6556211e-06
S(50-150 keV) = 4.960978e-06
The dash-dotted line and the dashed line traces the fluences calculated from the Band function with Epeak = 15 and 150 keV, respectively. Both lines assume a canonical values of alpha = -1 and beta = -2.5.
Mask shadow pattern
IMX = 2.746303727687254E-01, IMY = 2.173074247403469E-02
Spacecraft aspect plot
Bright source in the pre-burst/pre-slew/post-slew images
Pre-burst image of 15-350 keV band
Time interval of the image:
-50.011400 -0.148000

# RAcent  DECcent POSerr Theta    Phi  PeakCts   SNR AngSep     Name
#  [deg]    [deg]    ['] [deg]  [deg]                   [']
244.9872 -15.5755    2.6  41.6  -67.6   1.2870   4.5    3.9	Sco X-1
254.4576  35.3437   19.0  38.5 -152.9   0.0646   0.6    0.1	Her X-1
208.0954  60.4102    2.5  45.1  148.3   0.9547   4.6 ------	UNKNOWN
224.5782  67.8308    3.0  52.3  158.2   1.5421   3.9 ------	UNKNOWN
237.0530  53.4750    2.4  40.7  172.7   0.5723   4.8 ------	UNKNOWN
256.2271   1.3584    2.9  41.0  -98.5   1.3440   3.9 ------	UNKNOWN
Pre-slew background subtracted image of 15-350 keV band
Time interval of the image:
-0.148000 9.188600

# RAcent  DECcent POSerr Theta    Phi  PeakCts   SNR AngSep     Name
#  [deg]    [deg]    ['] [deg]  [deg]                   [']
244.8841 -15.5391    5.0  41.5  -67.6   0.9791   2.3    8.2	Sco X-1
254.2463  35.3167   13.5  38.3 -152.9   0.1414   0.9   10.5	Her X-1
211.9146   1.3321    0.1  15.4   -4.5  11.1564 105.5 ------	UNKNOWN
249.7351  34.9077    2.4  34.7 -154.7   0.6704   4.9 ------	UNKNOWN
265.3639  46.1887    1.9  50.1 -163.1   1.5508   6.2 ------	UNKNOWN
265.6843  28.5107    2.4  46.2 -139.8   1.2238   4.7 ------	UNKNOWN
Post-slew image of 15-350 keV band
Time interval of the image:
45.788590 962.828000

# RAcent  DECcent POSerr Theta    Phi  PeakCts   SNR AngSep     Name
#  [deg]    [deg]    ['] [deg]  [deg]                   [']
244.9648 -15.6585    0.8  36.8  -85.4  25.8801  13.6    1.4	Sco X-1
254.5369  35.3626    6.9  52.2 -159.8  -2.7229  -1.7    4.1	Her X-1
170.6806 -16.0753    4.1  44.3   41.0   5.3926   2.8 ------	UNKNOWN
177.3928  -2.8125    2.7  34.7   59.0   5.0010   4.4 ------	UNKNOWN
214.9370  24.0713    3.0  22.9  163.0   2.1248   3.8 ------	UNKNOWN
234.0476  17.3489    2.2  27.0 -151.8   3.2529   5.2 ------	UNKNOWN
236.3371   8.2757    2.7  25.3 -130.9   2.6990   4.3 ------	UNKNOWN
251.0218   3.6946    3.3  39.2 -118.4   4.4133   3.5 ------	UNKNOWN