Analysis Summary
Notes:
- 1) No attempt has been made to eliminate the non-significant decimal places.
- 2) This batgrbproduct analysis is done using the HEASARC data.
- 3) This batgrbproduct analysis is using the flight position for the mask-weighting calculation.
======================================================================
                  BAT GRB EVENT DATA PROCESSING REPORT
    Process Script Ver: batgrbproduct v2.46
    Process Start Time: Mon Mar  3 23:38:12 EST 2014
             Host Name: batevent1
   Current Working Dir: /local/data/batevent/batevent_reproc/trigger582773
======================================================================

  Trigger: 00582773      Segment: 000

  BAT Trigger Time: 410401854.784   [s; MET]
      Trigger Stop: 410401855.808   [s; MET]
               UTC: 2014-01-03T00:30:43.312640    [includes UTCF correction]
       Where From?: TDRSS position message

  BAT
    RA: 232.130810843826   Dec: 37.7494585196999  [deg; J2000]

     Catalogged Source?: NO
     Point Source?:      YES
     GRB Indicated?:     YES    [ by BAT flight software ]
     Image S/N Ratio:    9.09
     Image Trigger?:     NO
     Rate S/N Ratio:     9.89949493661167  [ if not an image trigger ]
     Image S/N Ratio:    9.09

  Analysis Position:   [ source = BAT ]
    RA: 232.130810843826   Dec: 37.7494585196999  [deg; J2000]

  Refined Position:   [ source = BAT pre-slew burst ]
    RA: 232.113555010694   Dec: 37.7519682071984  [deg; J2000]
        { 15h 28m 27.3s , +37d 45' 07.1" }
         +/- 1.73884242212617 [arcmin] (estimated 90% radius based on SNR)
         +/- 0.687755010302534 [arcmin] (formal 1-sigma fit error)
    SNR: 13.8003304020724

  Angular difference between the analysis and refined position is 0.832366 arcmin

  Partial Coding Fraction: 0.484375    [ including projection effects ]

  Duration
     T90: 17.3440000414848 +/- 1.90930355320692
        Measured from: -11.5600000023842
                   to: 5.78400003910065     [s; relative to TRIGTIME]
     T50: 4.60800004005432 +/- 1.69086009519157
        Measured from: -1.76800000667572
                   to: 2.8400000333786     [s; relative to TRIGTIME]


  Fluence
     Peak Flux  (peak 1 second)
        Measured from: 0.388000011444092
                   to: 1.38800001144409     [s; relative to TRIGTIME]
     Total Fluence
        Measured from: -12.5199999809265
                   to: 6.93600004911423     [s; relative to TRIGTIME]

             Band 1     Band 2     Band 3     Band 4
              15-25      25-50     50-100    100-350     keV
 Total     0.543039   0.486504   0.117020  -0.004927
           0.041869   0.041701   0.035188   0.031128 [error]
 Peak      0.100452   0.081523   0.023053  -0.007234
           0.010717   0.010309   0.008384   0.007034 [error]

     [ fluence units of on-axis counts / fully illuminated detector ]

======================================================================


====== Table of the duration information =============================

        Value   tstart    tstop
T100   19.456  -12.520    6.936
T90    17.344  -11.560    5.784
T50     4.608   -1.768    2.840
Peak    1.000    0.388    1.388


====== Spectral Analysis Summary =====================================

Model      : spectral model: simple power-law (PL) and cutoff power-law (CPL)
Ph_index   : photon index: E^{Ph_index}
Ph_90err   : 90% error of the photon index
Epeak      : Epeak in keV
Epeak_90err: 90% error of Epeak
Norm       : normalization at 50 keV in both the PL model and CPL model
Nomr_90err : 90% error of the normalization
chi2       : Chi-Squared
dof        : degree of freedo

=== Time-averaged spectral analysis ===
(Best model with acceptable fit: N/A)

Model Ph_index Ph_90err_low Ph_90err_hi  Epeak  Epeak_90err_low  Epeak_90err_hi  Norm       Nomr_90err_low    Norm_90err_hi    chi2    dof
PL      -2.591    -0.225      0.207       -           -               -         3.00e-03     -4.91e-04          4.87e-04      74.950   57
CPL     -1.433    -0.719      1.274       17.348      N/A           N/A         1.62e-02        N/A               N/A         70.610   56


=== 1-s peak spectral analysis ===
(Best model with acceptable fit: PL)

Model Ph_index Ph_90err_low Ph_90err_hi  Epeak  Epeak_90err_low  Epeak_90err_hi  Norm       Nomr_90err_low    Norm_90err_hi    chi2    dof
PL      -2.568     -0.306     0.272       -           -               -         1.01e-02     -2.26e-03          2.24e-03      58.240   57
CPL     -1.651     -0.345     0.797       14.039      N/A           N/A         3.78e-02        N/A               N/A         56.010   56


=== Fluence/Peak Flux Summary ===

              Model    Band1     Band2     Band3     Band4     Band5     Total
                       15-25     25-50    50-100    100-350    15-150    15-350    keV
Fluence         PL   2.10e-07  2.00e-07  1.33e-07  1.38e-07  5.99e-07  6.81e-07   erg/cm2
      90%_error_low -2.60e-08 -2.24e-08 -2.86e-08 -4.87e-08 -6.97e-08 -9.59e-08   erg/cm2
      90%_error_hi   2.64e-08  2.20e-08  3.04e-08  6.46e-08  7.14e-08  1.06e-07   erg/cm2
Peak flux       PL   1.17e+00  6.33e-01  2.14e-01  9.35e-02  2.07e+00  2.11e+00   ph/cm2/s
      90%_error_low -2.00e-01 -9.55e-02 -6.00e-02 -4.07e-02 -2.84e-01 -2.90e-01   ph/cm2/s
      90%_error_hi   2.04e-01  9.39e-02  6.40e-02  5.66e-02  2.84e-01  2.90e-01   ph/cm2/s

Fluence        CPL    N/A      N/A      N/A      N/A      N/A      N/A      erg/cm2
      90%_error_low -2.60e-08 -2.24e-08 -2.86e-08 -4.87e-08 -6.97e-08 -9.59e-08   erg/cm2
      90%_error_hi   2.64e-08  2.20e-08  3.04e-08  6.46e-08  7.14e-08  1.06e-07   erg/cm2
Peak flux      CPL   1.12e+00  7.02e-01  1.95e-01  2.61e-02  2.04e+00  2.04e+00   ph/cm2/s
      90%_error_low -2.19e-01     N/A   -7.78e-02     N/A   -2.85e-01 -2.87e-01   ph/cm2/s
      90%_error_hi   2.14e-01     N/A    7.41e-02     N/A    2.85e-01  2.90e-01   ph/cm2/s

======================================================================
Image
Pre-slew 15.0-350.0 keV image (Event data)

#   RAcent    DECcent   POSerr    Theta     Phi              Peak Cts       SNR   Name
  232.1136    37.7520   0.0139    40.8985  -179.4794         1.1947861     13.800 TRIG_00582773

Foreground time interval of the image:
-12.520   6.936 (delta_t =  19.456 [sec])
Background time interval of the image:
-239.784 -12.520 (delta_t = 227.264 [sec])
Light Curves
Note: The mask-weighted lightcurves have units of either count/det or counts/sec/det, where a det is 0.4 x 0.4 = 0.16 sq cm.
Full-time range; 1 s binning
Other quick-look light curves:
- 64 ms binning (zoomed)
- 16 ms binning (zoomed)
- 8 ms binning (zoomed)
- 2 ms binning (zoomed)
- SN=5 or 10 s binning (full-time range)
- Raw light curve
Spectra
- 64 ms binning (zoomed)
- 16 ms binning (zoomed)
- 8 ms binning (zoomed)
- 2 ms binning (zoomed)
- SN=5 or 10 s binning (full-time range)
- Raw light curve
Spectra
Notes:
- 1) The fitting includes the systematic errors.
- 2) When the burst includes telescope slew time periods, the fitting uses an average response file made from multiple 5-s response files through out the slew time plus single time preiod for the non-slew times, and weighted by the total counts in the corresponding time period using addrmf. An average response file is needed becuase a spectral fit using the pre-slew DRM will introduce some errors in both a spectral shape and a normalization if the PHA file contains a lot of the slew/post-slew time interval.
- 3) For fits to more complicated models (e.g. a power-law over a cutoff power-law), the BAT team has decided to require a chi-square improvement of more than 6 for each extra dof.
Time averaged spectrum fit using the average DRM
Power-law model

Time interval is from  -12.520 sec. to    6.936 sec.

Spectral model in power-law:
------------------------------------------------------------
Parameters  : value       lower 90%   higher 90%
Photon index: -2.59077     ( -0.224923   0.207026 )
Norm@50keV  : 3.00049E-03    ( -0.00049058   0.000487272 )
------------------------------------------------------------
#Fit statistic : Chi-Squared =          74.95 using 59 PHA bins.
# Reduced chi-squared =          1.315 for     57 degrees of freedom
# Null hypothesis probability =   5.564742e-02

Photon flux (15-150 keV)    in 19.46 sec: 0.623899 ( -0.061612  0.061623 ) ph/cm2/s
Energy fluence (15-150 keV)             : 5.99463e-07 ( -6.96866e-08  7.13672e-08 ) ergs/cm2
Cutoff power-law model

Time interval is from  -12.520 sec. to    6.936 sec.
Spectral model in the cutoff power-law:
------------------------------------------------------------
Parameters  : value       lower 90%   higher 90%
Photon index: -1.43342     ( -0.719357   1.27403 )
Epeak [keV] : 17.3479      (   )
Norm@50keV  : 1.62418E-02    (     )
------------------------------------------------------------
#Fit statistic : Chi-Squared =          70.61 using 59 PHA bins.
# Reduced chi-squared =          1.261 for     56 degrees of freedom
# Null hypothesis probability =   9.053276e-02

Photon flux (15-150 keV)    in 19.46 sec: 0.603665 ( -0.063334  0.06347 ) ph/cm2/s
Energy fluence (15-150 keV)             : 0 ( 0  0 ) ergs/cm2
1-s peak spectrum fit
Power-law model

Time interval is from    0.388 sec. to    1.388 sec.

Spectral model in power-law:
------------------------------------------------------------
Parameters  : value       lower 90%   higher 90%
Photon index: -2.56819     ( -0.306123   0.271983 )
Norm@50keV  : 1.01065E-02    ( -0.00226477   0.00223574 )
------------------------------------------------------------
#Fit statistic : Chi-Squared =          58.24 using 59 PHA bins.
# Reduced chi-squared =          1.022 for     57 degrees of freedom
# Null hypothesis probability =   4.294959e-01

Photon flux (15-150 keV)    in 1 sec: 2.07163 ( -0.28352  0.28352 ) ph/cm2/s
Energy fluence (15-150 keV)             : 1.03055e-07 ( -1.66975e-08  1.71881e-08 ) ergs/cm2
Cutoff power-law model

Time interval is from    0.388 sec. to    1.388 sec.
Spectral model in the cutoff power-law:
------------------------------------------------------------
Parameters  : value       lower 90%   higher 90%
Photon index: -1.65082     ( -0.344856   0.79748 )
Epeak [keV] : 14.0388      (   )
Norm@50keV  : 3.78399E-02    (     )
------------------------------------------------------------
#Fit statistic : Chi-Squared =          56.01 using 59 PHA bins.
# Reduced chi-squared =          1.000 for     56 degrees of freedom
# Null hypothesis probability =   4.745419e-01

Photon flux (15-150 keV)    in 1 sec: 2.03519 ( -0.28451  0.28532 ) ph/cm2/s
Energy fluence (15-150 keV)             : 0 ( 0  0 ) ergs/cm2
Time-resolved spectra

Distribution
T90 vs. Hardness ratio plot

T90                                   = N/A sec.
Hardness ratio (energy fluence ratio) = N/A
S(15-50 keV) vs. S(50-150 keV) plot
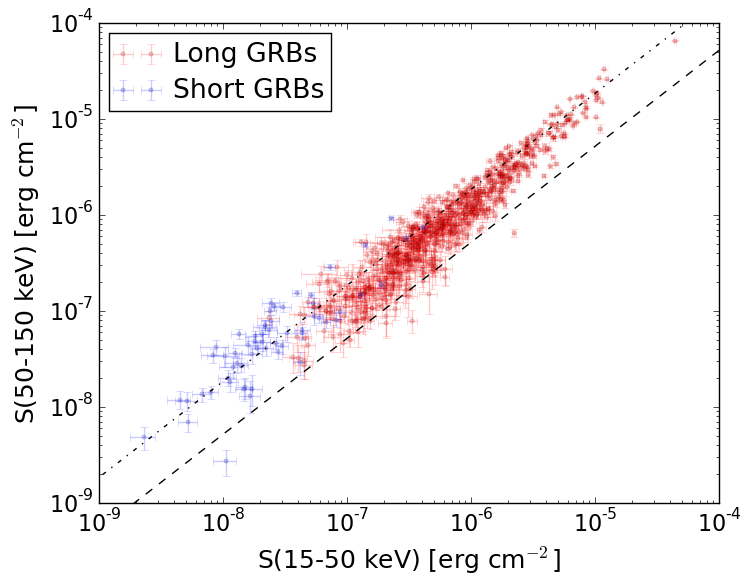
S(15-50 keV)  = N/A
S(50-150 keV) = N/A
The dash-dotted line and the dashed line traces the fluences calculated from the Band function with Epeak = 15 and 150 keV, respectively. Both lines assume a canonical values of alpha = -1 and beta = -2.5.
Mask shadow pattern

IMX = -8.661470603614726E-01, IMY = 7.870336004790913E-03
Spacecraft aspect plot

Bright source in the pre-burst/pre-slew/post-slew images
Pre-burst image of 15-350 keV band
Time interval of the image:
-239.784000 -12.520000

# RAcent  DECcent POSerr Theta    Phi  PeakCts   SNR AngSep     Name
#  [deg]    [deg]    ['] [deg]  [deg]                   [']
244.9631 -15.6434    1.0  36.8  -85.4   6.5091  11.7    1.0	Sco X-1
254.5387  35.4169   18.1  52.2 -159.8  -0.3356  -0.6    6.0	Her X-1
177.7019  24.3825    3.7  40.3  103.5   2.6127   3.1 ------	UNKNOWN
221.8412  24.3711    2.2  25.0  177.7   1.0746   5.4 ------	UNKNOWN
244.9435 -24.5088    2.1  41.1  -73.1   4.3263   5.4 ------	UNKNOWN
Pre-slew background subtracted image of 15-350 keV band
Time interval of the image:
-12.520000 6.936000

# RAcent  DECcent POSerr Theta    Phi  PeakCts   SNR AngSep     Name
#  [deg]    [deg]    ['] [deg]  [deg]                   [']
244.7985 -15.7084    3.4  36.7  -85.2   0.4236   3.4   11.2	Sco X-1
254.5175  35.3039    7.4  52.1 -159.7  -0.2213  -1.6    3.7	Her X-1
232.1135  37.7520    0.8  40.9 -179.5   1.1950  13.8 ------	UNKNOWN
248.1213  10.8695    3.2  37.2 -130.5   0.2874   3.7 ------	UNKNOWN
226.2791 -38.4336    2.3  41.9  -41.1   0.4786   5.0 ------	UNKNOWN
Post-slew image of 15-350 keV band
Time interval of the image:
152.516590 962.317400

# RAcent  DECcent POSerr Theta    Phi  PeakCts   SNR AngSep     Name
#  [deg]    [deg]    ['] [deg]  [deg]                   [']
254.4108  35.1336    0.0  18.1 -130.7   0.6294   1.1   12.7	Her X-1
299.5950  35.2671    3.4  53.1 -151.5   6.9262   3.4    3.9	Cyg X-1
308.1234  40.9956   60.2  56.9 -161.2  -0.5900  -0.2    2.6	Cyg X-3
250.6422  56.7981    4.0  22.7  164.7   1.4805   2.9 ------	UNKNOWN
207.8122  -4.5955    2.6  48.0   -8.7   4.2442   4.3 ------	UNKNOWN