Analysis Summary
Notes:
- 1) No attempt has been made to eliminate the non-significant decimal places.
- 2) This batgrbproduct analysis is done using the HEASARC data.
- 3) This batgrbproduct analysis is using the flight position for the mask-weighting calculation.
======================================================================
BAT GRB EVENT DATA PROCESSING REPORT
Process Script Ver: batgrbproduct v2.46
Process Start Time: Mon Mar 3 23:41:09 EST 2014
Host Name: batevent1
Current Working Dir: /local/data/batevent/batevent_reproc/trigger583338
======================================================================
Trigger: 00583338 Segment: 000
BAT Trigger Time: 410894334.016 [s; MET]
Trigger Stop: 410894334.528 [s; MET]
UTC: 2014-01-08T17:18:42.521660 [includes UTCF correction]
Where From?: TDRSS position message
BAT
RA: 325.177722335241 Dec: 58.7661610684908 [deg; J2000]
Catalogged Source?: NO
Point Source?: YES
GRB Indicated?: YES [ by BAT flight software ]
Image S/N Ratio: 9.2
Image Trigger?: NO
Rate S/N Ratio: 16.0312195418814 [ if not an image trigger ]
Image S/N Ratio: 9.2
Analysis Position: [ source = BAT ]
RA: 325.177722335241 Dec: 58.7661610684908 [deg; J2000]
Refined Position: [ source = BAT pre-slew burst ]
RA: 325.126765988942 Dec: 58.7486335651162 [deg; J2000]
{ 21h 40m 30.4s , +58d 44' 55.1" }
+/- 0.686445825781888 [arcmin] (estimated 90% radius based on SNR)
+/- 0.20752684705495 [arcmin] (formal 1-sigma fit error)
SNR: 52.0640557710195
Angular difference between the analysis and refined position is 1.902780 arcmin
Partial Coding Fraction: 0.7109375 [ including projection effects ]
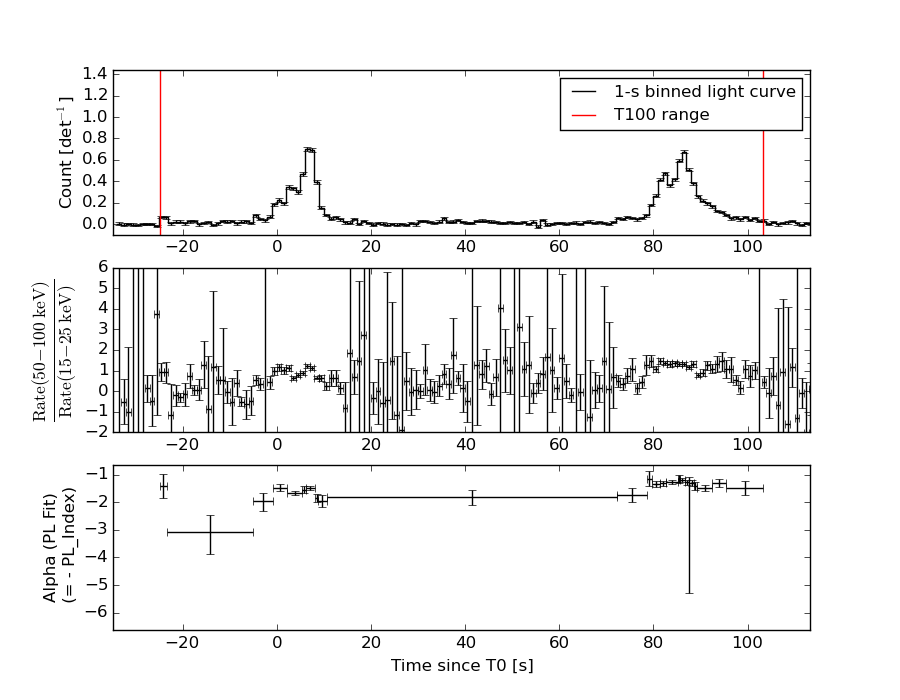
Duration
T90: 95.2319999337196 +/- 3.22426050489663
Measured from: -1.51599997282028
to: 93.7159999608994 [s; relative to TRIGTIME]
T50: 79.7399999499321 +/- 0.277416667179266
Measured from: 6.41200000047684
to: 86.1519999504089 [s; relative to TRIGTIME]
Fluence
Peak Flux (peak 1 second)
Measured from: 6.48800003528595
to: 7.48800003528595 [s; relative to TRIGTIME]
Total Fluence
Measured from: -24.9079999923706
to: 103.260000050068 [s; relative to TRIGTIME]
Band 1 Band 2 Band 3 Band 4
15-25 25-50 50-100 100-350 keV
Total 3.387824 4.397191 3.207993 0.830063
0.075650 0.078376 0.068403 0.057072 [error]
Peak 0.183621 0.268101 0.235907 0.055403
0.010394 0.011643 0.011049 0.007651 [error]
[ fluence units of on-axis counts / fully illuminated detector ]
======================================================================
====== Table of the duration information =============================
Value tstart tstop
T100 128.168 -24.908 103.260
T90 95.232 -1.516 93.716
T50 79.740 6.412 86.152
Peak 1.000 6.488 7.488
====== Spectral Analysis Summary =====================================
Model : spectral model: simple power-law (PL) and cutoff power-law (CPL)
Ph_index : photon index: E^{Ph_index}
Ph_90err : 90% error of the photon index
Epeak : Epeak in keV
Epeak_90err: 90% error of Epeak
Norm : normalization at 50 keV in both the PL model and CPL model
Nomr_90err : 90% error of the normalization
chi2 : Chi-Squared
dof : degree of freedo
=== Time-averaged spectral analysis ===
(Best model with acceptable fit: PL)
Model Ph_index Ph_90err_low Ph_90err_hi Epeak Epeak_90err_low Epeak_90err_hi Norm Nomr_90err_low Norm_90err_hi chi2 dof
PL -1.534 -0.047 0.047 - - - 5.90e-03 -1.39e-04 1.39e-04 44.700 57
CPL -1.505 -0.071 0.153 962.001 -962.001 -962.001 6.08e-03 -3.02e-04 9.98e-04 44.790 56
=== 1-s peak spectral analysis ===
(Best model with acceptable fit: PL)
Model Ph_index Ph_90err_low Ph_90err_hi Epeak Epeak_90err_low Epeak_90err_hi Norm Nomr_90err_low Norm_90err_hi chi2 dof
PL -1.424 -0.085 0.084 - - - 4.96e-02 -2.42e-03 2.42e-03 59.190 57
CPL -1.093 -0.314 0.339 143.011 -47.572 941.949 7.19e-02 -2.09e-02 3.21e-02 55.910 56
=== Fluence/Peak Flux Summary ===
Model Band1 Band2 Band3 Band4 Band5 Total
15-25 25-50 50-100 100-350 15-150 15-350 keV
Fluence PL 9.97e-07 1.80e-06 2.48e-06 7.13e-06 7.14e-06 1.24e-05 erg/cm2
90%_error_low -4.87e-08 -5.00e-08 -7.28e-08 -4.80e-07 -1.76e-07 -5.16e-07 erg/cm2
90%_error_hi 4.98e-08 4.99e-08 7.26e-08 5.05e-07 1.76e-07 5.35e-07 erg/cm2
Peak flux PL 1.90e+00 2.00e+00 1.49e+00 1.79e+00 6.07e+00 7.18e+00 ph/cm2/s
90%_error_low -1.63e-01 -1.06e-01 -9.01e-02 -2.16e-01 -3.00e-01 -3.54e-01 ph/cm2/s
90%_error_hi 1.67e-01 1.06e-01 8.96e-02 2.33e-01 3.00e-01 3.56e-01 ph/cm2/s
Fluence CPL 9.98e-07 1.80e-06 2.48e-06 7.14e-06 7.14e-06 1.24e-05 erg/cm2
90%_error_low -6.48e-08 -4.48e-08 -7.20e-08 -1.73e-06 -1.78e-07 -1.53e-06 erg/cm2
90%_error_hi 4.93e-08 5.21e-08 7.66e-08 5.23e-07 1.75e-07 2.88e-07 erg/cm2
Peak flux CPL 1.77e+00 2.05e+00 1.54e+00 1.25e+00 5.98e+00 6.61e+00 ph/cm2/s
90%_error_low -1.98e-01 -1.19e-01 -1.02e-01 -3.54e-01 -3.12e-01 -4.87e-01 ph/cm2/s
90%_error_hi 2.02e-01 1.20e-01 1.04e-01 5.20e-01 3.12e-01 5.95e-01 ph/cm2/s
======================================================================
Image
Pre-slew 15.0-350.0 keV image (Event data)
#   RAcent    DECcent   POSerr    Theta     Phi              Peak Cts       SNR   Name
  325.1268    58.7486   0.0037    25.2363   147.7404         5.0542843     52.064 TRIG_00583338

Foreground time interval of the image:
-24.908  11.485 (delta_t =  36.393 [sec])
Background time interval of the image:
-239.016 -24.908 (delta_t = 214.108 [sec])
Light Curves
Note: The mask-weighted lightcurves have units of either count/det or counts/sec/det, where a det is 0.4 x 0.4 = 0.16 sq cm.
Full-time range; 1 s binning
Other quick-look light curves:
- 64 ms binning (zoomed)
- 16 ms binning (zoomed)
- 8 ms binning (zoomed)
- 2 ms binning (zoomed)
- SN=5 or 10 s binning (full-time range)
- Raw light curve
Spectra
- 64 ms binning (zoomed)
- 16 ms binning (zoomed)
- 8 ms binning (zoomed)
- 2 ms binning (zoomed)
- SN=5 or 10 s binning (full-time range)
- Raw light curve
Spectra
Notes:
- 1) The fitting includes the systematic errors.
- 2) When the burst includes telescope slew time periods, the fitting uses an average response file made from multiple 5-s response files through out the slew time plus single time preiod for the non-slew times, and weighted by the total counts in the corresponding time period using addrmf. An average response file is needed becuase a spectral fit using the pre-slew DRM will introduce some errors in both a spectral shape and a normalization if the PHA file contains a lot of the slew/post-slew time interval.
- 3) For fits to more complicated models (e.g. a power-law over a cutoff power-law), the BAT team has decided to require a chi-square improvement of more than 6 for each extra dof.
Time averaged spectrum fit using the average DRM
Power-law model
Time interval is from  -24.908 sec. to  103.260 sec.

Spectral model in power-law:
------------------------------------------------------------
Parameters  : value       lower 90%   higher 90%
Photon index: -1.53369     ( -0.0467632   0.0467481 )
Norm@50keV  : 5.90363E-03    ( -0.00013878   0.000138778 )
------------------------------------------------------------
#Fit statistic : Chi-Squared =          44.70 using 59 PHA bins.
# Reduced chi-squared =         0.7842 for     57 degrees of freedom
# Null hypothesis probability =   8.816537e-01

Photon flux (15-150 keV)    in 128.2 sec: 0.743906 ( -0.01986  0.019972 ) ph/cm2/s
Energy fluence (15-150 keV)             : 7.14296e-06 ( -1.75922e-07  1.76148e-07 ) ergs/cm2
Cutoff power-law model
Time interval is from  -24.908 sec. to  103.260 sec.
Spectral model in the cutoff power-law:
------------------------------------------------------------
Parameters  : value       lower 90%   higher 90%
Photon index: -1.53111     ( -0.0440502   0.180204 )
Epeak [keV] : 9997.92      ( -9997.96 -9997.96 )
Norm@50keV  : 5.91997E-03    ( -0.00013922   0.00116014 )
------------------------------------------------------------
#Fit statistic : Chi-Squared =          44.70 using 59 PHA bins.
# Reduced chi-squared =         0.7983 for     56 degrees of freedom
# Null hypothesis probability =   8.609931e-01

Photon flux (15-150 keV)    in 128.2 sec: 0.744079 ( -0.022756  0.019561 ) ph/cm2/s
Energy fluence (15-150 keV)             : 7.14443e-06 ( -1.78199e-07  1.74674e-07 ) ergs/cm2
1-s peak spectrum fit
Power-law model
Time interval is from    6.488 sec. to    7.488 sec.

Spectral model in power-law:
------------------------------------------------------------
Parameters  : value       lower 90%   higher 90%
Photon index: -1.42447     ( -0.0848293   0.0844175 )
Norm@50keV  : 4.95578E-02    ( -0.00242502   0.00242142 )
------------------------------------------------------------
#Fit statistic : Chi-Squared =          59.19 using 59 PHA bins.
# Reduced chi-squared =          1.038 for     57 degrees of freedom
# Null hypothesis probability =   3.954461e-01

Photon flux (15-150 keV)    in 1 sec: 6.06971 ( -0.30013  0.30041 ) ph/cm2/s
Energy fluence (15-150 keV)             : 4.76585e-07 ( -2.57891e-08  2.5908e-08 ) ergs/cm2
Cutoff power-law model
Time interval is from    6.488 sec. to    7.488 sec.
Spectral model in the cutoff power-law:
------------------------------------------------------------
Parameters  : value       lower 90%   higher 90%
Photon index: -1.09255     ( -0.314424   0.338587 )
Epeak [keV] : 143.011      ( -47.5717 941.947 )
Norm@50keV  : 7.19274E-02    ( -0.0208709   0.0320526 )
------------------------------------------------------------
#Fit statistic : Chi-Squared =          55.91 using 59 PHA bins.
# Reduced chi-squared =         0.9983 for     56 degrees of freedom
# Null hypothesis probability =   4.783473e-01

Photon flux (15-150 keV)    in 1 sec: 5.97731 ( -0.31228  0.31228 ) ph/cm2/s
Energy fluence (15-150 keV)             : 4.66573e-07 ( -2.77696e-08  2.76922e-08 ) ergs/cm2
Time-resolved spectra
Distribution
T90 vs. Hardness ratio plot
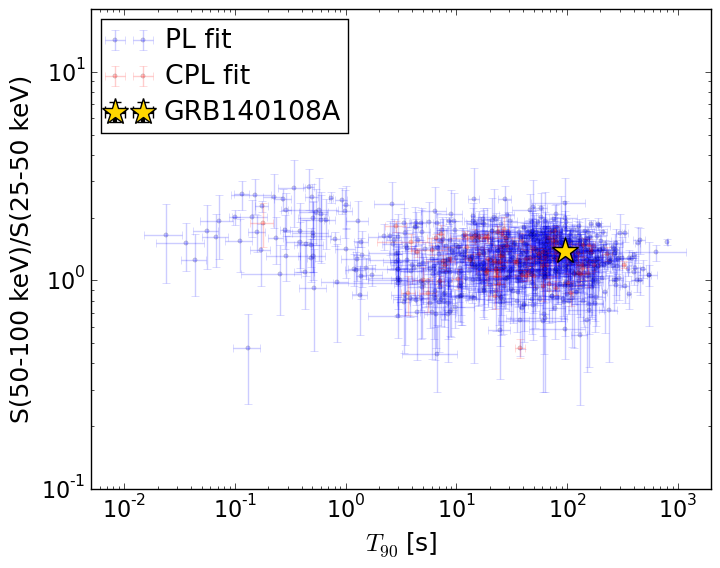
T90                                   = 95.232 sec.
Hardness ratio (energy fluence ratio) = 1.38159353053
S(15-50 keV) vs. S(50-150 keV) plot
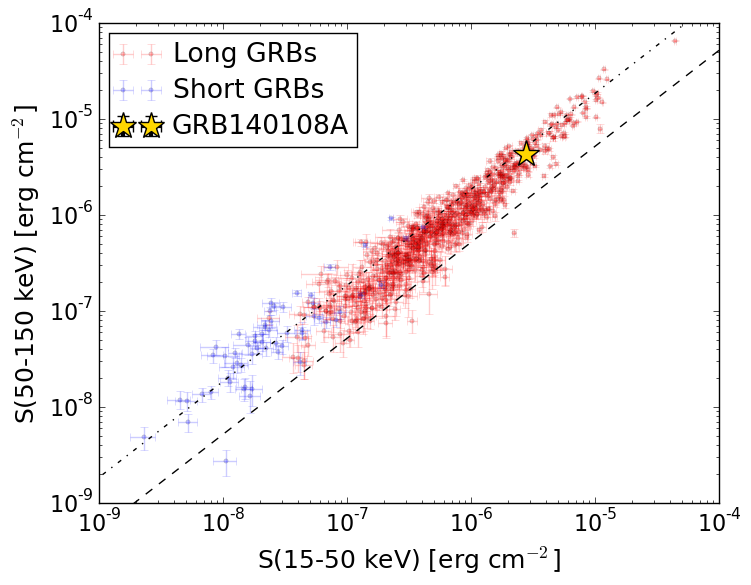
S(15-50 keV)  = 2.7929529e-06
S(50-150 keV) = 4.350004e-06
The dash-dotted line and the dashed line traces the fluences calculated from the Band function with Epeak = 15 and 150 keV, respectively. Both lines assume a canonical values of alpha = -1 and beta = -2.5.
Mask shadow pattern
IMX = -3.985814177049650E-01, IMY = -2.515799622929416E-01
Spacecraft aspect plot
Bright source in the pre-burst/pre-slew/post-slew images
Pre-burst image of 15-350 keV band
Time interval of the image:
-239.016000 -24.908000

# RAcent  DECcent POSerr Theta    Phi  PeakCts   SNR AngSep     Name
#  [deg]    [deg]    ['] [deg]  [deg]                   [']
254.2142  35.4018    4.8  26.0  -15.6  -0.4875  -2.4   12.4	Her X-1
288.8078  10.9377    3.0  38.5  -91.7   2.6302   3.8    0.7	GRS 1915+105
299.5913  35.1964    0.7  18.0 -128.7   3.1827  16.1    0.3	Cyg X-1
308.0871  40.9398    4.7  18.6 -157.0   0.4748   2.5    1.3	Cyg X-3
326.0465  38.2240    4.5  31.6 -170.2   0.5725   2.6    8.3	Cyg X-2
220.8443  56.5081    2.7  37.6   41.1   1.5394   4.3 ------	UNKNOWN
Pre-slew background subtracted image of 15-350 keV band
Time interval of the image:
-24.908000 11.484610

# RAcent  DECcent POSerr Theta    Phi  PeakCts   SNR AngSep     Name
#  [deg]    [deg]    ['] [deg]  [deg]                   [']
254.5480  35.5246    0.0  25.7  -15.8  -0.1134  -1.2   11.8	Her X-1
288.7110  11.0357    6.5  38.4  -91.6   0.5136   1.8    7.5	GRS 1915+105
299.7138  35.1949    5.2  18.0 -129.0  -0.2066  -2.2    6.1	Cyg X-1
308.2616  40.7852    0.0  18.8 -156.9   0.0778   0.9   12.2	Cyg X-3
326.2613  38.1970    5.7  31.7 -170.4  -0.2006  -2.0    8.6	Cyg X-2
258.3709  79.6485    2.7  31.7   86.6   0.7505   4.2 ------	UNKNOWN
339.9524  73.3200    2.1  33.7  120.5   0.9984   5.6 ------	UNKNOWN
329.4897  61.5703    2.2  27.6  141.8   0.5645   5.2 ------	UNKNOWN
325.1267  58.7486    0.2  25.2  147.7   5.0543  52.1 ------	UNKNOWN
294.7614  23.6089    2.6  26.9 -106.1   0.5201   4.4 ------	UNKNOWN
345.3646  15.8777    2.2  59.2 -163.0   2.8389   5.2 ------	UNKNOWN
295.5401  19.1554    2.3  31.4 -105.2   0.6776   5.0 ------	UNKNOWN
235.8431   6.6854    2.6  58.9  -24.3   2.5055   4.5 ------	UNKNOWN
270.8260   7.3526    3.1  43.5  -65.0   1.4038   3.7 ------	UNKNOWN
282.8623   8.1908    2.3  41.1  -82.4   1.8224   5.0 ------	UNKNOWN
Post-slew image of 15-350 keV band
Time interval of the image:
57.684600 963.074000

# RAcent  DECcent POSerr Theta    Phi  PeakCts   SNR AngSep     Name
#  [deg]    [deg]    ['] [deg]  [deg]                   [']
254.6449  35.3596    5.3  50.5  -27.2  -2.7598  -2.2    9.2	Her X-1
299.5711  35.2087    0.6  28.9  -75.4  14.2155  18.8    1.0	Cyg X-1
308.1232  40.9418    1.5  20.8  -83.7   5.1667   8.0    0.9	Cyg X-3
326.1208  38.4087    3.4  20.4 -124.4   2.0054   3.4    5.7	Cyg X-2
 20.2762  62.0705    2.7  26.6  117.0   2.9145   4.2 ------	UNKNOWN
325.1374  58.7317    0.7   0.0 -117.7   7.9286  16.2 ------	UNKNOWN
256.4141  56.9106    2.4  35.0   -4.7   3.4044   4.7 ------	UNKNOWN
306.8691  59.1682    2.5   9.4  -21.9   2.3956   4.6 ------	UNKNOWN
318.6966  15.7663    3.0  43.3 -113.1   9.6392   3.9 ------	UNKNOWN