Analysis Summary
Notes:
- 1) No attempt has been made to eliminate the non-significant decimal places.
- 2) This batgrbproduct analysis is done using the HEASARC data.
- 3) This batgrbproduct analysis is using the flight position for the mask-weighting calculation.
======================================================================
BAT GRB EVENT DATA PROCESSING REPORT
Process Script Ver: batgrbproduct v2.46
Process Start Time: Mon Mar 3 23:44:00 EST 2014
Host Name: batevent1
Current Working Dir: /local/data/batevent/batevent_reproc/trigger583861
======================================================================
Trigger: 00583861 Segment: 000
BAT Trigger Time: 411393472 [s; MET]
Trigger Stop: 411393536 [s; MET]
UTC: 2014-01-14T11:57:40.482160 [includes UTCF correction]
Where From?: TDRSS position message
BAT
RA: 188.482555589256 Dec: 27.9264396826658 [deg; J2000]
Catalogged Source?: NO
Point Source?: YES
GRB Indicated?: YES [ by BAT flight software ]
Image S/N Ratio: 7.96
Image Trigger?: YES
Rate S/N Ratio: 0 [ if not an image trigger ]
Image S/N Ratio: 7.96
Analysis Position: [ source = BAT ]
RA: 188.482555589256 Dec: 27.9264396826658 [deg; J2000]
Refined Position: [ source = BAT pre-slew burst ]
RA: 188.495258015931 Dec: 27.9396513490374 [deg; J2000]
{ 12h 33m 58.9s , +27d 56' 22.7" }
+/- 1.92888653613018 [arcmin] (estimated 90% radius based on SNR)
+/- 0.830706882341634 [arcmin] (formal 1-sigma fit error)
SNR: 11.8997381825249
Angular difference between the analysis and refined position is 1.040085 arcmin
Partial Coding Fraction: 1.015625 [ including projection effects ]
Duration
T90: 139.947999954224 +/- 15.8801637489094
Measured from: 43.6079999804497
to: 183.555999934673 [s; relative to TRIGTIME]
T50: 52.783999979496 +/- 3.21291203934822
Measured from: 87.1679999828339
to: 139.95199996233 [s; relative to TRIGTIME]
Fluence
Peak Flux (peak 1 second)
Measured from: 115.879999995232
to: 116.879999995232 [s; relative to TRIGTIME]
Total Fluence
Measured from: 19.444000005722
to: 202.519999980927 [s; relative to TRIGTIME]
Band 1 Band 2 Band 3 Band 4
15-25 25-50 50-100 100-350 keV
Total 2.566649 2.512148 1.161806 0.241156
0.077727 0.080065 0.069262 0.059073 [error]
Peak 0.047589 0.044989 0.018141 0.006854
0.006160 0.006561 0.005504 0.004524 [error]
[ fluence units of on-axis counts / fully illuminated detector ]
======================================================================
====== Table of the duration information =============================
Value tstart tstop
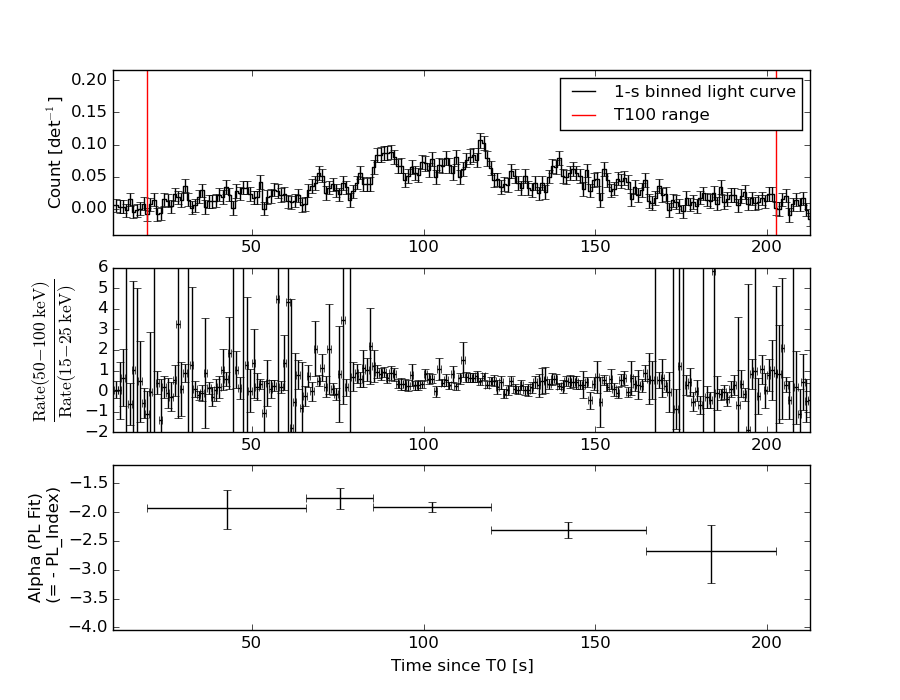
T100 183.076 19.444 202.520
T90 139.948 43.608 183.556
T50 52.784 87.168 139.952
Peak 1.000 115.880 116.880
====== Spectral Analysis Summary =====================================
Model : spectral model: simple power-law (PL) and cutoff power-law (CPL)
Ph_index : photon index: E^{Ph_index}
Ph_90err : 90% error of the photon index
Epeak : Epeak in keV
Epeak_90err: 90% error of Epeak
Norm : normalization at 50 keV in both the PL model and CPL model
Nomr_90err : 90% error of the normalization
chi2 : Chi-Squared
dof : degree of freedo
=== Time-averaged spectral analysis ===
(Best model with acceptable fit: PL)
Model Ph_index Ph_90err_low Ph_90err_hi Epeak Epeak_90err_low Epeak_90err_hi Norm Nomr_90err_low Norm_90err_hi chi2 dof
PL -2.069 -0.088 0.087 - - - 1.88e-03 -9.56e-05 9.47e-05 52.750 57
CPL -1.803 -0.323 0.375 32.467 -27.869 16.263 2.64e-03 -9.01e-04 1.56e-03 51.020 56
=== 1-s peak spectral analysis ===
(Best model with acceptable fit: PL)
Model Ph_index Ph_90err_low Ph_90err_hi Epeak Epeak_90err_low Epeak_90err_hi Norm Nomr_90err_low Norm_90err_hi chi2 dof
PL -2.069 -0.319 0.287 - - - 6.11e-03 -1.36e-03 1.31e-03 44.990 57
CPL -1.997 1.997 1.997 1.900 -1.584 -1.900 6.75e-03 -6.75e-03 2.17e-03 44.970 56
=== Fluence/Peak Flux Summary ===
Model Band1 Band2 Band3 Band4 Band5 Total
15-25 25-50 50-100 100-350 15-150 15-350 keV
Fluence PL 7.54e-07 9.82e-07 9.35e-07 1.58e-06 3.20e-06 4.25e-06 erg/cm2
90%_error_low -5.14e-08 -4.11e-08 -6.68e-08 -2.23e-07 -1.49e-07 -2.87e-07 erg/cm2
90%_error_hi 5.26e-08 4.11e-08 6.74e-08 2.48e-07 1.50e-07 3.05e-07 erg/cm2
Peak flux PL 4.36e-01 3.14e-01 1.50e-01 1.01e-01 9.47e-01 1.00e+00 ph/cm2/s
90%_error_low -8.80e-02 -5.00e-02 -4.23e-02 -4.50e-02 -1.46e-01 -1.58e-01 ph/cm2/s
90%_error_hi 8.98e-02 4.95e-02 4.40e-02 6.29e-02 1.46e-01 1.59e-01 ph/cm2/s
Fluence CPL 7.28e-07 1.01e-06 9.27e-07 9.95e-07 3.10e-06 3.66e-06 erg/cm2
90%_error_low -6.16e-08 -5.03e-08 -7.17e-08 -4.25e-07 -1.89e-07 -4.81e-07 erg/cm2
90%_error_hi 6.09e-08 5.17e-08 7.06e-08 8.22e-07 1.91e-07 8.49e-07 erg/cm2
Peak flux CPL 4.35e-01 3.15e-01 1.51e-01 9.77e-02 9.46e-01 9.98e-01 ph/cm2/s
90%_error_low -9.31e-02 -5.84e-02 -4.05e-02 -4.21e-02 -1.45e-01 -1.53e-01 ph/cm2/s
90%_error_hi 9.17e-02 4.82e-02 4.24e-02 4.09e-02 1.48e-01 1.74e-01 ph/cm2/s
======================================================================
Image
Pre-slew 15.0-350.0 keV image (Event data)
#   RAcent    DECcent   POSerr    Theta     Phi              Peak Cts       SNR   Name
  188.4953    27.9397   0.0162     6.9139  -168.0670         1.0168156     11.900 TRIG_00583861

Foreground time interval of the image:
 19.444  72.501 (delta_t =  53.057 [sec])
Background time interval of the image:
-239.000  19.444 (delta_t = 258.444 [sec])
Light Curves
Note: The mask-weighted lightcurves have units of either count/det or counts/sec/det, where a det is 0.4 x 0.4 = 0.16 sq cm.
Full-time range; 1 s binning
Other quick-look light curves:
- 64 ms binning (zoomed)
- 16 ms binning (zoomed)
- 8 ms binning (zoomed)
- 2 ms binning (zoomed)
- SN=5 or 10 s binning (full-time range)
- Raw light curve
Spectra
- 64 ms binning (zoomed)
- 16 ms binning (zoomed)
- 8 ms binning (zoomed)
- 2 ms binning (zoomed)
- SN=5 or 10 s binning (full-time range)
- Raw light curve
Spectra
Notes:
- 1) The fitting includes the systematic errors.
- 2) When the burst includes telescope slew time periods, the fitting uses an average response file made from multiple 5-s response files through out the slew time plus single time preiod for the non-slew times, and weighted by the total counts in the corresponding time period using addrmf. An average response file is needed becuase a spectral fit using the pre-slew DRM will introduce some errors in both a spectral shape and a normalization if the PHA file contains a lot of the slew/post-slew time interval.
- 3) For fits to more complicated models (e.g. a power-law over a cutoff power-law), the BAT team has decided to require a chi-square improvement of more than 6 for each extra dof.
Time averaged spectrum fit using the average DRM
Power-law model
Time interval is from   19.444 sec. to  202.520 sec.

Spectral model in power-law:
------------------------------------------------------------
Parameters  : value       lower 90%   higher 90%
Photon index: -2.06945     ( -0.0883423   0.086729 )
Norm@50keV  : 1.88467E-03    ( -9.55859e-05   9.46846e-05 )
------------------------------------------------------------
#Fit statistic : Chi-Squared =          52.75 using 59 PHA bins.
# Reduced chi-squared =         0.9254 for     57 degrees of freedom
# Null hypothesis probability =   6.352159e-01

Photon flux (15-150 keV)    in 183.1 sec: 0.292139 ( -0.012857  0.012892 ) ph/cm2/s
Energy fluence (15-150 keV)             : 3.19793e-06 ( -1.48927e-07  1.50089e-07 ) ergs/cm2
Cutoff power-law model
Time interval is from   19.444 sec. to  202.520 sec.
Spectral model in the cutoff power-law:
------------------------------------------------------------
Parameters  : value       lower 90%   higher 90%
Photon index: -1.80314     ( -0.322864   0.374637 )
Epeak [keV] : 32.4668      ( -27.8688 16.2626 )
Norm@50keV  : 2.63543E-03    ( -0.000901434   0.00156172 )
------------------------------------------------------------
#Fit statistic : Chi-Squared =          51.02 using 59 PHA bins.
# Reduced chi-squared =         0.9111 for     56 degrees of freedom
# Null hypothesis probability =   6.633397e-01

Photon flux (15-150 keV)    in 183.1 sec: 0.286752 ( -0.014533  0.014554 ) ph/cm2/s
Energy fluence (15-150 keV)             : 3.10376e-06 ( -1.89236e-07  1.90803e-07 ) ergs/cm2
1-s peak spectrum fit
Power-law model
Time interval is from  115.880 sec. to  116.880 sec.

Spectral model in power-law:
------------------------------------------------------------
Parameters  : value       lower 90%   higher 90%
Photon index: -2.0689     ( -0.318722   0.287236 )
Norm@50keV  : 6.11038E-03    ( -0.00135861   0.00131016 )
------------------------------------------------------------
#Fit statistic : Chi-Squared =          44.99 using 59 PHA bins.
# Reduced chi-squared =         0.7894 for     57 degrees of freedom
# Null hypothesis probability =   8.751495e-01

Photon flux (15-150 keV)    in 1 sec: 0.946903 ( -0.145638  0.145657 ) ph/cm2/s
Energy fluence (15-150 keV)             : 5.66239e-08 ( -1.11617e-08  1.1599e-08 ) ergs/cm2
Cutoff power-law model
Time interval is from  115.880 sec. to  116.880 sec.
Spectral model in the cutoff power-law:
------------------------------------------------------------
Parameters  : value       lower 90%   higher 90%
Photon index: -1.99652     ( 1.99652   1.99652 )
Epeak [keV] : 1.90035      ( -1.57734 -1.89395 )
Norm@50keV  : 6.75102E-03    ( -0.00676446   0.00215932 )
------------------------------------------------------------
#Fit statistic : Chi-Squared =          44.97 using 59 PHA bins.
# Reduced chi-squared =         0.8030 for     56 degrees of freedom
# Null hypothesis probability =   8.544708e-01

Photon flux (15-150 keV)    in 1 sec: 0.945855 ( -0.145121  0.147665 ) ph/cm2/s
Energy fluence (15-150 keV)             : 0 ( 0  0 ) ergs/cm2
Time-resolved spectra
Distribution
T90 vs. Hardness ratio plot
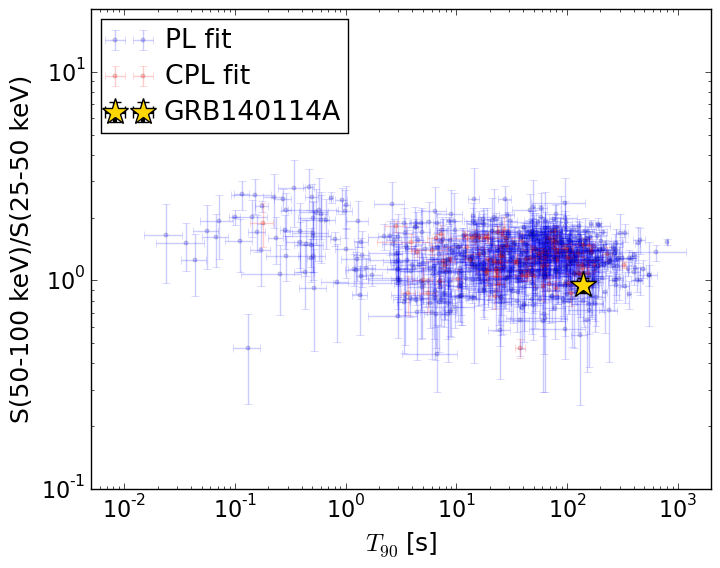
T90                                   = 139.948 sec.
Hardness ratio (energy fluence ratio) = 0.95305951144
S(15-50 keV) vs. S(50-150 keV) plot
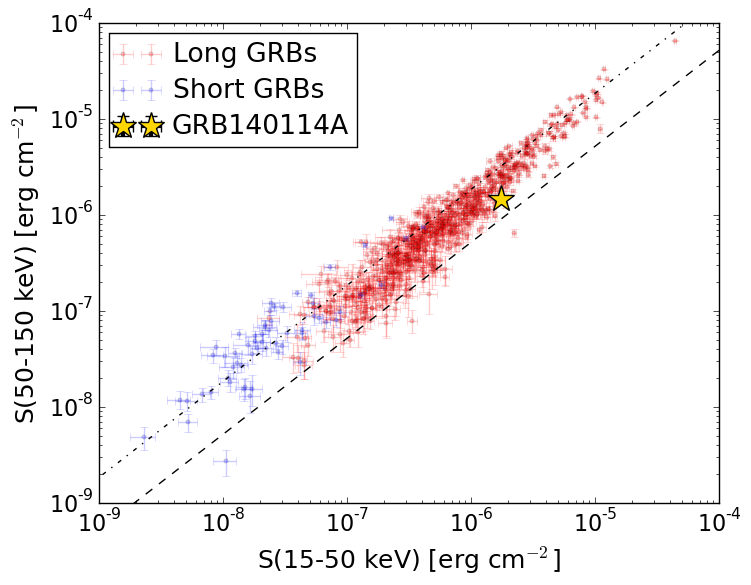
S(15-50 keV)  = 1.7358307e-06
S(50-150 keV) = 1.4621365e-06
The dash-dotted line and the dashed line traces the fluences calculated from the Band function with Epeak = 15 and 150 keV, respectively. Both lines assume a canonical values of alpha = -1 and beta = -2.5.
Mask shadow pattern
IMX = -1.186397458794859E-01, IMY = 2.507270633167256E-02
Spacecraft aspect plot
Bright source in the pre-burst/pre-slew/post-slew images
Pre-burst image of 15-350 keV band
Time interval of the image:
-239.000000 19.444000

# RAcent  DECcent POSerr Theta    Phi  PeakCts   SNR AngSep     Name
#  [deg]    [deg]    ['] [deg]  [deg]                   [']
202.5169  77.7383    2.7  56.9  179.3   5.7424   4.3 ------	UNKNOWN
202.0581  -3.6541    2.4  29.4  -38.4   1.0416   4.7 ------	UNKNOWN
218.1372  37.5163    2.9  31.9 -132.4   1.2126   4.0 ------	UNKNOWN
222.6316  -3.6942    3.1  43.5  -64.0   4.0705   3.7 ------	UNKNOWN
Pre-slew background subtracted image of 15-350 keV band
Time interval of the image:
19.444000 72.500590

# RAcent  DECcent POSerr Theta    Phi  PeakCts   SNR AngSep     Name
#  [deg]    [deg]    ['] [deg]  [deg]                   [']
188.4953  27.9396    1.0   6.9 -168.1   1.0169  11.9 ------	UNKNOWN
199.2202   5.7921    2.3  20.0  -45.6   0.4536   5.1 ------	UNKNOWN
218.8644  34.3508    2.1  31.5 -126.3   0.6100   5.4 ------	UNKNOWN
Post-slew image of 15-350 keV band
Time interval of the image:
100.500600 963.089600

# RAcent  DECcent POSerr Theta    Phi  PeakCts   SNR AngSep     Name
#  [deg]    [deg]    ['] [deg]  [deg]                   [']
185.2684  50.6567    2.6  22.9  163.0   2.1826   4.5 ------	UNKNOWN
174.5320 -27.1631    2.9  56.7    3.1  11.7539   4.0 ------	UNKNOWN
188.5346  27.9736    1.5   0.1 -153.8   3.5823   7.6 ------	UNKNOWN
184.4347  -6.8497    4.2  35.0   -4.8   1.7508   2.8 ------	UNKNOWN
210.8282  23.5389    3.6  20.6  -94.6   1.7161   3.2 ------	UNKNOWN
224.6229  39.4504    2.8  32.0 -132.4   3.1579   4.2 ------	UNKNOWN
206.4708  -4.7740    3.7  37.0  -42.5   2.4703   3.2 ------	UNKNOWN
238.7867  29.4084    2.9  43.8 -116.3  10.5489   4.0 ------	UNKNOWN
236.6337  25.8331    2.7  42.7 -110.6  10.3436   4.5 ------	UNKNOWN
236.4966  25.4514    3.7  42.7 -110.0   8.7700   3.8 ------	UNKNOWN